Antidiabetic Synergistic Effects of Medicinal Plant Extract Mixtures on db/db Mice
Sang Geun Roh and Won Chul Choi*
Department of Biology, College of Natural Sciences, Pusan National University, Jangjeon-2-dong, Geumjeong-gu, Busan, 639-735, Korea
Received October 27, 2010 /Accepted February 11, 2011This study investigates the effects of Psidium guajava L. leaf (Pg) extract, Lagerstroemia speciosa L. leaf (Ls) extract, and mixture A (Pg, Ls, Morus indica L. leaf, Pinus densiflora needles, Acanthopanax sentico- sus M. roots extract) on db/db mice. For four weeks, db/db mice were fed powdered extracts of Pg, Ls, and mixture A. Compared to the diabetic control, extracts of Pg, Ls and mixture A decreased body weight, glucose and insulin. The greatest decreases were caused by mixture A. These extracts de- creased the levels of total cholesterol, triglyceride and free fatty acid compared to the diabetic control.
The antihyperlipidemic effect of mixture A was the greatest. Mixture A also significantly decreased injuries of Langerhans’ islets compared to the diabetic control. Mixture A showed a beneficial syner- gistic effect due to the supplementary pharmacological actions of the ingredients in contains, indicat- ing that it improved hyperglycemia without the side effect of weight gain.
Key words : db/db mice, hyperglycemia, synergistic effect
*Corresponding author
*Tel:+82-51-810-9042, Fax:+82-51-819-6930
*E-mail : cne007@redcross.or.kr
Introduction
Type 2 daibetes mellitus (DM) is characterized by obesity and insulin resistance [31]. Regulation of DM involves ex- ercise, diet, and pharmacotherapy. However, drugs devel- oped for the treatment of diabetes may fail to prevent long-term complications of diabetes and have side effects that may decrease patient tolerance [14,17]. New therapeutic modalities which provide better management of diabetes, and better tolerance by patients would be an important improvement. Currently, more than 400 plants are reported to have the potential to lower blood glucose levels [3,9].
These medicinal plants are known to be effective in treating diabetes and are expected to achieve a high level of anti- hyperglycemic effect without adverse reactions, unlike con- ventional antidiabetic drugs. Antidiabetic activities are caused by various polyphenol, flavonoids, glycosides and terpenoids in the plants, effectively contributing to the im- provement of diabetic patients [6,40]. The plant extracts ac- complish antidiabetic actions by way of pharmacological mechanisms including insulin-like activity [2,5,10], as well as increases in insulin sensitivity [15,22,26,28], insulin secre- tion [19,24,34,38,39], antioxidant activity [7,8,21,29], and re- strain the activity of intestinal glycosidase [18-21,28]. The
hypoglycemic effect of Lagerstroemia speciosa L. leaves was reported initially in early 1940 [11], and its antidiabetic ef- fect has since been confirmed [16,34]. Effective anti- hyperglycemic activity has also been reported for Psidium guajava L leaves [1,4,25]. Furthermore, effective antidiabetic activity of Morus indica L. leaves, Pinus densiflora needle, and Acanthopanax senticosus M. roots, which grow wild in Korea, was confirmed [10,18,20,22,30,38]. The objective of this study was to compare the antidiabetic effects of in- dividual L. speciosa and P. guajava leaf extracts on db/db mice, with effects due to the combined antidiabetic mecha- nisms provided by mixture A (L. speciosa, P. guajava, M.
indica leaf extract, P. densiflora needles extract, A. senticosus roots extract). It was thought that synergism might make the mixtures superior to extracts from single plant sources.
Materials and Methods Preparation of the plant extracts
Psidium guajava L. leaves (Pg), Morus indica L. leaves (Mi), Pinus densiflora needles (Pd), and Acanthopanax senticosus M.
roots (As) were purchased from the Daegu Yangyeongsi herbmarket (Daegu, Korea). 15 kg of well dried herb, were added to 150 L of distilled water for each of the four (Pg, Mi, Pd, and As). Each herb was boiled for 6 hours at 98℃
to get extracts. Each of the water soluble plant extracts was
filtered (50 μm), concentrated under vacuum, then freeze-
dried to form a powder (Pg 0.9%, Mi 1%, Pd 0.8, As 1%
in yield). Lagerstroemia speciosa L. leaf (Ls) extract, which contained 1% corosolic acid powder extracted using ethanol, was purchased from the Use Techno Corporation Co., Ltd (Kyoto, Japan). Mixture A contained the same amounts of freeze-dried Pg, Ls, Mi, Pd, and As powders.
Animal groups and treatment
Six-week-old male C57BLKS/J-db/db mice (n=80) and C57BL/6CrSlc mice (n=20) were purchased from the Japan Shizuoka Laboratory Center (Shizuoka, Japan) and acclimat- ized to a controlled temperature of 20±2℃, humidity of 55±5%, and a 12h light and 12h dark cycle for 1 week before starting the experiments. They had free access to standard pellets (Shizuoka Laboratory Center Inc, Japan) and water.
The mice were randomly divided into five groups with 20 animals in each group. The NC group served as normal controls (C57BL/6CrSlc mice) and received vehicle (normal saline) only. The DC group served as diabetic controls (C57BLKS/J-db/db mice) and also received vehicle only.
The PG and LS groups received the single plant extracts;
Pg extract and Ls extract respectively. The MA group re- ceived mixture A. The vehicle or plant extract (100 mg/kg, w/w) was orally administered daily over the experimental period of 4 weeks.
Reagents and equipment
The levels of blood glucose, HDL-cholesterol (HDL-C), total cholesterol (TC), triglyceride (TG), and free fatty acid (FFA) were measured using an automatic analyzer (ADVIA 1650, Bayer, Deerfield, IL, USA). Blood insulin was meas- ured by using the Sensitive Rat RIA kit (Linco Research, USA) and automatic analyzer (Gamma counter COBRA-Ⅱ, Packard, Ramsey, MN, USA). The Periodic Acid-Schiff (PAS) stain for the liver was measured with an SS002 Kit (BioGenex, USA). The mouse anti-insulin and rabbit an- ti-glucagon antibody (BioGenex, USA) was used as a pri- mary antibody, and a Sensitive
TMpolymer-HRP detection kit (BioGenex, USA) as a secondary antibody for the im- munohistochemical stain of the pancreas. The entire histo- logical examination process was done using light micro- scopy (Axio Scope, Carl Zeiss, Göttingen, Germany).
Measurement of blood glucose, insulin, lipoprotein and lipids in serum
Five mice from each group were selected each week over
4 weeks, and blood from the heart was collected using a syringe by making an incision in the chest after using ethyl ether as anesthesia. The collected blood was centrifuged for 10 min at 4,000 rpm and 4℃, and the serum was stored at -70℃. After completion of the experiment, blood glucose, insulin, HDL-cholesterol (HDL-C), total cholesterol (TC), tri- glyceride (TG), and free fatty acid (FFA) levels were meas- ured using an automatic blood chemical analyzer, and the HDL-cholesterol/total cholesterol ratio (HTR) calculated.
Histological examination
After the 4
thweek of the experiment, the liver and pan- creas of each mouse were dissected and fixed in 10% neutral formalin for 1 day. Then, these were processed to produce 4 μm thick paraffin sections (m.p. 58℃). The PAS reaction was employed for liver, and the immunohistochemical avi- din-biotin complex (ABC) method was used for insulin or glucagon-detects in pancreas tissue. All the histological ex- amination results reported were the means of measures from 10 different fields on each slide. Histological damage was scored as follows, based on the ABC stain using insulin antibodies: 0 - normal; Ⅰ - minor injury; Ⅱ - moderate injury; Ⅲ - obvious injury; Ⅳ - severe injury. Each sample was observed at 400× magnification [37]. While the insulin or glucagon occupied proportion in Langerhans’ islet cells was magnified 200×, the picture of each slide was analyzed using the Cell Image Scanner program. The Cell Image Scanner program for determining the insulin or glucagon occupied proportion was developed by Professor Jong Hae Kim from the Division of Electronic Engineering, Sun Moon University. The proposed Cell Image Scanner program on the basis of HIS (Hue, Intensity, and Saturation) color coor- dinates has been developed by Visual Basic Net 2005 in order to allow detailed analyses of cell images. For the vari- ous analyses of cell images, the user can adjust the ranges of hue, intensity, and saturation.
Statistical analysis
All values were expressed as means±S.D. The results were compared using the Kruskal-Wallis test of SPSSWIN, ver. 12.0. The level of statistical significance in the study was either p<0.05 or p<0.01.
Results Effect of plant extracts on body weight
After 4 weeks, the body weight gain of the diabetic con-
Table 1. Effect of plant extracts on body weight gain in db/db mice (n=5)
Group Body Weight (mean±S.D.) (g)
Initial Final Gain
NC DC MA PG LS
23.3±0.7 33.4±1.8 32.1±0.6 34.3±0.7 33.5±2.1
26.9±0.6 49.9±3.4 38.6±2.7 41.8±2.3 43.8±2.8
3.6±0.5 16.5±2.5
**NC6.5±2.2
**NC, **DC7.5±2.1
**NC, **DC10.3±1.4
**NC, **DC Probability less than 0.01 indicated by '**'. Letter superscripts refer to comparison groups.NC: Normal control, DC: Diabetic control, MA: Diabetic mice fed with mixture A, PG: Diabetic mice fed with Pg, LS: Diabetic mice fed with Ls extract.
Table 2. Effect of plant extracts on blood glucose level in db/db mice (n=5)
Group Blood glucose (mean±S.D.) (mg/dl)
1 week 2 week 3 week 4 week
NC MADC PGLS
151.1±18.7 559.2±22.7*NC 551.6±19.0*NC 555.2±17.7*NC 564.0±16.3*NC
154.3±13.7 569.9±24.7*NC 561.1±20.0*NC 568.0±21.2*NC 562.4±20.9*NC
152.5±14.9 571.6±30.1*NC 548.2±15.9*NC 554.8±18.5*NC 568.2±19.1*NC
155.4±15.5 620.4±27.7**NC 513.8±18.9**NC, **DC 551.8±17.1**NC, **DC, *MA
580.8±19.2**NC, **DC, **MA
Probability less than 0.05 indicated by '*', and less than 0.01 indicated by '**'. Letter superscripts refer to comparison groups.
NC: Normal control, DC: Diabetic control, MA: Diabetic mice fed with Mixture A, PG: Diabetic mice fed with Pg, LS: Diabetic mice fed with Ls extract.
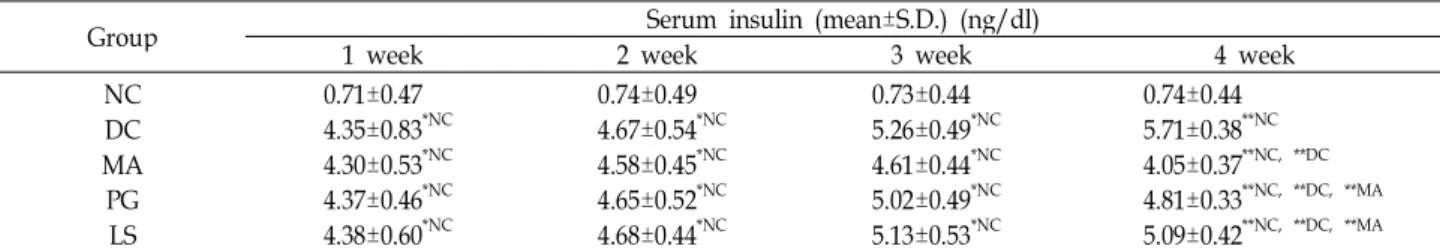
Table 3. Effect of plant extracts on serum insulin level in db/db mice (n=5)
Group Serum insulin (mean±S.D.) (ng/dl)
1 week 2 week 3 week 4 week
NC MADC PGLS
0.71±0.47 4.35±0.83*NC 4.30±0.53*NC 4.37±0.46*NC 4.38±0.60*NC
0.74±0.49 4.67±0.54*NC 4.58±0.45*NC 4.65±0.52*NC 4.68±0.44*NC
0.73±0.44 5.26±0.49*NC 4.61±0.44*NC 5.02±0.49*NC 5.13±0.53*NC
0.74±0.44 5.71±0.38**NC 4.05±0.37**NC, **DC 4.81±0.33**NC, **DC, **MA
5.09±0.42**NC, **DC, **MA
Probability less than 0.05 indicated by '*', and less than 0.01 indicated by '**'. Letter superscripts refer to comparison groups.
NC: Normal control, DC: Diabetic control, MA: Diabetic mice fed with Mixture A, PG: Diabetic mice fed with Pg, LS: Diabetic mice fed with Ls extract.
trol increased over 4 times compared to that of the normal control, and showed obesity which is characteristics of type 2 diabetes (Table 1). The body weight gain of the PG, LS, and MA groups decreased 54%, 37%, and 60% compared to that of the diabetic control (p<0.01) and, among these, the body weight gain of the LS group was significantly high compared to other groups (p<0.05).
Effect of plant extracts on blood glucose
The glucose level of the diabetic control increased as the experiment went on, and showed hyperglycemia of over 600 mg/dl in week 4 (Table 2). After 4 weeks, the glucose level of the PG and LS groups were decreased 11% and
6% respectively compared to that of the diabetic control (p<0.05). The glucose level of the MA group was decreased 17% respectively compared to that of the diabetic control (p<0.01). The glucose level of the MA group was lower com- pared to that of the other groups (p<0.05), the mixture A extract had the highest glucose-lowering effect.
Effect of plant extracts on serum insulin
The insulin level of the diabetic control increased over
6 times compared to that of the normal control since week
1 and showed hyperinsulinemia (Table 3). After 4 weeks,
the insulin level of the PG and LS groups were decreased
15% and 10% respectively compared to that of the diabetic
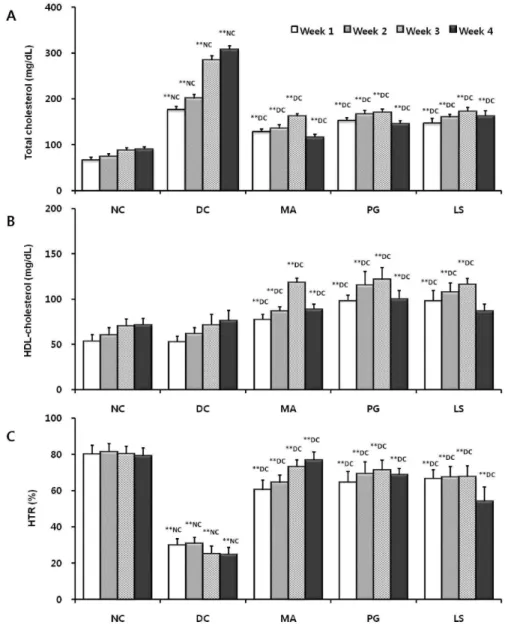
Fig. 1. Effect of plant extracts on serum total cholesterol (A), HDL-cholesterol (B) and HTR (C) level in db/db mice (n=5; mean±S.D.).
Probability less than 0.01 indicated by '**'. Letter superscripts refer to comparison groups. HTR: HDL-cholesterol/total cholesterol ratio, NC: Normal control, DC: Diabetic control, MA: Diabetic mice fed with Mixture A, PG: Diabetic mice fed with Pg, LS: Diabetic mice fed with Ls extract.
control (p<0.01). The insulin level of the MA group was decreased 29% respectively compared to that of the diabetic control (p<0.01). Especially, the antihyperinsulinemic effect of mixture A extract was the highest (p<0.01).
Effect of plant extracts on serum TC, HDL-C and HTR
The level of serum total cholesterol (TC), HDL-cholesterol (HDL-C), and HDL-cholesterol/total cholesterol ratio (HTR) in each group is shown in Fig. 1. In Fig. 1A, the TC level of the diabetic control constantly increased until week 4 and showed hypercholesterolemia by over 3 times com-
pared to that of the normal control (p<0.01). After 4 weeks, the TC level of the PG and LS groups decreased 52% and 47% respectively compared to that of the diabetic control (p<0.01). The TC level of the MA group decreased 62% com- pared to that of the diabetic control (p<0.01). Also, the TC level of the MA group was lower compared to that of the other groups (p<0.01). The HDL-C levels of the normal and diabetic control increased during 4 weeks, but there was no significant difference between the two groups (Fig. 1B).
After 4 weeks, the HDL-C level of the PG and MA groups
were higher than that of the diabetic control (p<0.01), but
in LS group no significant difference was found compared
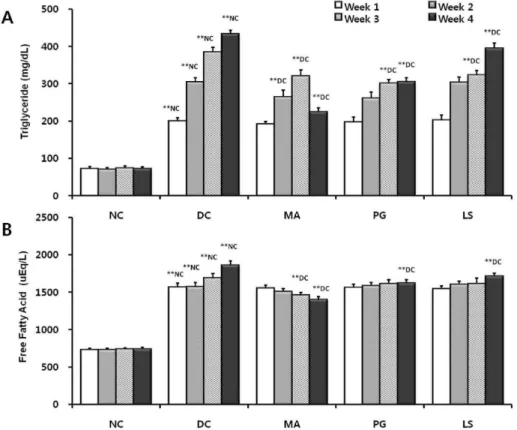
Fig. 2. Effect of plant extracts on serum triglyceride (A) and free fatty acid (B) level in db/db mice (n=5; mean±S.D.). Probability less than 0.05 indicated by '*', and less than 0.01 indicated by '**'. Letter superscripts refer to comparison groups. NC:
Normal control, DC: Diabetic control, MA: Diabetic mice fed with Mixture A, PG: Diabetic mice fed with Pg, LS: Diabetic mice fed with Ls extract.
to diabetic control. After 4 weeks, the HTR of the diabetic control decreased to 31% of the normal control (p<0.01), showing no complementary increase of HDL-C corre- spondent with the increased TC level (Fig. 1C). The HTR of the PG, LS, and MA groups were higher than that of the diabetic control (p<0.01), and in particular, the HTR of the MA showed no significant difference compared to that of the normal control.
Effect of plant extracts on serum TG and FFA
The levels of serum triglyceride (TG) and free fatty acid (FFA) in each group is shown in Fig. 2. In Fig. 2A, the TG level of the diabetic control constantly increased until week 4 and showed an abnormal lipid profile of 6 times higher than that of the normal control (p<0.01). After 4 weeks, the TG level of the PG and LS groups decreased 30% and 8% respectively compared to that of the diabetic control (p<0.01), and the TG level of the PG group was lower than that of LS group (p<0.01). Also, the TG level of the MA group decreased 48% respectively compared to that of the diabetic control (p<0.01), and mixture A extract
showing to have the highest effectiveness compared to other extracts (p<0.01). In Fig. 2B, The FFA level of the diabetic control increased until week 4 and showed an abnormal lipid profile of over 2 times higher than that of normal control (p<0.01). After 4 weeks, the FFA level of the PG and LS groups decreased 12% and 7% respectively com- pared to that of the diabetic control (p<0.01), and the FFA level of the PG group was lower than that of the LS group (p<0.01). The FFA level of the MA group decreased 24%
respectively compared to that of the diabetic control (p<0.01). Also, the FFA level of the MA group was the low- est compared to other groups (p<0.01).
Effect of plant extracts on lipid deposits in liver
Changes to lipid accumulation are displayed in Fig. 3.
Based on PAS-stained tissue secretions, the oval portions
not stained show lipid deposits. After 4 weeks, the normal
control showed few lipid deposits in the liver (Fig. 3A) but
the diabetic control showed an abnormally large amount
of lipid deposits in the liver (Fig. 3B). The MA group
showed a reduced lipid deposits compared to that of the
Fig. 3. Effect of plant extracts on lipid deposits of db/db mice liver in 4 week (PAS stain, 200×). A: Normal control, B: Diabetic control, C: Diabetic mice fed with Mixture A, D: Diabetic mice fed with Pg, E: Diabetic mice fed with Ls extract, scale bars represent 100 μm.
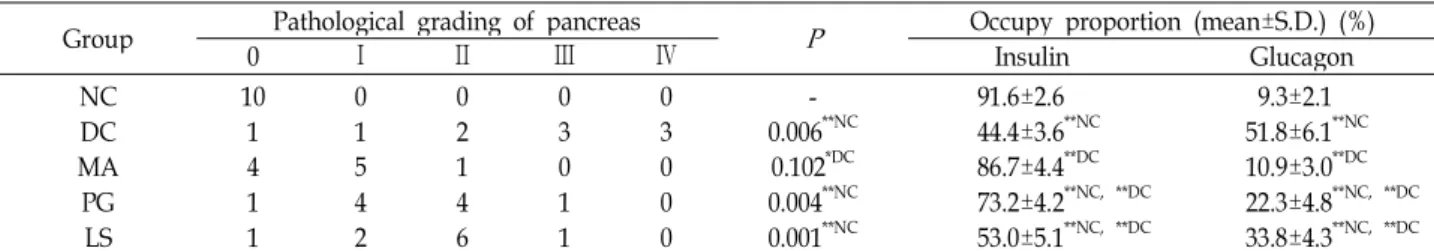
Table 4. Effect of plant extracts on the histopathological damage of Langerhans’ islet in db/db mice (
n
=10)Group Pathological grading of pancreas
P
Occupy proportion (mean±S.D.) (%)0 Ⅰ Ⅱ Ⅲ Ⅳ Insulin Glucagon
NC MADC PGLS
10 14 11
0 15 42
0 21 46
0 30 11
0 30 00
- 0.006**NC 0.102*DC 0.004**NC 0.001**NC
91.6±2.6 44.4±3.6**NC 86.7±4.4**DC 73.2±4.2**NC, **DC 53.0±5.1**NC, **DC
9.3±2.1 51.8±6.1**NC 10.9±3.0**DC 22.3±4.8**NC, **DC 33.8±4.3**NC, **DC Pathological grading of pancreas was scored using the light microscopy. (ABC stain using insulin antibody, 400×). Occupy pro- portion was calculated using the Cell Image Scanner program. (ABC stain, 200×)
Probability less than 0.05 indicated by '*', and less than 0.01 indicated by '**'. Letter superscripts refer to comparison groups.
NC: Normal control, DC: Diabetic control, MA: Diabetic mice fed with Mixture A, MB: Diabetic mice fed with Mixture B, PG:
Diabetic mice fed with Pg, LS: Diabetic mice fed with Ls extract.
diabetic control (Fig. 3C). The PG and LS groups also showed a reduced amount of stored lipids compared to that of the diabetic control (Fig. 3D and 3E), but still higher than that of MA group.
Effect of plant extracts on the histological micrograph in Langerhans’ islet
Histopathological changes of Langerhans’ islets are dis- played in Table 4, Fig. 4 and Fig. 5. In Table 4, the patho- logical grading score of the MA group was significantly higher compared to that of the diabetic control (p<0.05).
But the scores of the PG and LS groups were not sig- nificantly different compared to that of the diabetic control.
The insulin occupied proportion of the Langerhans’ islets of the diabetic control, decreased to 2 times less than that of the normal control (p<0.01) and the insulin occupied pro-
portion of the Langerhans’ islets of the PG, LS, and MA groups were significantly higher compared to that of the diabetic control (p<0.01). As for the MA group, the insulin occupied proportion of the Langerhans’ islets and patho- logical grading of pancreas tissue did not show any sig- nificant difference compared to that of the normal control.
In sum, mixture A was most effective in preventing beta cell failure among the plant extracts used for the present work. The glucagon occupied proportion of the Langerhans’
islets of the diabetic control, increased to 5.5 times much
than that of the normal control (p<0.01). The glucagon occu-
pied proportion of the Langerhans’ islets of the PG, LS,
and MA groups were lower than that of the diabetic control
(p<0.01). In particular, the glucagon occupied proportion of
the Langerhans’ islets of the MA group was lower than
those of the PG and LS groups (p<0.01). In Fig. 4, based
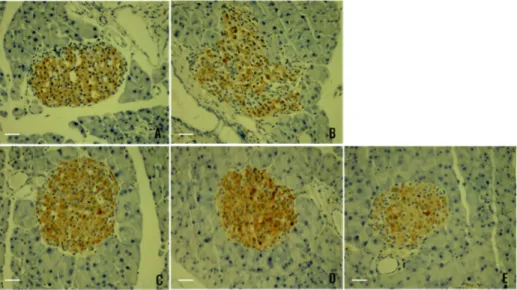
Fig. 4. Effect of plant extracts on the histological micrograph of db/db mice Langerhans' islets cell and insulin secretion in 4 week (ABC stain, 200×). A: Normal control, B: Diabetic control, C: Diabetic mice fed with Mixture A, D: Diabetic mice fed with Pg, E: Diabetic mice fed with Ls extract, scale bars represent 100 μm.
Fig. 5. Effect of plant extracts on the histological micrograph of db/db mice Langerhans' islets cell and glucagon secretion in 4 week (ABC stain, 200×). A: Normal control, B: Diabetic control, C: Diabetic mice fed with Mixture A, D: Diabetic mice fed with Pg, E: Diabetic mice fed with Ls extract, scale bars represent 100 μm.
on ABC-stained tissue secretions using insulin antibodies, the portions stained yellowish brown color show insulin secretion. After 4 weeks, the normal control showed a nor- mal shape of Langerhans’ islets cell and insulin secretion (Fig. 4A) but the diabetic control have injured Langerhans’
islets cell and few insulin secretion (Fig. 4B). The MA, PG, and LS groups showed recovery of Langerhans’ islets cell and insulin secretion (Fig. 4C, 4D and 4E). In Fig. 5, based on ABC-stained tissue secretions using glucagon antibodies, the portions stained yellowish brown color show glucagon
secretion. After 4 weeks, tissues of the normal control showed a normal shape of Langerhans’ islets cell and gluca- gon secretion (Fig. 5A), but the diabetic control showed an injured Langerhans’ islets cells. The majority of beta cells were damaged as glucagon secretion is present over the entire tissue (Fig. 5B). The MA and PG groups showed that the damage to the beta cells of Langerhans’ islets was pro- longed compared to the diabetic control (Fig. 5C and 5D).
Damage to the beta cells of Langerhans’ islets of the LS
group was prolonged compared to the diabetic control, but
the damage level was higher than that of the PG and MA groups (Fig. 5E).
Discussion
Insulin resistance is one of the major features of type 2 DM. Insulin resistance impairs glucose utilization by in- sulin-sensitive tissues and increases hepatic glucose output.
Both effects contribute to hyperglycemia [31]. Thus, both hyperinsulinemia and hyperglycemia must be improved at the same time to effectively treat type 2 DM. In our previous study, it was confirmed that mixture A showed antidiabetic effect on type 1 DM [32]. The study, using in vitro pancreas beta cells and in vivo streptozotocin-diabetes rats, proved that mixture A ensured a more beneficial antidiabetic effect compared to the effect of either the Psidium guajava L. leaf (Pg) or the Lagerstroemia speciosa L. leaf (Ls) extract used alone. So, this study verified the antidiabetic effect of mix- ture A on type 2 DM. According to the result of this study, Pg and Ls extracts showed antihyperinsulinemic and anti- hyperglycemic activities, and there was no significant effect between the two. However, this result is insufficient to con- clude that the antihyperinsulinemic and antihyperglycemic effect between these extracts is same as the level of glucose of Ls extract increased gradually since Week 3 compared to that of Pg extract. The Pg extract contains various poly- phenolic compounds such as polyphenol [29], terpenoids [4], flavonoids [23], and tannins [36]. These polyphenolic compounds showed various antidiabetic activities and Pg extract actually increased insulin secretion [24,34], insulin sensitivity by inhibiting the protein tyrosine phosphatase 1B (PTP1B) [15,28], and blocked the uptake of intestinal glu- cose by inhibiting the activity of the carbohydrate hydro- lyzing enzyme [28]. The Ls extract used in this study was an ethanol extract including 1% corosolic acid, and poly- phenolic compounds were removed during the extraction process and Ls extract contained less polyphenolic com- pounds than the Pg extract. Miura and co-workers [26]
claimed that corosolic acid increases glucose transporter 4 (GLUT4) translocation and reduces insulin resistance. But after a study using water-soluble Ls extract, Hayashi and co-workers [13] claimed that lagerstroemin, which is a poly- phenol, but not the corosolic acid, is responsible for the antidiabetic effect of Ls extract. Thus, the antidiabetic effect of corosolic acid is still in question. In sum, the glucose level of Ls extract has increased gradually since Week 3
compared to that of Pg extract for that the majority of hy- drophilic polyphenol compounds contained in Lagerstroemia speciosa L. leaves were not extracted during the extraction process with ethanol, and that the antidiabetic activity of the extracted corosolic acid is lower than what has been wildely known so far. Mixture A showed a higher level of antihyperinsulinemic and glucose-lowering activity com- pared to that of the Pg and Ls extracts. Mixture A is com- posed of a mixture of Pg, Ls, Morus indica L. leaf (Mi), Pinus densiflora needles (Pd), and Acanthopanax senticosus M. roots (As) extracts, and the Mi extract’s main components, fag- omine and 1-deoxynojirimycin, stimulated insulin release [38] and blocked intestinal glucose uptake by inhibiting the carbohydrate hydrolysing enzyme in the small intestine [20]. Liu and workers [22] proved As extracts' in- sulin-sensitivity increase effects. Also, the Pd extract has in- hibition activity on the carbohydrate hydrolysing enzyme [18], and insulin-like activity [10]. Then, mixture A extract can accomplish antidiabetic effects through antidiabetic pharmacological mechanisms such as: insulin-secretion in- crease activity by Pg, Ls, Mi, Pd, and As extracts; intestinal glucose-uptake blocking activity by Pg, Mi, and Pd extracts;
increase activity of glucose transportation to cells by the Pg, Ls, Pd, and As extracts.
Type 2 DM is characterized by obesity and abnormal fat
metabolism. The increased adipocyte mass leads to in-
creased levels of circulating free fatty acids and other fat
cell products. The increased production of free fatty acids
and some adipokines may cause insulin resistance in skel-
etal muscle and liver. This is also responsible for the dyslipi-
demia found in type 2 DM [31]. The activities of nutritional
antioxidants can reduce cholesterol absorption, cholesterolo-
genesis, and fatty acid synthesis [12,33]. In this study, Pg
and Ls extracts improved dyslipidemia, and Pg extract
showed a higher effect due to its anioxidant activity. Apart
from the activity increasing insulin sensitivity, Pg extract
also acts as an antioxidant activity [7]. Thus, the Pg extract
was more effective in improving dyslipidemia compared to
the Ls extract, which only increases insulin sensitivity by
the remaining polyphenoic compound. Mixture A improved
hyperlipidemia, and showed more effectiveness than Pg and
Ls extracts. This is because mixture A extract’s antioxidant
activity, antihyperinsulinemic and glucose lowering effect
was higher than that of other extracts. The number of beta
cell decrease in individuals with long-standing type 2 dia-
betes [31]. In the present study, beta cell failure was caused
by type 2 DM due to the decreased insulin occupied pro- portion of Langerhans’ islets of the diabetic control and in- creased glucagon occupied proportion compared to that of the normal control. The Pg extract's insulin occupied pro- portion was significantly higher than that of the Ls extract, indicating the damage on the beta cells of Langerhans’ islets was delayed. The pathological grading of pancreas tissue, as well as the insulin and glucagon occupied proportion of mixture A was similar to that of the normal control. This suggests that mixture A contributed to the improvement of antihyperinsulinemia and antihyperglycemia, and to pre- vention of the functional damage of beta cells usually caused by type 2 DM. For mixture A, this appears to be the result of the extracts’ effectiveness in increasing insulin sensitivity, lowering glucose level, and its insulin-like and antioxidant activity. The obesity accompanying type 2 DM is thought to be part of the pathogenic process. As a result of insulin resistance in adipose tissue and resulting obesity, free fatty acid flux from adipocytes is increased, leading to increased lipid synthesis in hepatocytes. This lipid stor- age or seatosis in the liver may lead to nonalcoholic fatty liver disease and abnormal liver function [31]. Compared to the diabetic control, the Pg, Ls, and MA extracts con- tributed to improvement by decreasing glycogen storage and lipid accumulation in the liver as well as reducing obesity. Among treatments, the improvements due to mix- ture A were the greatest. It is well known that the majority of the current antidiabetic drugs have side effects such as gaining weight [27,41]. These drugs enhance hyperglycemia in a short time of period, and this can accelerate obesity, one of the main causes for type 2 DM. It is highly important to treat type 2 DM by ensuring the antihyperglycemic effect without side effects including weight gains. In this study, mixture A was effective not only in treating hyperglycemia, hypoinsulinemia and hyperlipidemia, but also in recovering from abnormal lipid accumulation in the liver. Furthermore, mixture A proved to be effective in restraining gaining weight gains while ensuring the antihyperglycemic effect.
In conclusion, it was proved that mixture A, which is the combination of functions such as intestinal glucose up- take blocking activity, increase activity of glucose trans- portation to cells, and antioxidant activity of each plant ex- tracts, ensures a higher antidiabetic synergy effect compared to that of the other extracts. However, the components of each plant extracts proved of antidiabetic synergy effects through this study should be chemically analyzed and their
chemical structure should be understood in order to provide a basis for future development of diabetes therapeutic agents.
References
1. Andallu, B. and N. C. Varadacharyulu. 2003. Antioxidant role of mulberry (
Morus indica
L. cv. Anantha) leaves in streptozotocin-diabeticrats.Clin. Chim. Acta
338, 3-10.2. Anderson, R. A. and M. M. Polansky. 2002. Tea enhances insulin activity.
J. Agric. Food Chem.
50, 7182-7186.3. Bailey, C. J. and C. Day. 1989. Traditional plant medicines as treatments for diabetes.
Diabetes Care
12, 553-564.4. Begum, S., S. I. Hassan, B. S. Siddiqui, F. Shaheen, M. N.
Ghayur, and A. H. Gilani. 2002. Triterpenoids from the leaves of
Psidium guajava
.Phytochemistry
61, 399-403.5. Broadhurst, C. L., M. M. Polansky, and R. A. Anderson.
2000. Insulin-like biological activity of culinary and medical plant aqueous extracts
in vitro
.J. Agric. Food Chem.
48, 849-852.6. Cetto, A. A. and H. Wiedenfiend. 2001. Hypoglycemic effect of
Cecropia obtusifolia
on STZ diabetic rats.J. Ethnopharmacol.
78, 145-149.
7. Chen, H. Y. and G. C. Yen. 2007. Antioxidant activity and free radical-scavenging capacity of extracts from guava (
Psidium guajava
L.) leaves.Food Chem.
101, 686-694.8. Devaraj, S., N. Kaul, F. Schönlau, P. Rohdewald, and I.
Jialal. 2002. Pycnogenol® supplementation increases anti- oxidant capacity and has a favourable effect on the lipid profile in humans.
Lipids
37, 931-934.9. Ernst, E. 1997. Plants with hypoglycemic activity in human.
Phytomedicine
4, 73-78.10. Fonteles, M. C., L. C. Huang, and J. Larner. 1996. Infusion of pH 2.0 D-chiro-inositol glycan insulin putative mediator normalizes plasma glucose in streptozotocin diabetic rats at a dose equivalent to insulin without inducing hypoglycemia.
Diabetologia
39, 731-734.11. Garcia, F. 1940. On the hypoglycemic effect of decoction of
Lagerstroemia speciosa
leaves (banaba) administered orally.J. Phil. Med. Assoc.
20, 395-402.12. Gorinstein, S., G. W. Kulasek, E. Bartnikowska, M.
Leontowicz, M. Zemser, M. Morawiec, and S. Trakhtenberg.
1998. The influence of persimmon peel and persimmon pulp on the lipid metabolism and antioxidant activity of rats fed cholesterol.
J. Nutr. Biochem.
9, 223-227.13. Hayashi, T., H. Maruyama, R. Kasai, K. Hattori, S.
Takasuga, O. Hazeki, K. Yamasaki, and T. Tanaka. 2002.
Ellagitannins from
Lagerstroemia speciosa
as Activators of Glucose Transport in Fat Cells.Planta Med.
68, 173-175.14. Holman, R. R. and R. C. Turner. 1991. Oral agents and insulin in the treatment of NIDDM. In Pickup, J. and G.
Williams. (eds.), pp. 467-469, Text Book of Diabetes.
Blackwell, Oxford.
15. Hong, J. H., M. S. Lee, E. Y. Bae, Y. H. Kim, H. Oh, W.
K. Oh, B. Y. Kim, and J. S. Ahn. 2004. Screening for the
inhibitory activity of medicinal plants against protein ty- rosine phosphatase 1B.
Korean J. Pharmacogn.
35, 16-21.16. Kakuda, T., I. Sakane, T. Takihara, Y. Ozaki, H. Takeuchi, and M. Kuroyanagi. 1996. Hypoglycemic effect of extracts from Lagerstroemia speciosa L. leaves in genetically dia- betic KK-AY mice.
Biosci. Biotechnol. Biochem.
60, 204-208.17. Kameswara, R. B., R. Giri, M. M. Kesavulu, and C. Apparao.
1997. Herbal medicine: in the management of diabetes mellitus. pp. 33-35, Manphar Vaidhya Patrika.
18. Kim, Y. H., Y. K. Jeong, M. H. Wang, W. Y. Lee, and H.
I. Rhee. 2005. Inhibitory effect of pine extract on alpha-glu- cosidase activity and postprandial hyperglycemia.
Nutrition
21, 756-761.19. Kim, S. H., S. H. Hyun, and S. Y. Choung. 2006. Anti-dia- betic effect of cinnamon extract on blood glucose in db/db mice.
J. Ethnopharmacol.
104, 119-123.20. Kimura, T., K. Nakagawa, H. Kubota, Y. Kojima, Y. Goto, K. Yamagishi, S. Oita, S. Oikawa, and T. Miyazawa. 2007.
Food-grade mulberry power enriched with 1-deoxynojir- imycin suppresses the elevation of postprandial blood glu- cose in human.
J. Agric. Food Chem.
55, 5869-5874.21. Lee, Y. A., E. J. Cho, T. Tanaka, and T. Yokozawa. 2007.
Inhibitory activities of proanthocyanidins from persimmon against oxidative stress and digestive enzymes related to diabetes.
J. Nutr. Sci. Vitaminol.
53, 287-292.22. Liu, T. P., C. S. Lee, S. S. Liou, I. M. Liu, and J. T. Cheng.
2005. Improvement of insulin resistance by
Acanthopanax senticosus
root in fructose-rich chow-fed rats.Clin. Exp.
Pharmacol. Physiol.
32, 649-654.23. Lozoya, X., M. Meckes, M. Abou-Zaid, J. Tortoriello, C.
Nozzolillo, and J. T. Arnason. 1994. Quercetin glycosides in
Psidium guajava
L. leaves and determination of a spasmo- lytic principle.Arch. Med. Res.
25, 11-15.24. Mai, T. T. and N. V. Chuyen. 2007. Anti-hyperglycemic activity of an aqueous extract from flower buds of
Cleistocalyx operculatus
(Roxb
.) Merr and Perry.Biosci.
Biotechnol. Biochem.
71, 69-76.25. Meckes, M., F. Calzada, J. Tortoriello, J. L. González, and M. Martinez. 1996. Terpenoids isolated from
Psidium guaja- va
hexane extract with depressant activity on central nerv- ous system.Phytother. Res.
10, 600-603.26. Miura, T., N. Ueda, K. Yamada, M. Fukushima, T. Ishida, T. Kaneko, F. Matsuyama, and Y. Seino. 2006. Antidiabetic effects of corosolic acid in KK-Ay diabetic mice.
Bio. Pharm.
Bull.
29, 585-587.27. Moller, D. E. 2001. New drug targets for type 2 diabetes and the metabolic syndrome.
Nature
414, 821-827.28. Oh, W. K., C. H. Lee, M. S. Lee, E. Y. Bae, C. B. Sohn, H. Oh, B. Y. Kim, and J. S. Ahn. 2005. Antidiabetic effects of extracts from
Psidium guajava
.J. Ethnopharmacol.
96, 411-415.29. Okuda, T., T. Yoshida, T. Hatano, K. Yazaki, Y. Ikegami,
and T. Shingu. 1987. Guavins A, C and D, complex tannins from Psidium Guajava.
Chem. Pharm. Bull.
35, 443-446.29. Onogi, A., K. Osawa, H. Yasuda, A. Sakai, H. Morita, and H. Itokawa. 1993. Flavonol glycosides from the leaves of
Morus alba
L.Nat. Med.
47, 423-425.30. Park, S. Y., S. Y. Chang, C. S. Yook, and T. Nohara. 2000.
New 3,4-seco-lupane-type triterpene glycosides from
Acanthopanax senticosus forma inermis
.J. Nat. Prod.
63, 1630-1633.31. Powers, A. C. 2008. Diabetes mellitus. In Fauci, A. S., E.
Braunwald, D. L. Kasper, S. L. Hauser, D. L. Longo,, J.
L. Jameson, J. Loscalzo (eds.), pp. 2275-2304, Harrison’s Principles of Internal Medicine. 17th eds. McGraw-Hill Companies, New York.
32. Roh, S. G., J. H. Kim, and W. C. Choi. 2009. Antidiabetic synergetic effects of plant extract-mixtures in streptozoto- cin-diabetes rats.
J. Life Sci.
19, 334-342.33. Sachdewa, A. and L. D. Khemani. 2003. Effect of
Hibiscus rosa sinensis
Linn. ethanol flower extract on blood glucose and lipid profile in streptozotocin induced diabetes in rats.J. Ethnopharmacol.
89, 61-66.34. Sunagawa, M., S. Shimada, Z. Zhang, A. Oonishi, M.
Nakamura, and T. Kosugi. 2004. Plasma insulin concen- tration was increased by long-term ingestion of guava juice in spontaneous non-insulin-dependent diabetes mellitus (NIDDM) rats.
J. Health Sci.
50, 674-678.35. Suzuki, Y., T. Unno, M. Ushitani, K. Hayashi, and T.
Kakuda. 1999. Antiobesity activity of extracts from Lagerstroemia speciosa L. leaves on female KK-Ay mice.
J. Nutr. Sci. Vitaminol.
45, 791-795.36. Tanaka, T., N. Ishida, M. Ishimatsu, G. Nonaka, and I.
Nishioka. 1992. Tannins and related compounds. CXVI. Six new complex tannins, guajavins, psidinins and psiguavin from the bark of
Psidium guajava
L.Chem. Pharm. Bull.
40, 2092-2098.37. Tang, L. Q., W. Wei, L. M. Chen, and S. Liu. 2006. Effects of berberine on diabetes induced by alloxan and a high-fat/high-cholesterol diet in rats.
J. Ethnopharmacol.
108, 109-115.38. Taniguchi, S., N. Asano, F. Tomino, and I. Miwa. 1998.
Potentiation of glucose-induced insulin secretion by fag- omine, a pseudo-sugar isolated from mulberry leaves.
Horm. Metab. Res.
30, 679-683.39. Verspohl, E. J., K. Bauer, and E. Neddermann. 2005.
Antidiabetic effect of
Cinnamomum cassia
andCinnamomum zeylanicum
in vivo and in vitro.Phytother. Res.
19, 203-206.40. Vertichevan, T. and M. Jegadeesan. 2002. Anti-diabetic activ- ity of alcholic extracts of
Aerva lanata
(L.) Juss, ex Schultes in rats.J. Ethnopharmacol.
80, 103-107.41. Zhang, B. and D. E. Moller. 2000. New approaches in the treatment of type 2 diabetes.