INTRODUCTION
The diagnosis and management of pulmonary nodules can vary widely based on their probability of malignancy and characteristics (1). For indeterminate pulmonary nodules, typically with low-to-intermediate probability of malignancy, image-guided biopsy, excisional biopsy, or
Learning Curve of C-Arm Cone-beam Computed
Tomography Virtual Navigation-Guided Percutaneous Transthoracic Needle Biopsy
Su Yeon Ahn, MD
1, 2, Chang Min Park, MD, PhD
1, 3, Soon Ho Yoon, MD
1, 3, Hyungjin Kim, MD
1, Jin Mo Goo, MD, PhD
1, 31Department of Radiology, Seoul National University College of Medicine, Institute of Radiation Medicine, Seoul, Korea; 2Department of Radiology, Konkuk University Medical Center, Konkuk University School of Medicine, Seoul, Korea; 3Cancer Research Institute, Seoul National University, Seoul, Korea
Objective: To evaluate the learning curve for C-arm cone-beam computed tomography (CBCT) virtual navigation-guided percutaneous transthoracic needle biopsy (PTNB) and to determine the amount of experience needed to develop appropriate skills for this procedure using cumulative summation (CUSUM).
Materials and Methods: We retrospectively reviewed 2042 CBCT virtual navigation-guided PTNBs performed by 7 novice operators between March 2011 and December 2014. Learning curves for CBCT virtual navigation-guided PTNB with respect to its diagnostic performance and the occurrence of biopsy-related pneumothorax were analyzed using standard and risk-adjusted CUSUM (RA-CUSUM). Acceptable failure rates were determined as 0.06 for diagnostic failure and 0.25 for PTNB-related pneumothorax.
Results: Standard CUSUM indicated that 6 of the 7 operators achieved an acceptable diagnostic failure rate after a median of 105 PTNB procedures (95% confidence interval [CI], 14–240), and 6 of the operators achieved acceptable pneumothorax occurrence rate after a median of 79 PTNB procedures (95% CI, 27–155). RA-CUSUM showed that 93 (95% CI, 39–142) and 80 (95% CI, 38–127) PTNB procedures were required to achieve acceptable diagnostic performance and pneumothorax occurrence, respectively.
Conclusion: The novice operators’ skills in performing CBCT virtual navigation-guided PTNBs improved with increasing experience over a wide range of learning periods.
Keywords: Learning curve; Lung; Percutaneous needle biopsy; Cone-beam CT
Received August 14, 2018; accepted after revision January 11, 2019.
This study was supported by the Industrial Technology Innovation Program funded by the Ministry of Trade, Industry & Energy (MOTIE), Republic of Korea (grant number: 10080531) and the Korea Health Technology R&D Project through the Korea Health Industry Development Institute (KHIDI), funded by the Ministry of Health and Welfare, Republic of Korea (grant number: HC15C3390).
Corresponding author: Chang Min Park, MD, PhD, Department of Radiology, Seoul National University College of Medicine, Institute of Radiation Medicine, Cancer Research Institute, Seoul National University, 101 Daehak-ro, Jongno-gu, Seoul 03080, Korea.
•Tel: (822) 2072-0367 • Fax: (822) 743-7418 • E-mail: [email protected]
This is an Open Access article distributed under the terms of the Creative Commons Attribution Non-Commercial License (https://
creativecommons.org/licenses/by-nc/4.0) which permits unrestricted non-commercial use, distribution, and reproduction in any medium, provided the original work is properly cited.
computed tomography (CT) surveillance is recommended (2). Percutaneous transthoracic needle biopsies (PTNBs) are often the first option for patients with peripheral pulmonary nodules (3).
Image-guided PTNB is an established diagnostic
procedure with extensive evidence of its efficacy and safety when performed by qualified physicians in an appropriate Korean J Radiol 2019;20(5):844-853
https://doi.org/10.3348/kjr.2018.0555
environment (4). Cone-beam CT (CBCT)-guided PTNB with a virtual navigation system has shown high diagnostic performance with accurate and safe needle displacement, even for small pulmonary nodules (5-7). However, to achieve acceptable performance, including a high diagnostic success rate and low complication rate, each operator must have sufficient training and experience to develop competent procedural skills (4). Unfortunately, thus far, no guidelines have been published on how to assess trainees’ performance in PTNB procedures and how much experience trainees should obtain to gain competence and be considered highly experienced operators.
The cumulative summation (CUSUM) method, a tool for evaluating the learning curve of a specific procedure (8), has been widely adopted as a critical tool in the quality control processes of the manufacturing and energy industries. The basic concept of a learning curve is that performance improves with time and experience, resulting in increased productivity (9). Recently, CUSUM has also garnered much attention in the medical field for the assessment of learning curves and as a quality control method (10), particularly in the fields of surgery and anesthesia (11-13). It has been applied to lung nodule biopsy, and specifically for bronchoscopy-guided aspiration or biopsy (14-17); however, thus far, no studies have assessed the learning curve of PTNBs. Therefore, the purpose of this study was to evaluate the learning curve for CBCT virtual navigation-guided PTNBs using the CUSUM method and to determine the amount of experience needed to develop the appropriate skills for this procedure.
MATERIALS AND METHODS
This retrospective study was approved by the Institutional Review Board of Seoul National University Hospital and the requirement for informed patient consent was waived.
Patients
From March 2011 to December 2014, 2158 consecutive CBCT virtual navigation-guided PTNBs were performed by 7 board-certified radiologists who had started their fellowship training without any prior experience in CBCT virtual navigation-guided PTNBs. All operators attended a lecture on PTNB procedures and observed and practiced the procedure under the supervision of an experienced radiologist. The patients’ medical records, CT findings prior to PTNBs, procedural records, post-PTNB follow-up studies,
and diagnosis of biopsied lesions were retrospectively reviewed by one author.
Outcome Measures
In this study, the learning period until acceptable diagnostic performance and pneumothorax occurrence were achieved was investigated because these are thought to be the main quality indicators of the accuracy and safety of PTNB procedures. The final diagnosis of each biopsied lesion was determined based on biopsy specimens, surgical specimens, or follow-up images (6, 18): 1) If the patient underwent surgical resection, the pathologic report of the surgical specimen was used to confirm the final diagnosis.
2) If the pathologic report of the biopsy specimen revealed a definitive malignant or specific benign pathology, such as tuberculosis or hamartoma, they were accepted as the final diagnosis. 3) In the case of nonspecific benign pathologies, lesions were determined to be benign only if they decreased by 20% or more in diameter over the follow-up period or remained stable in size for more than 2 years. 4) If lesions with nonspecific benign pathology did not show a sufficient interval decrease in size or were followed up for less than 2 years, they were considered to be indeterminate.
Pneumothorax was recorded based on post-procedural CBCT and follow-up chest radiographs after PTNBs.
Construction of the CUSUM Chart
The standard and risk-adjusted CUSUM (RA-CUSUM) methods for calculating the diagnostic performance and pneumothorax occurrence were as follows (19). With respect to the outcome, accurate diagnosis (true positives and true negatives) and the absence of pneumothorax were considered as cases of “success.” Technical failures and diagnostic errors (false positives and false negatives) and the occurrence of pneumothorax were considered as cases of “failure.”
The score (s) was recorded from p0, indicating an acceptable failure rate (the level of inherent error if the procedure is performed correctly), and p1, indicating an unacceptable failure rate. The CUSUM score was generated at the beginning as 0. After each case of success, an amount s is subtracted from the previous CUSUM score, and an amount 1-s is added to the previous CUSUM score for each case of failure. A successful outcome leads to downward movement of the CUSUM score, whereas a failed outcome leads to upward movement of the CUSUM score. When the CUSUM lines crossed a predetermined
lower decision limit (H0) from above, the failure rate was considered to be within the preset acceptable rate. When the CUSUM lines crossed the upper decision limit (H1) from below, the failure rate was considered to be unacceptable.
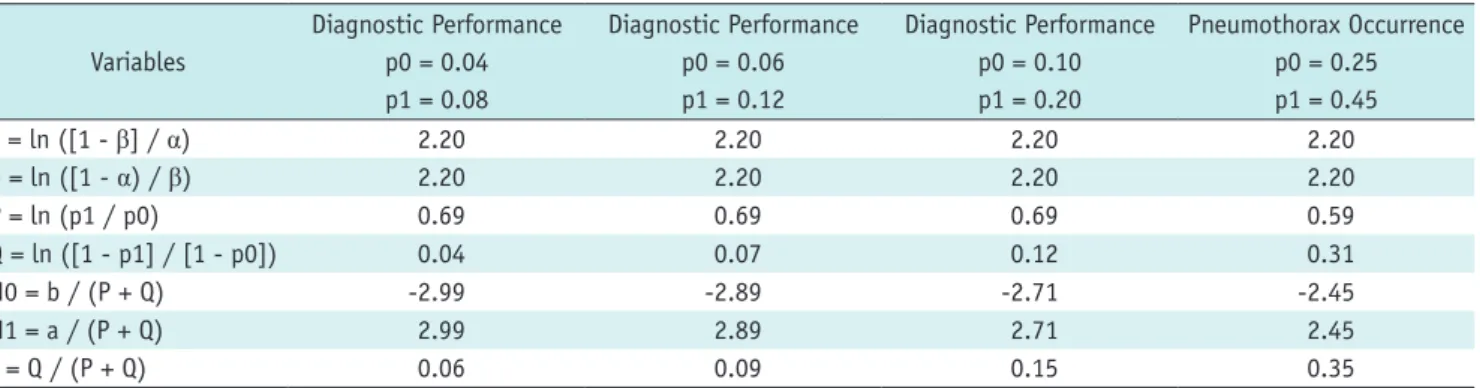
When the CUSUM lines remained between the upper and lower decision limits, whether the performance was acceptable or unacceptable was considered inconclusive and continued observations were required. These limits were calculated based on the risk for type I and type II errors. A type I error (α) is the probability of failing to cross the acceptable limit when the true failure rate is within the acceptable range, whereas a type II error (β) is the probability of downward crossing of the acceptable failure rate limit when the true failure rate is not in the acceptable range. In this study, type I and type II error levels of 0.10 were used for all analyses. The p0 and p1 in this analysis were determined to be 0.06 and 0.12, respectively, for diagnostic accuracy, and 0.25 and 0.45, respectively, for pneumothorax occurrence. We set the acceptable failure rate at 0.06 based on the calculated failure rate reported in a recent meta-analysis (20) and the unacceptable failure rate was set at 0.12 (double the acceptable failure rate) (19). From among the wide range of reported pneumothorax rates of between 0.10 and 0.29, an acceptable pneumothorax occurrence rate of 0.25 was set (20, 21), with an unacceptable pneumothorax occurrence rate of 0.45 according to the suggested quality improvement threshold (22). Other values adopted in this study are summarized in Table 1.
Because standard CUSUM does not take the weight of the CUSUM score into account depending on the degree of difficulty expected in the procedures, a RA-CUSUM was constructed. Rather than assuming that the acceptable failure rate is the same for all patients, the risk of
failure was predicted to vary because of the difficulty of the procedure depending on the characteristics of the patient and lesion (6, 20). In the RA-CUSUM, the score si was defined by the predicted risk of failure (pi) of each procedure, which was calculated using a logistic regression model based on baseline variables that have been reported as factors associated with diagnostic performance and pneumothorax occurrence (23). The predicted risk of diagnostic failure was calculated using a logistic regression model of 2 variables: lesion size (≤ 1 cm vs. > 1 cm) and lesion location (lower vs. upper/middle) according to a study by Lee et al. (6). The predicted risk of pneumothorax was calculated using a logistic regression model of the available variables in this study among the documented risk factors (20): age, sex, lesion size, lesion location, emphysema, and number of pleural passages. Thereafter, the value of si was defined as follows, where the odds ratio (OR) in this study was calculated using p0 and p1 for easy comparison with the standard CUSUM.
ln ([1 - Pi] + [OR x pi]) si = ____________________
ln (OR) Statistical Analysis
The CUSUM chart was constructed using Microsoft Excel 2013 (Microsoft Corporation, Redmond, WA, USA), and the difference between the proportions of patients’
clinical features and target lesions’ characteristics among the operators was evaluated using Pearson’s χ2 test. All statistical analyses were performed using the Statistical Package for the Social Sciences (SPSS version 23.0, IBM Corp., Armonk, NY, USA), with a p value of < 0.05 considered to indicate a statistically significant difference.
Table 1. Construction of Cumulative Summation Charts with Varying Acceptable and Unacceptable Failure Rates Variables
Diagnostic Performance p0 = 0.04 p1 = 0.08
Diagnostic Performance p0 = 0.06 p1 = 0.12
Diagnostic Performance p0 = 0.10 p1 = 0.20
Pneumothorax Occurrence p0 = 0.25 p1 = 0.45
a = ln ([1 - β] / α) 2.20 2.20 2.20 2.20
b = ln ([1 - α) / β) 2.20 2.20 2.20 2.20
P = ln (p1 / p0) 0.69 0.69 0.69 0.59
Q = ln ([1 - p1] / [1 - p0]) 0.04 0.07 0.12 0.31
H0 = b / (P + Q) -2.99 -2.89 -2.71 -2.45
H1 = a / (P + Q) 2.99 2.89 2.71 2.45
s = Q / (P + Q) 0.06 0.09 0.15 0.35
H0 = lower decision limit, H1 = upper decision limit, p0 = acceptable failure rate, p1 = unacceptable failure rate, s = score, α = type I error level, β = type II error level
RESULTS
Operators 1–7 performed 286, 319, 601, 93, 292, 116, and 335 procedures, respectively. The number of completed procedures depended on the duty months for this procedure.
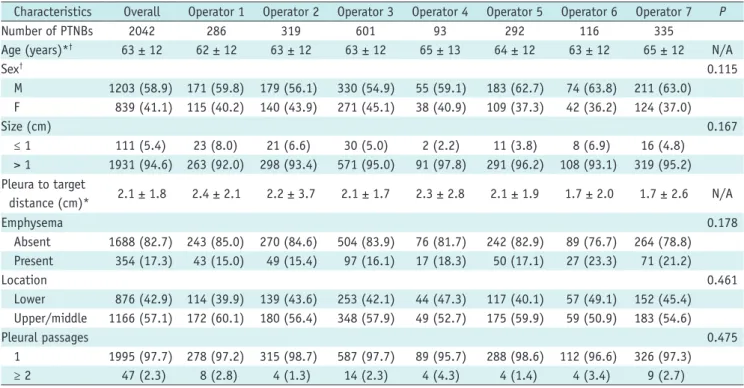
The characteristics of the patients and lesions for each operator are shown in Table 2. Their overall diagnostic success rates and pneumothorax occurrence rates are described in Table 3.
Diagnostic Performance
Of the 2158 PTNBs, 6 cases were excluded because of the lack of pathologic results (n = 3) or because the targets were non-pulmonary targets (n = 3). In addition, 110 cases were excluded because their final diagnoses were not determined. Therefore, the diagnostic accuracy of CBCT virtual navigation-guided PTNBs in this study was calculated based on 2042 PTNB procedures in 1948 patients (1147 males and 801 females; mean age, 63 ± 12 years).
The 2042 CBCT virtual navigation-guided PTNBs included Table 2. Clinical and Lesion Characteristics among Operators
Characteristics Overall Operator 1 Operator 2 Operator 3 Operator 4 Operator 5 Operator 6 Operator 7 P
Number of PTNBs 2042 286 319 601 93 292 116 335
Age (years)*† 63 ± 12 62 ± 12 63 ± 12 63 ± 12 65 ± 13 64 ± 12 63 ± 12 65 ± 12 N/A
Sex† 0.115
M 1203 (58.9) 171 (59.8) 179 (56.1) 330 (54.9) 55 (59.1) 183 (62.7) 74 (63.8) 211 (63.0) F 839 (41.1) 115 (40.2) 140 (43.9) 271 (45.1) 38 (40.9) 109 (37.3) 42 (36.2) 124 (37.0)
Size (cm) 0.167
≤ 1 111 (5.4) 23 (8.0) 21 (6.6) 30 (5.0) 2 (2.2) 11 (3.8) 8 (6.9) 16 (4.8)
> 1 1931 (94.6) 263 (92.0) 298 (93.4) 571 (95.0) 91 (97.8) 291 (96.2) 108 (93.1) 319 (95.2) Pleura to target
distance (cm)* 2.1 ± 1.8 2.4 ± 2.1 2.2 ± 3.7 2.1 ± 1.7 2.3 ± 2.8 2.1 ± 1.9 1.7 ± 2.0 1.7 ± 2.6 N/A
Emphysema 0.178
Absent 1688 (82.7) 243 (85.0) 270 (84.6) 504 (83.9) 76 (81.7) 242 (82.9) 89 (76.7) 264 (78.8) Present 354 (17.3) 43 (15.0) 49 (15.4) 97 (16.1) 17 (18.3) 50 (17.1) 27 (23.3) 71 (21.2)
Location 0.461
Lower 876 (42.9) 114 (39.9) 139 (43.6) 253 (42.1) 44 (47.3) 117 (40.1) 57 (49.1) 152 (45.4) Upper/middle 1166 (57.1) 172 (60.1) 180 (56.4) 348 (57.9) 49 (52.7) 175 (59.9) 59 (50.9) 183 (54.6)
Pleural passages 0.475
1 1995 (97.7) 278 (97.2) 315 (98.7) 587 (97.7) 89 (95.7) 288 (98.6) 112 (96.6) 326 (97.3)
≥ 2 47 (2.3) 8 (2.8) 4 (1.3) 14 (2.3) 4 (4.3) 4 (1.4) 4 (3.4) 9 (2.7)
Unless otherwise indicated, data are numbers of patients, and data in parentheses are percentages. *Data are mean ± standard deviation,
†Total of 2042 PTNB procedures in 1948 patients (M:F = 1147:801; mean age, 63 ± 12 years) were analyzed in this study. In patients who underwent PTNB procedures more than two times, each procedure was described as independent case with separate inclusion of sex and age. N/A = not applicable, PTNB = percutaneous transthoracic needle biopsy
Table 3. Diagnostic Success Rate and Pneumothorax Occurrence Rate in Seven Operators during Their Experiences
Operator 1 Operator 2 Operator 3 Operator 4 Operator 5 Operator 6 Operator 7
Number of PTNBs 286 319 601 93 292 116 335
Diagnostic performance*
Overall 277 (96.9) 302 (94.7) 568 (94.5) 88 (94.6) 272 (93.2) 105 (90.5) 308 (91.9)
First 50 49 (98.0) 44 (88.0) 47 (94.0) 46 (92.0) 49 (98.0) 45 (90.0) 45 (90.0)
Last 50 50 (100.0) 47 (94.0) 44 (88.0) 48 (96.0) 47 (94.0) 45 (90.0) 47 (94.0)
Pneumothorax occurrence†
Overall 54 (18.9) 78 (24.5) 185 (30.8) 31 (33.3) 87 (29.8) 24 (20.7) 80 (23.9)
First 50 15 (30.0) 22 (44.0) 15 (30.0) 18 (36.0) 19 (38.0) 13 (26.0) 16 (32.0)
Last 50 10 (20.0) 8 (16.0) 16 (32.0) 18 (36.0) 11 (22.0) 8 (16.0) 16 (32.0)
Data are numbers of patients, and data in parentheses are percentages. *Numbers of cases with diagnostic success during overall, first 50 cases and last 50 cases, †Numbers of cases with pneumothorax occurrence during overall, first 50 cases and last 50 cases.
123 diagnostic failures (6.0%): 9 false positives, 74 false negatives, 5 technical failures, and 35 non-diagnostic PTNBs (e.g., “insufficient for diagnosis,” “only necrotic materials”).
The remaining 1919 cases were correctly diagnosed and defined as cases of diagnostic success, of which 1402 were true positives and 517 were true negatives.
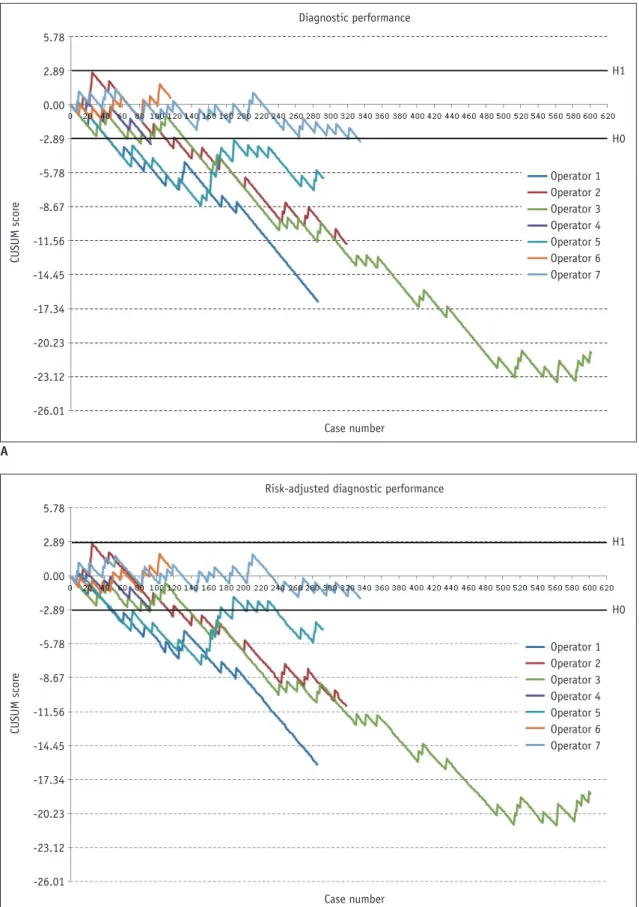
A wide range of time to acquire appropriate skills for diagnostic performance was observed. Figure 1 shows the standard and RA-CUSUM scores for the diagnostic performance of each operator. Six of the 7 operators (85.7%) attained an acceptable failure rate of 6% in diagnostic performance after a median number of 105 PTNB procedures (95% confidence interval [CI], 14–240). The CUSUM chart of Operator 6 remained between the decision limits even after 116 procedures, indicating the requirement for further observation.
The RA-CUSUM plots showed a similar pattern to that of the standard CUSUM plots, and 5 (71.4%) of the 7 operators achieved an acceptable failure rate after a median number of 93 PTNB procedures (95% CI, 39–142). The RA-CUSUM chart demonstrated that Operators 6 and 7 did not reach H0 and remained between the decision limits.
Pneumothorax Occurrence
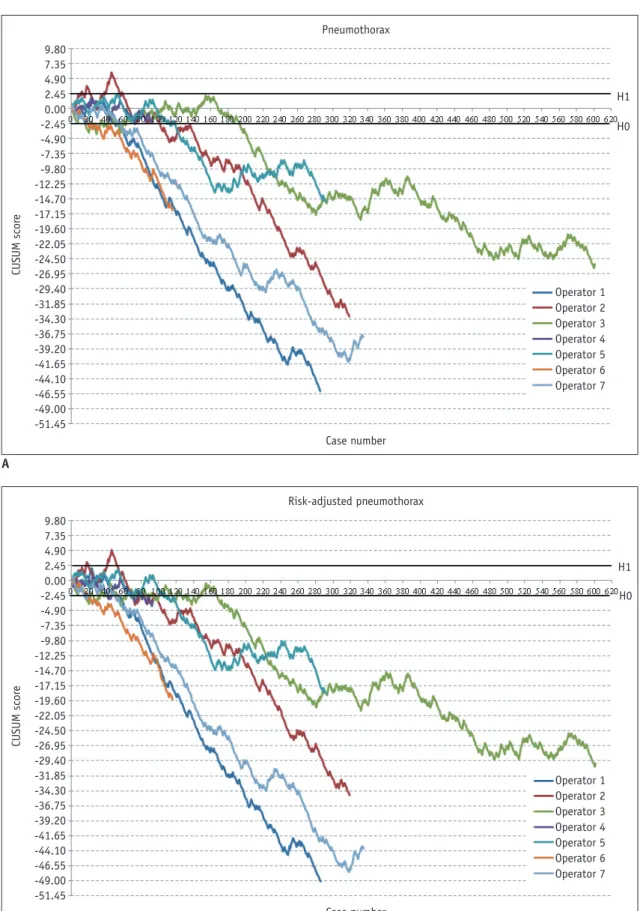
The learning curves for pneumothorax occurrence are shown in Figure 2. For 6 of the 7 operators, the CUSUM line for pneumothorax occurrence demonstrated a downward trend and crossed the decision limits after a median number of 79 PTNBs (95% CI, 27–155) on the standard CUSUM chart. On the RA-CUSUM chart, all operators were shown to have attained competence after a median number of 80 PTNB procedures (95% CI, 38–127).
DISCUSSION
In this study, we assessed the learning curve of image- guided PTNBs and demonstrated the utility of the CUSUM method of monitoring operator performance, particularly in CBCT virtual navigation-guided PTNB. The CUSUM method is a relatively simple statistical method that can assess the competence of operators and monitor performance in the medical field (19). It can demonstrate how individuals acquire proficiency over time and maintain competence.
According to our study results, the diagnostic failure and pneumothorax occurrence rates decreased with the increasing experience of the operators. However, a wide range of experience was found to be necessary to attain
an acceptable failure rate for diagnostic performance.
Operators 1 and 5 acquired the earliest competence after 44 procedures, whereas Operator 7 achieved the latest competence after 333 procedures. Regarding pneumothorax occurrence, the standard CUSUM analysis revealed that the complication rate after a median of 79 procedures was similar or decreased for all but Operator 4.
The amount of experience to achieve proficiency might vary depending on the trainee and the level of performance required (24). This study indicated high variability in the learning process for CBCT-guided PTNB, ranging from approximately 40 cases to more than 300 cases. Several factors may explain this finding. One possible reason is that a different proportion of variables could have affected the outcomes, despite adjustment for those factors. Differences in the prevalence of malignancy, which also determined whether each operator performed a procedure, may also have affected diagnostic performance. In addition, the CUSUM results depended on the order of success and failure, as well as overall performance, such as the diagnostic accuracy or pneumothorax occurrence rate. Alternatively, 2 operators in our study may have been outliers who need more experience to become proficient. High variability in the amount of experience required to learn a skill is not uncommon and has been reported in several studies on medical procedures (12, 15, 24). Thus, individualized training under expert supervision may be necessary.
Several issues must be considered when CUSUM analysis is used in clinical practice; specifically, CUSUM analysis requires the specification of multiple values for outcome measurements. Determining acceptable and unacceptable failure rates is essential, and an acceptable failure rate should be the most accurate estimate of the failure rate of a skilled operator (19). In our study, we set the acceptable failure rate at 0.06 based on the calculated failure rate reported in a recent meta-analysis of CBCT-guided PTNB (20); however, a failure rate of 0.06 can be considered low because the pooled mean success rate of all types of image- guided PTNB is 0.89 (22). The high diagnostic accuracy of CBCT-guided PTNB compared with other modalities in the literature may have been caused by an increase in accuracy resulting from the advantages of the CBCT system or from publication bias in the initial period of this new modality.
In addition, diagnostic failure in our study included
“nondiagnostic” or technical failure, as well as false positives and false negatives, and therefore a difference inevitably exists between diagnostic success and diagnostic
5.78 2.89 0.00 -2.89 -5.78 -8.67 -11.56 -14.45 -17.34 -20.23 -23.12 -26.01
5.78 2.89 0.00 -2.89 -5.78 -8.67 -11.56 -14.45 -17.34 -20.23 -23.12 -26.01
CUSUM scoreCUSUM score
Diagnostic performance
Risk-adjusted diagnostic performance Case number
Case number
H1
H1 H0
H0 Operator 1 Operator 2 Operator 3 Operator 4 Operator 5 Operator 6 Operator 7
Operator 1 Operator 2 Operator 3 Operator 4 Operator 5 Operator 6 Operator 7
Fig. 1. CUSUM graphs of diagnostic performance.
Standard (A) and risk-adjusted (B) CUSUM graphs of diagnostic performance. Upward movement indicates diagnostic failure, whereas downward movement indicates appropriate diagnosis. CUSUM = cumulative summation, H0 = lower decision limit, H1 = upper decision limit
A
B
9.80 7.35 4.90 2.45 0.00 -2.45 -4.90 -7.35 -9.80 -12.25 -14.70 -17.15 -19.60 -22.05 -24.50 -26.95 -29.40 -31.85 -34.30 -36.75 -39.20 -41.65 -44.10 -46.55 -49.00 -51.45
9.80 7.35 4.90 2.45 0.00 -2.45 -4.90 -7.35 -9.80 -12.25 -14.70 -17.15 -19.60 -22.05 -24.50 -26.95 -29.40 -31.85 -34.30 -36.75 -39.20 -41.65 -44.10 -46.55 -49.00 -51.45
CUSUM scoreCUSUM score
Pneumothorax
Risk-adjusted pneumothorax Case number
Case number
H1
H1 H0
H0 Operator 1 Operator 2 Operator 3 Operator 4 Operator 5 Operator 6 Operator 7
Operator 1 Operator 2 Operator 3 Operator 4 Operator 5 Operator 6 Operator 7
Fig. 2. CUSUM graphs of pneumothorax occurrence.
Standard (A) and risk-adjusted (B) CUSUM graphs for pneumothorax occurrence.
A
B
5.42 2.71 0.00 -2.71 -5.42 -8.13 -10.84 -13.55 -16.26 -18.97 -21.68 -24.39 -27.10 -29.81 -32.52 -35.23 -37.94 -40.65 -43.36 -46.07 -48.78 -51.49 -54.20 -56.91 -59.62 -62.33
8.97
5.98
2.99
0.00
-2.99
-5.98
-8.97
CUSUM scoreCUSUM score
Diagnostic performance
Diagnostic performance Case number
Case number
H1
H1 H0
H0 Operator 1 Operator 2 Operator 3 Operator 4 Operator 5 Operator 6 Operator 7
Operator 1 Operator 2 Operator 3 Operator 4 Operator 5 Operator 6 Operator 7
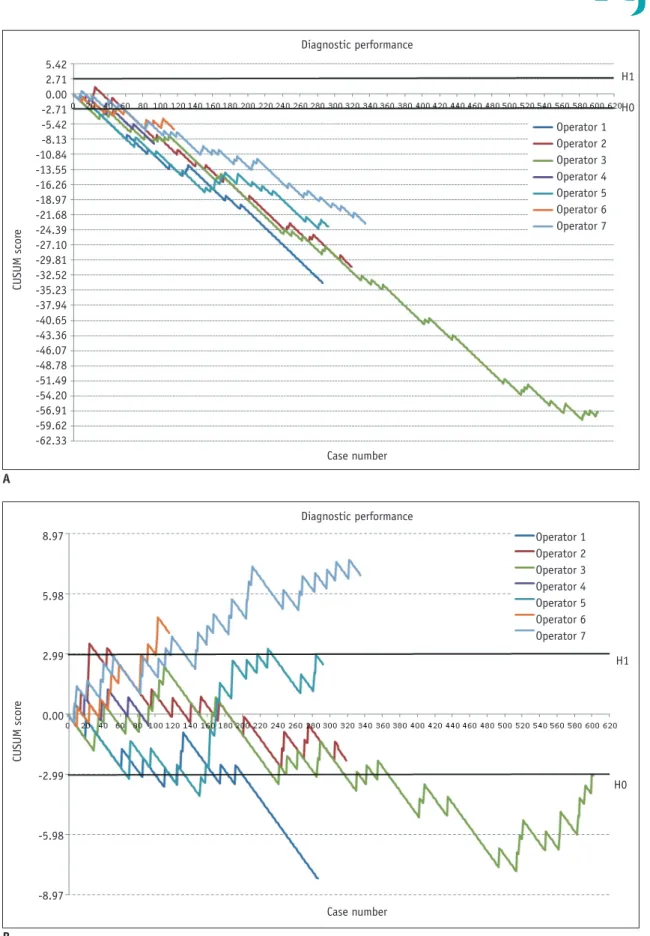
Fig. 3. Impact of failure rate on CUSUM graphs. Standard CUSUM graphs using different failure criteria.
A. When less strict failure rates were applied (p0 = 0.10, p1 = 0.20), all operators achieved proficiency after median of 33 procedures. B. When more harsh failure rates (p0 = 0.04, p1 = 0.08) were applied, only 2 reached lower decision limit and 2 operators crossed upper decision limit, suggesting poor performance, even after finishing their training.
A
B
accuracy. We then simulated how the acceptable and unacceptable failure rates would affect the outcome of the CUSUM plots in diagnostic performance (Fig. 3). If a more generous acceptable failure rate of 0.10 were adopted, all operators would have achieved proficiency after a median of 33 procedures. Conversely, if a harsher failure rate of 0.04 were adopted as the acceptable failure rate, only 2 operators would have been able to reach the lower decision limit, whereas 2 operators would have crossed the upper decision limit, suggesting poor performance, even after finishing their training.
Knowledge of the learning curve may be particularly useful in a medical training program. In general practice, trainees perform medical procedures for a certain period of time under the supervision of specialists and then, after attaining proficiency, perform them independently.
However, difficulties exist in judging whether trainees have truly achieved competency. The CUSUM method assures trainees and supervisors that learning is proceeding favorably if the graph goes downward to a lower decision limit and determines whether the operator is becoming more competent. In addition, CUSUM may also be useful for quality control, such as monitoring an operator’s ability and identifying poor performance (19). Our study demonstrated this potential in the pneumothorax occurrence chart. The plot of Operator 2 was above the upper limit after 10 procedures, which indicated a higher failure rate than the unacceptable failure rate of 0.45. However, the plot moved down after more procedures were performed, eventually crossing the lower decision limit after 102 PTNBs, and competence was maintained thereafter. Thus, if the CUSUM method is applied in real clinical practice, it can help identify deteriorated performance, thereby providing an opportunity to intervene and ensure the operator’s improvement before too many adverse events can occur.
Our study had several limitations. First, setting different failure rates may lead to substantially different outcomes regardless of whether the trainee is proficient. Therefore, careful interpretation of the CUSUM chart is warranted.
Nevertheless, we believe that CUSUM analysis can be a useful and intuitive method of evaluating an operator’s performance, which can determine the learning curves necessary for different radiology interventional procedures (CBCT virtual navigation-guided PTNBs in this case).
Second, for the general application of CUSUM in assessing the learning curve and monitoring quality control, a guideline for setting values should be provided by an
authorized committee, which warrants further study with a larger population.
In conclusion, operators’ performance, including
diagnostic accuracy and pneumothorax occurrence, in CBCT virtual navigation-guided PTNBs was demonstrated to improve with increasing experience over a wide range of learning periods.
Conflicts of Interest
The authors have no potential conflicts of interest to disclose.
ORCID iDs Chang Min Park
https://orcid.org/0000-0003-1884-3738 Su Yeon Ahn
https://orcid.org/0000-0002-3370-0498 Soon Ho Yoon
https://orcid.org/0000-0002-3700-0165 Hyungjin Kim
https://orcid.org/0000-0003-0722-0033 Jin Mo Goo
https://orcid.org/0000-0003-1791-7942
REFERENCES
1. Ost DE, Gould MK. Decision making in patients with pulmonary nodules. Am J Respir Crit Care Med 2012;185:363- 372
2. Callister MEJ, Baldwin DR, Akram AR, Barnard S, Cane P, Draffan J, et al. British Thoracic Society guidelines for the investigation and management of pulmonary nodules:
accredited by NICE. Thorax 2015;70:ii1-ii54
3. Gould MK, Fletcher J, Iannettoni MD, Lynch WR, Midthun DE, Naidich DP, et al. Evaluation of patients with pulmonary nodules: when is it lung cancer?: ACCP evidence-based clinical practice guidelines. Chest 2007;132(3 Suppl):108S-130S 4. Wisnivesky JP, Henschke CI, Yankelevitz DF. Diagnostic
percutaneous transthoracic needle biopsy does not affect survival in stage I lung cancer. Am J Respir Crit Care Med 2006;174:684-688
5. Choo JY, Park CM, Lee NK, Lee SM, Lee HJ, Goo JM.
Percutaneous transthoracic needle biopsy of small (≤1 cm) lung nodules under C-arm cone-beam CT virtual navigation guidance. Eur Radiol 2013;23:712-719
6. Lee SM, Park CM, Lee KH, Bahn YE, Kim JI, Goo JM. C-arm cone-beam CT-guided percutaneous transthoracic needle biopsy of lung nodules: clinical experience in 1108 patients.
Radiology 2014;271:291-300
7. Lim HJ, Park CM, Yoon SH, Bae JS, Goo JM. Cone-beam CT
virtual navigation-guided percutaneous needle biopsy of suspicious pleural metastasis: a pilot study. Korean J Radiol 2018;19:872-879
8. Page ES. Continuous inspection schemes. Biometrika 1954;41:100-115
9. Yelle LE. The learning curve: historical review and comprehensive survey. Decision sciences 1979;10:302-328 10. Biau DJ, Resche-Rigon M, Godiris-Petit G, Nizard RS, Porcher
R. Quality control of surgical and interventional procedures: a review of the CUSUM. Qual Saf Health Care 2007;16:203-207 11. Rogers CA, Reeves BC, Caputo M, Ganesh JS, Bonser RS,
Angelini GD. Control chart methods for monitoring cardiac surgical performance and their interpretation. J Thorac Cardiovasc Surg 2004;128:811-819
12. Komatsu R, Kasuya Y, Yogo H, Sessler DI, Mascha E, Yang D, et al. Learning curves for bag-and-mask ventilation and orotracheal intubation: an application of the cumulative sum method. Anesthesiology 2010;112:1525-1531
13. Cundy TP, Gattas NE, White AD, Najmaldin AS. Learning curve evaluation using cumulative summation analysis-a clinical example of pediatric robot-assisted laparoscopic pyeloplasty.
J Pediatr Surg 2015;50:1368-1373
14. Usluer O, Kaya SO. Endobronchial ultrasound-guided transbronchial needle aspiration of mediastinal lymphadenopathy: effect of the learning curve. Interact Cardiovasc Thorac Surg 2014;19:693-695
15. Kemp SV, El Batrawy SH, Harrison RN, Skwarski K, Munavvar M, Rosell A, et al. Learning curves for endobronchial ultrasound using analysis. Thorax 2010;65:534-538
16. Groth SS, Whitson BA, D’Cunha J, Maddaus MA, Alsharif M, Andrade RS. Endobronchial ultrasound-guided fine-needle aspiration of mediastinal lymph nodes: a single institution’s
early learning curve. Ann Thorac Surg 2008;86:1104-1109;
discussion 1109-1110
17. Sun J, Xie F, Zheng X, Jiang Y, Zhu L, Mao X, et al. Learning curve of electromagnetic navigation bronchoscopy for diagnosing peripheral pulmonary nodules in a single institution. Translational Cancer Research 2017;6:541-551 18. Kim JI, Park CM, Kim H, Lee JH, Goo JM. Non-specific benign
pathological results on transthoracic core-needle biopsy: how to differentiate false-negatives? Eur Radiol 2017;27:3888- 3895
19. Bolsin S, Colson M. The use of the CUSUM technique in the assessment of trainee competence in new procedures. Int J Qual Health Care 2000;12:433-438
20. Yan GW, Bhetuwal A, Yan GW, Sun QQ, Niu XK, Zhou Y, et al.
A systematic review and meta-analysis of C-arm cone-beam CT-guided percutaneous transthoracic needle biopsy of lung nodules. Pol J Radiol 2017;82:152-160
21. Lim WH, Park CM, Yoon SH, Lim HJ, Hwang EJ, Lee JH, et al.
Time-dependent analysis of incidence, risk factors and clinical significance of pneumothorax after percutaneous lung biopsy.
Eur Radiol 2018;28:1328-1337
22. Gupta S, Wallace MJ, Cardella JF, Kundu S, Miller DL, Rose SC. Quality improvement guidelines for percutaneous needle biopsy. J Vasc Interv Radiol 2010;21:969-975
23. Matheny ME, Ohno-Machado L, Resnic FS. Risk-adjusted sequential probability ratio test control chart methods for monitoring operator and institutional mortality rates in interventional cardiology. Am Heart J 2008;155:114-120 24. Dessolle L, Fréour T, Barrière P, Jean M, Ravel C, Daraï E, et
al. How soon can I be proficient in embryo transfer? Lessons from the cumulative summation test for learning curve (LC- CUSUM). Hum Reprod 2010;25:380-386