Small Malignant Hepatic Tumor Detection in Gadolinium- and
Ferucarbotran-Enhanced Magnetic Resonance Imaging: does Combining Ferucarbotran-Enhanced T2*-Weighted Gradient Echo and T2-Weighted Turbo
Spin Echo Images have Additive Efficacy?
Objective: To determine if a combination of ferucarbotran-enhanced
T2*weighted-gradient echo (T2*W-GRE) and T2-weighted turbo spin echo (T2W- TSE) images in gadolinium- and ferucarbotran-enhanced MRI has additive effica- cy compared to each image alone for detecting small ( ≤ 2.0 cm) hepatocellular carcinoma (HCC) lesions in a group of cirrhotic patients and metastases in a group of non-cirrhotic patients.
Materials and Methods: Two readers retrospectively analyzed gadolinium- and ferucarbotran-enhanced T2*W-GRE, T2W-TSE, and combined T2*W- GRE/T2W-TSE images of 119 patients with 157 HCCs and 32 patients with 98 metastases. The diagnostic accuracy and sensitivity for each image set and the combined set were evaluated using the alternative-free response receiver operat- ing characteristic method.
Results: The mean area under the curve value of the combined set (0.966) tended to be better than that for each individual image set (T2W-TSE [0.910], T2*W-GRE [0.892]). Sensitivities in the combined set were higher than those in each individual image set for detecting HCC (mean, 93.0% versus 81.6% and 86.7%, respectively, p < 0.01). Sensitivities in the combined set and the T2W- TSE set were the same for detecting metastases, and both were higher than the sensitivity seen in the T2*W-GRE set (mean, 97.5% versus 85.2 %, p < 0.01).
Conclusion: Combining ferucarbotran-enhanced T2*W-GRE and T2W-TSE has additive efficacy for detecting HCC in cirrhotic patients, but T2W-TSE is pre- ferred for detecting metastases in non-cirrhotic patients.
ith the recent development of tissue-specific MR contrast agents such as superparamagnetic iron oxide (SPIO) and gadobenate dimeglumine, it is widely agreed that contrast-enhanced liver MR is the most accurate non- invasive imaging modality for the evaluation of liver malignancies, including hepato- cellular carcinoma (HCC) and metastases (1-3). The combined use of gadolinium and SPIO is recommended to increase accuracy in the detection and characterization of focal liver lesions and is considered the most accurate non-invasive imaging modality for the evaluation of liver tumors (4, 5).
Young Kon Kim, MD
1Young Hwan Lee, MD
2Hyo Sung Kwak, MD
1Chong Soo Kim, MD
1Young Min Han, MD
1Index terms : Liver, neoplasm Liver, MR Liver, cirrhosis
Magnetic resonance (MR), contrast media
DOI:10.3348/kjr.2008.9.6.510
Korean J Radiol 2008 ; 9 : 510-519 Received April 2, 2008; accepted after revision July 8, 2007.
1Department of Diagnostic Radiology, Chonbuk National University Hospital and Medical School, Choubuk 561-712, Korea; 2Department of Diagnostic Radiology, Wonkwang University Hospital and School of Medicine, Iksan 570-711, Korea
Address reprint requests to : Young Kon Kim, MD, Department of Diagnostic Radiology, Chonbuk National University Hospital and Medical School, 634-18, Keumam-dong, Jeonju, Chonbuk 561-712, Korea.
Tel. (8263) 250-2314 Fax. (8263) 272-0481 e-mail: [email protected]
W
Superparamagnetic iron oxide-enhanced MR imaging has received attention as a non-invasive examination to replace CT arterial portography for the detection of liver malignancies (3, 6). Extensive studies have been conducted to determine the optimal pulse sequence for SPIO-
enhanced MRI. Although debate still exists, T2*-weighted gradient recalled-echo (T2*W-GRE) and T2-weighted turbo-spin echo (T2W-TSE) sequences have been most widely used as optimized sequences in SPIO-enhanced MRI for the detection of focal liver lesions (7-10).
However, in spite of the variety of pulse sequences now available for SPIO-enhanced liver MRI in clinical practice, there is no published data concerning the question of whether T2*W-GRE or T2W-TSE sequences alone in SPIO-enhanced MRI are sufficient for the detection of liver malignancies, or if the sequences should be combined to provide better detection. Considering the acquisition of multiple MR sequences can be time-consuming and can result in greater inconvenience to patients (particularly when double contrast MRI is considered), acquisition of objective data regarding the use of combined sequences in SPIO-enhanced MRI is reasonable. Therefore, this study was conducted to determine if combining SPIO-enhanced T2*W-GRE and T2W-TSE sequences in sequentially acquired gadolinium-enhanced and SPIO-enhanced MRI has additive value compared to each sequence alone, for the detection of small liver malignancies, including HCCs and metastases. Additionally, we wanted to analyze the relative efficacy of each MR sequence and both sequences combined, with regard to HCCs in patients with underly- ing chronic liver disease and liver metastases in patients with no underlying liver disease. This study was conducted in a large series of patients.
MATERIALS AND METHODS
Patients
We retrospectively reviewed our institutional database for liver MRIs conducted between January 2004 and September 2006 on patients suspected of having liver malignancy based on clinical and prior CT findings. We identified 391 patients with HCCs and 55 patients with liver metastases who underwent a double contrast MRI that consisted of a sequentially acquired gadolinium- enhanced and ferucarbotran-enhanced liver MRI. No institutional review board approval was required for retrospective review of medical records and images.
Of the 446 potential study patients, only those who met the following criteria were included in the study: (a) nodular HCC 2 cm or smaller in size that had been proven on histology or showed typical imaging findings on hepatic
angiography, Lipiodol CT, and dynamic CT, (b) liver metastases 2 cm or smaller in size that had been proven on histology or showed typical imaging findings on three- phase dynamic CT and follow-up CT or MRI (rapid progression of disease), (c) follow-up contrast-enhanced CT or MRI performed for at least six months (range: 6-30 months). Consequently, the study population included 151 patients (114 men and 37 women; age range: 40-74 years):
119 patients with 157 HCCs and 32 patients with 98 metastases. The lesion distribution according to the confir- mative diagnostic method is given in Table 1. Of 51 HCCs (from 38 patients) that were confirmed by pathologic analysis of surgical specimens, 45 lesions were grade I (n = 15) or II (n = 30) according to Edmondson’s classification of HCC (11), and the remaining six were grade III. For the 81 patients with 106 HCCs who underwent transarterial chemoembolization, the final diagnosis was based on a combined interpretation of findings from all diagnostic procedures by two experienced radiologists in consensus.
Diagnostic procedures included the following: image- guided biopsy (n = 12), characteristic imaging findings on three-phase multidetector CT (MDCT) and MRI (arterial hypervascularization and early washout on dynamic imaging and arterial hypervascularization plus hyperinten- sity on SPIO-enhanced MRI) (n = 106), and persistent dense compact nodular Lipiodol uptake of the detected lesions on MDCT and MRI after TACE (n = 106) (12), as well as aggravation (local recurrence or new growing HCCs) on follow-up CT or MRI (n = 19). Of all the patients with HCCs, four underwent ablation therapy, and two underwent chemoembolization before MRI. All patients with HCCs had liver cirrhosis (n = 116) or chronic hepatitis (n = 3) associated with viral hepatitis B. Seven of them also had viral hepatitis C. During the inclusion period for this retrospective study, there was no patient with small HCC (≤ 2.0 cm) who was without underlying liver parenchymal disease. The diagnosis of chronic hepatitis or cirrhosis was made by means of histology in 50 patients and by a combination of clinical course, blood chemistry tests (aspartate aminotransferase, alanine aminotransferase, alkaline phosphatase, bilirubin, albumin, and globulin), and typical CT and MRI findings in the remaining 69 patients.
Based on the Child-Pugh classification, 98 patients were classified as Child class A, and the remaining 18 patients were classified as class B. Liver metastases arose from the following primary tumors: colorectal carcinoma (n = 25), gastric carcinoma (n = 5), and pancreatic carcinoma (n = 2).
No patients with liver metastases had cirrhosis, and all had
normal hepatic function test results, including prothrombin
time and blood chemistry (serum albumin, total bilirubin
level, and choline esterase).
MR Examination
All MRI examinations were performed using a 1.5 T unit (Magnetom Symphony; Siemens, Enlargen, Germany) with a combination of a phased array body coil for signal reception. Baseline MR images included a respiratory- triggered T2W-TSE sequence and a breath-hold T2*W- GRE sequence. Respiratory-triggered T2W-TSE imaging was obtained using the following parameters: TR/TE of 3300-4200/76, echo train length of 13, 150�flip angle, matrix of 202 × 384, signal averages of two, and average scan time 3 minutes. Breath-hold T2*W-GRE imaging was obtained using the following parameters: TR/TE of 180/12, 30�flip angle, matrix of 144 × 256, signal average of one, two sequential acquisitions, 20 slices, and average scan time 35 seconds (two stacks with 10 slices each in a 15-17- second breath-hold). A relatively long TE (12 ms) and lower flip angle (30�) were used for increasing the sensitiv- ity to the field inhomogeneity induced by SPIO administra- tion and for decreasing the T1 contrast, respectively (7, 13). For all sequences, a 6-7 mm slice thickness was used with a 10% intersection gap and a field of view of 35-40 cm, depending on the size of the liver.
In the first session, dynamic MRIs (volumetric interpo- lated breath-hold examination, VIBE: Siemens, Erlangen, Germany) with mSENSE were performed using the follow- ing parameters: TR/TE of 4.3/2.0, flip angle of 12�, bandwidth of 450 Hz/Px, matrix of 256 (read)×135 (phase)×40-46 (partition), effective slice thickness of 3.5- 4 mm, and field of view of 32-35 cm. The determination of scan delay for the image acquisition timing was achieved using the test bolus technique, in which 1 mL of contrast media was injected, followed by a 20 mL saline flush, and the vessel of interest (the abdominal aorta) was then scanned approximately once per second. The mean delay time to peak aortic enhancement was 21 seconds (range:
17.0-23.0 sec). Thus, for a sequential mode of k-space acquisition (center lines of k-space are acquired during the middle of the acquisition time), the mean delay times (time interval between bolus administration and the start of image acquisition) for the early arterial, late arterial, portal, and equilibrium phase were 20, 30, 60, and 180 seconds, respectively. The acquisition time for each phase was 10-11 seconds. Gadopentetate dimeglumine
(Magnevist
�, Bayer HealthCare) was injected at a dosage of 0.1 mmol/kg body weight at a rate of 2 mL/sec. The contrast was injected into the antecubital vein using an automated injector (Spectris MR; Medrad Europe, Maastricht, The Netherlands), and a 20 mL saline flush followed the contrast injection.
In the second session, ferucarbotran (SHU-555-A;
Resovist
�, Bayer HealthCare)-enhanced imaging was
performed immediately after completion of the dynamic MR examination. Ferucarbotran-enhanced imaging was comprised of the respiratory-triggered T2-weighted TSE sequence and the breath-hold T2*-weighted GRE sequence for the baseline MRI. Patients up to 60 kg body weight received 0.9 mL of ferucarbotran, and patients above 60 kg body weight received 1.4 mL of ferucarbotran (8-12 mol of iron per kilogram of body weight). Ferucarbotran was rapidly injected intravenously through a 5 m filter and was followed by a 20 mL saline flush; imaging then commenced approximately 10 minutes after the intravenous injection of contrast agent.
Imaging Analysis
Two gastrointestinal radiologists (one on-site reviewer and one off-site reviewer), who had at least six years experience interpreting liver imaging in their daily clinical practice, reviewed the images independently and
separately. All images were reviewed on a 2000×2000 Picture Archiving and Communication Systems (PACS;
Marotech, Seoul, Korea) monitor. The radiologists were aware of the overall goal of the study before the reading session, and they knew that the patients were at risk for HCC or metastasis, but were unaware of the presence or location of any liver lesions or of the results of other imaging studies. They independently reviewed three sets of MR images in two reading sessions: (a) unenhanced T1- and T2-weighted imaging, gadolinium-enhanced dynamic imaging, and ferucarbotran-enhanced T2*W-GRE imaging (the T2*W-GRE set), (b) unenhanced T1- and T2-weighted imaging, gadolinium-enhanced dynamic imaging, and ferucarbotran-enhanced T2W-TSE imaging (the T2W-TSE set), and (c) a combination of the T2*W-GRE set and T2W- TSE set (the combined set). In the first session, either the T2*W-GRE set or the T2W-TSE set was randomly presented with no specific patient order. In the second session, the remaining T2*W-GRE set or T2W-TSE set was randomly presented, and the T2*W-GRE or T2W-TSE reviewed in the first reading recession was added for a combined review. To minimize any learning bias, there was at least a two-week interval between the two reading sessions.
The criteria for diagnosing HCC or metastasis on the
ferucarbotran-enhanced MRI were defined as a focal,
discrete, nodular high signal intensity area relative to
adjacent liver parenchyma (lower than the signal intensity
of CSF or gallbladder on a T2W-TSE sequence to exclude
the cyst) on both T2*W-GRE and T2W-TSE images. On
gadolinium-enhanced MRI, early enhancement with rapid
washout (typical of HCC) and irregular peripheral
enhancement with a peripheral washout on delayed phase
images (typical of metastases) were used as the criteria for diagnosing malignancy. For each eligible lesion, one of four confidence levels was assigned to each decision as follows:
“1” as ‘probably not present’; “2” as ‘possibly present’;
“3” as ‘probably present’; and “4” as ‘definitely present’.
Lesions that showed only arterial hypervascularization were regarded as category 2 if they showed no delayed capsular enhancement, mosaic pattern, or moderate hyperintensity on T2-weighted imaging (category 3).
During gadolinium-enhanced MRI, 115 of the total 157 HCCs showed early enhancement with rapid washout, and the remaining 42 appeared as hyperintense nodules during arterial phase imaging and were occult during portal and equilibrium phase imaging. To achieve an accurate correla- tion between the findings of the scored lesions and the findings of the reference standard, each observer made markings over all lesions with arrows on the PACS monitor. After the two observers conducted the two review sessions, the study coordinator, who was not involved in image interpretation, compared the scoring results of each of the observers to a gold standard, and then a possible explanation was formulated for any false- positive or false-negative findings.
Statistical Analysis
Based on the reviews submitted by the two observers, an alternative-free response receiver operating characteristic (ROC) curve analysis was performed on a lesion-by-lesion basis (14). For each imaging set (T2*W-GRE images, T2W- TSE images, and combined), an alternative-free response ROC curve was fitted to each observer’s confidence rating data using a maximum likelihood estimation program (ROCKIT 0.9B; courtesy of Metz CE, University of Chicago, IL, 1998) (15). The area under the alternative-
free response ROC curve (Az) was calculated to determine the diagnostic accuracy of each image, each observer, and lesion type. The differences between the imaging sets with regard to the area under the alternative-free response ROC curves were compared using a two-tailed Student’s t test for paired data. The sensitivities for each image and for each observer, as well as according to the lesion type, were then calculated. The sensitivity was defined as the number of true positive diagnoses, using a confidence level of 3 or 4. The sensitivities and positive predictive values for each image set were then compared using the McNemar test. A two-tailed p value of less than 0.05 was considered statisti- cally significantly. We also calculated the 95% confidence interval (CI) to determine a range of plausible sensitivity differences.
In order to assess interobserver agreement for evaluating the two images and the combined approach, we calculated the kappa statistic for multiple observers (16). Kappa values of less than 0.20 indicated positive, but poor, agreement, those from 0.21-0.40 indicated fair agreement, those from 0.41-0.60 indicated moderate agreement, those from 0.61-0.80 indicated good agreement, and those greater than 0.81 indicated excellent agreement.
RESULTS
For all 255 lesions, including the 157 HCCs and 98 metastases, there was a trend toward increased diagnostic accuracy (Az values) for the combined set (mean, 0.966) when compared with each set alone (mean, 0.892 for T2*W-GRE set; 0.910 for T2W-TSE set), to a statistically
Table 1. Case Distribution According to Confirmative Diagnostic Method
HCC (n = 157) Metastasis (n = 98) Lesion size range (mean) 0.4-2.0 cm 0.3-2.0 cm
(mean 1.3 cm) (mean 1.1 cm) Pathological (n = 63)
Surgery 51 45
Biopsy 12 03
Imaging study (n = 94)
MDCT (& F/U CT) & MRI 94 98
Angiography & Lipiodol CT 94
AFP (> 400 ng/ml) 10
F/U period 6 -30 months 9 -16 months (mean, 18 months) (mean, 13 months) Note.─HCC = hepatocellular carcinoma, MDCT = multidectector CT, F/U = follow up, AFP = alpha fetoprotein
Table 2. Individual Accuracy (Az) for Detection of 157 Hepatocellular Carcinomas and 98 Metastases Using T2*W GRE Set, T2W TSE Set, and Combined Set
T2*W GRE Set T2W TSE Set Combined Set Observer 1
All lesions 0.887 0.038 0.923 0.027 0.968 0.013 a HCCs 0.899 0.039 0.879 0.045 0.956 0.020 a Metastases 0.860 0.091 0.985 0.015 0.985 0.015a Observer 2
All lesions 0.896 0.036 0.897 0.034 0.964 0.015 a HCCs 0.883 0.044 0.871 0.047 0.954 0.021 a Metastases 0.929 0.052 0.941 0.044 0.980 0.019a Note.─HCC = hepatocellular carcinoma, Az values are mean 1 SD.
T2*W GRE set = combining unenhanced imaging, gadolinium-enhanced dynamic imaging, and ferucarbotran-enhanced T2*W-GRE imaging. T2W TSE set = combining unenhanced imaging, gadolinium-enhanced imaging, and ferucarbotran-enhanced T2W-TSE imaging. Combined set = combining T2*W GRE set and T2W TSE set.
aCombined Az values were significantly greater than those for each sequence alone (p < 0.05).
significant degree (p = 0.004 [observer 1], 0.003 [observer 2] for the T2*W-GRE set; p = 0.033 [observer 1], 0.025 [observer 2] for the T2W-TSE set) (Table 2). Furthermore, considering the sensitivity for all lesions, the combined set (mean, 94.7%) was significantly more sensitive than each set alone (mean, 86.1% for T2*W-GRE set; 87.7% for T2W-TSE set, p = 0.0001) (Table 3).
For detection of HCCs, the Az value of the combined set was significantly higher than that of each set alone, for both observers (p = 0.016 [observer 1], 0.013 [observer 2]
for the T2*W-GRE set; p = 0.042 for the T2W-TSE set) (Table 2). Although the Az values of the T2*W-GRE set were slightly better than those of the T2W-TSE set for both observers (Fig. 1), no significant difference was noted
for either observer (p = 0.635 for observer 1; p = 0.801 for observer 2). Among the 157 HCCs, the T2W-TSE set allowed for the depiction of 127 lesions (sensitivity, 80.9%; 95% CI: 73.9%, 86.7%) by observer 1 and 129 lesions (sensitivity, 82.2%; 95% CI: 75.35%, 87.8%) by observer 2; the T2*W-GRE set allowed the depiction of 135 lesions (sensitivity, 86.0%; 95% CI: 79.6%, 91.0%) by observer 1 and 137 lesions (sensitivity, 87.3%; 95% CI:
81.0%, 92.0%) by observer 2. There was a significant difference in sensitivities between the two image sets for both observers (p = 0.01). The combined approach allowed for the depiction of 145 lesions (sensitivity, 92.4%; 95%
CI: 87.05%, 96.0%) by observer 1 and 147 lesions (sensitivity, 93.6%; 95% CI: 88.6%, 96.9%) by observer 2
A B
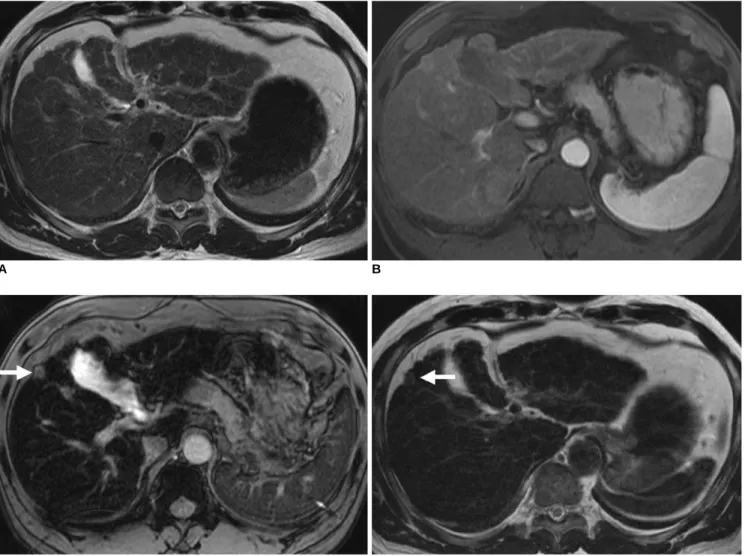
Fig. 1. 55-year-old man with well-differentiated hepatocellular carcinoma in subcapsular area of right hepatic lobe.
A. Axial respiratory-triggered T2-weighted turbo spin echo (4200/76) imaging shows no hepatic mass.
B. Axial arterial phase three-dimensional dynamic MRI after administration of gadopentetate dimeglumine (4.3/2.0) shows no detected lesion.
C. Axial ferucarbotran-enhanced breath-hold T2*-weighted gradient echo imaging (180/12) shows high signal intensity nodule (arrow) in subcapsular area of liver, which was assigned confidence level of 4 by both observers.
D. Axial ferucarbotran-enhanced respiratory-triggered T2-weighted turbo spin echo imaging (4200/76) shows no definitive lesion (arrow) at same location as in A. This was assigned score of 1 and 2 by the two observers, respectively.
C D
(mean, 93.0%), which was significantly better than the values obtained using each set alone (mean, 81.6% for T2W-TSE set, 86.7% for T2*W-GRE set) (p = 0.0001 for
T2W-TSE set, p = 0.002 for T2*W-GRE set). There were nine and eight HCCs (size range: 0.6-1.2 cm, mean size:
0.9 cm) for each observer, respectively, which were not
A B
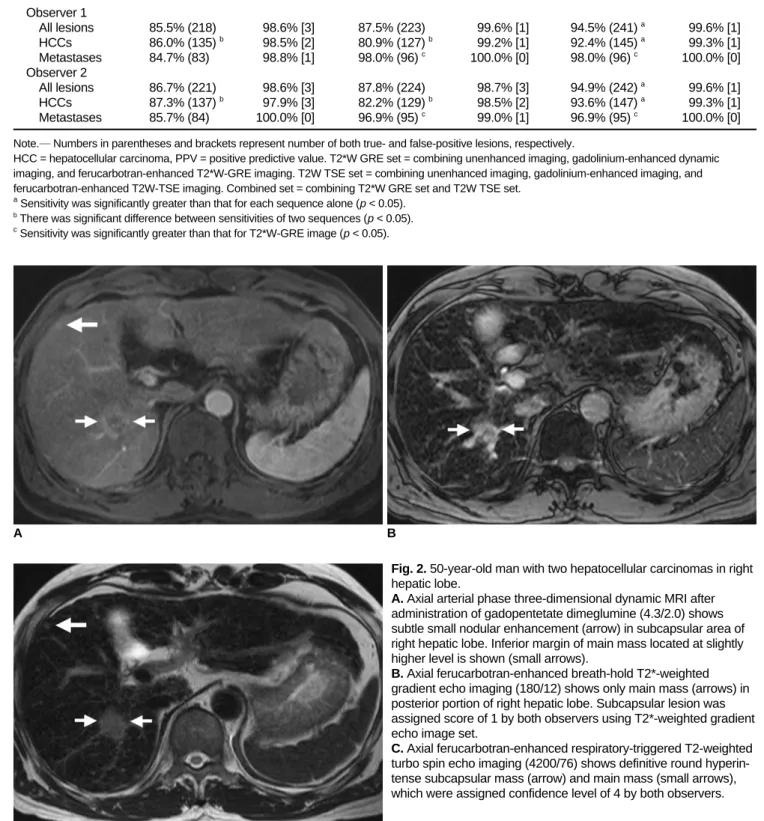
Fig. 2. 50-year-old man with two hepatocellular carcinomas in right hepatic lobe.
A. Axial arterial phase three-dimensional dynamic MRI after administration of gadopentetate dimeglumine (4.3/2.0) shows subtle small nodular enhancement (arrow) in subcapsular area of right hepatic lobe. Inferior margin of main mass located at slightly higher level is shown (small arrows).
B. Axial ferucarbotran-enhanced breath-hold T2*-weighted gradient echo imaging (180/12) shows only main mass (arrows) in posterior portion of right hepatic lobe. Subcapsular lesion was assigned score of 1 by both observers using T2*-weighted gradient echo image set.
C. Axial ferucarbotran-enhanced respiratory-triggered T2-weighted turbo spin echo imaging (4200/76) shows definitive round hyperin- tense subcapsular mass (arrow) and main mass (small arrows), which were assigned confidence level of 4 by both observers.
C
Table 3. Sensitivities and Positive Predictive Values for Revealing 157 Hepatocellular Carcinomas and 98 Metastases Using T2*W GRE Set, T2W TSE Set, and Combined Set
T2*W GRE Set T2W TSE Set Combined Set
Sensitivity PPV Sensitivity PPV Sensitivity PPV
Observer 1
All lesions 85.5% (218) 98.6% [3] 87.5% (223) 99.6% [1] 94.5% (241) a 99.6% [1]
HCCs 86.0% (135) b 98.5% [2] 80.9% (127) b 99.2% [1] 92.4% (145) a 99.3% [1]
Metastases 84.7% (83) 98.8% [1] 98.0% (96) c 100.0% [0] 98.0% (96) c 100.0% [0]
Observer 2
All lesions 86.7% (221) 98.6% [3] 87.8% (224) 98.7% [3] 94.9% (242) a 99.6% [1]
HCCs 87.3% (137) b 97.9% [3] 82.2% (129) b 98.5% [2] 93.6% (147) a 99.3% [1]
Metastases 85.7% (84) 100.0% [0] 96.9% (95) c 99.0% [1] 96.9% (95) c 100.0% [0]
Note.─Numbers in parentheses and brackets represent number of both true- and false-positive lesions, respectively.
HCC = hepatocellular carcinoma, PPV = positive predictive value. T2*W GRE set = combining unenhanced imaging, gadolinium-enhanced dynamic imaging, and ferucarbotran-enhanced T2*W-GRE imaging. T2W TSE set = combining unenhanced imaging, gadolinium-enhanced imaging, and ferucarbotran-enhanced T2W-TSE imaging. Combined set = combining T2*W GRE set and T2W TSE set.
aSensitivity was significantly greater than that for each sequence alone (p < 0.05).
bThere was significant difference between sensitivities of two sequences (p < 0.05).
cSensitivity was significantly greater than that for T2*W-GRE image (p < 0.05).
detected on the T2*W-GRE set, but which were detected on the T2W-TSE set (Fig. 2). There were 17 HCCs (size range: 0.6-1.9 cm, mean size: 1.2 cm) for both observers that were not detected on the T2W-TSE set, but which were detected on the T2*W-GRE set. Of the 51 HCCs with surgical confirmation, four well-differentiated HCCs were not detected by either observer on the T2W-TSE set, but were detected on the T2*W-GRE set by both observers.
For the remaining lesions, the two image sets showed similar results.
For the detection of liver metastases, the Az values of
the combined set and the T2W-TSE set were better than those of the T2*W-GRE set for both observers, although the difference was not statistically significant (p = 0.134 for observer 1; p = 0.162, 0.772 for observer 2). The sensitiv- ity of the combined set was the same as that of the T2W- TSE set (98.0%; 95% CI: 92.8%, 99.7%, for observer 1;
96.9%; 95% CI: 91.3%, 99.3%, for observer 2; mean 97.5%), which was significantly better than that of the T2*W-GRE set for both observers (84.7%; 95% CI:
76.0%, 91.2%, for observer 1; 85.7%; 95% CI: 77.2%, 92.0%, for observer 2; mean 85.2%) (p = 0.0001) (Fig. 3).
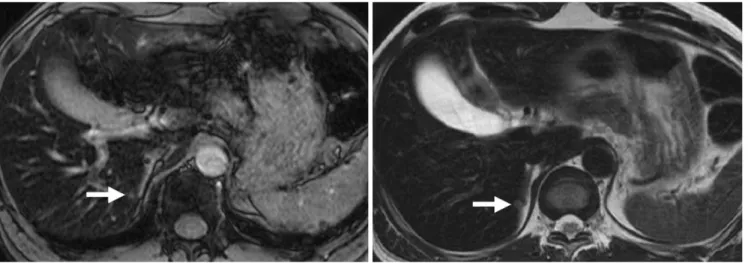
Fig. 3. 57-year-old man with surgically confirmed 0.4-cm liver metastasis from rectal cancer.
A. Axial ferucarbotran-enhanced breath-hold T2*-weighted gradient echo imaging (180/12) shows irregular high signal intensity lesion (arrow) at medial margin of right hepatic lobe, which was missed by one observer and was assigned confidence level of 2 by other observer during image interpretation.
B. Axial ferucarbotran-enhanced respiratory-triggered T2-weighted turbo spin echo imaging (4200/76) clearly shows small round hyperintense mass (arrow) at same location as in A. This was assigned score of 4 by both observers.
A B
Fig. 4. 55-year-old man with surgically confirmed 0.4-cm liver metastasis from colon cancer.
A. Axial ferucarbotran-enhanced breath-hold T2*-weighted gradient echo imaging (180/12) shows irregular high signal intensity lesion (arrow) in inferior portion of right hepatic lobe. Both reviewers missed this lesion during image interpretation.
B. Axial ferucarbotran-enhanced respiratory-triggered T2-weighted turbo spin echo imaging (4200/76) clearly shows small round hyperintense mass (arrow) at same location as in A. This was assigned score of 3 by both observers.
A B