Printed in the Republic of Korea
331
2-Hydroxy-3-methoxy Benzaldehyde Thiosemicarbazone
를 사용하여마이크로 그램 코발트
(II)
의 직접 및 유도 분광광도법에 의한 정량A. Praveen Kumar, P. Raveendra Reddy*, and V. Krishna Reddy
Department of Chemistry, Sri Krishnadevaraya University, Anantapur-515003 (A.P.) India (2007. 4. 26 접수)
Direct and Derivative Spectrophotometric Determination of Cobalt (II) in Microgram Quantities with 2-Hydroxy-3-methoxy Benzaldehyde
Thiosemicarbazone
A. Praveen Kumar, P. Raveendra Reddy*, and V. Krishna Reddy
Department of Chemistry, Sri Krishnadevaraya University,Anantapur-515003 (A.P.) India (Received April 26, 2007)
요 약. 분석시약으로 2-hydroxy-3-methoxy benzaldehyde thiosemicarbazone (HMBATSC)를사용하여코발트 (II) 정량을위하여빠르고간단하고민감한분광광도법을개발하였다. 액상에서금속이온이 pH 6.0에서 HMBATSC와
갈색의착물을형성하였다. 이착물은 375 nm와 390 nm에서두개의최대흡수피크를보였다. 375 nm에서많은흡
수를보였고, 반면 390 nm에서는분명한흡수를보이지않았다. Beer’s 법칙에서 Co(II)는 0.059-2.357µg ml-1범위를 보였다. 이방법의몰흡수와 Sandall’s 민감도는각각 2.74×10⁴ l mol-1 cm-1와 0.0024µg cm-2였다. 여러가지다른
이온들에간섭에대해서도연구하였다. 화학양론적으로착체는 1:2 [Co(II)- HMBATSC] 이였다. 이차유도분광광도
법에의한 Co(II)의정량방법에대해서도제안하였다. 제안된방법을 alloy steels, 비타민 B12와생물학시료에있는
Co(II)의정량에적용하였다.
주제어: 분광광도법, 코발트정량, HMBATSC
ABSTRACT. A rapid, simple and sensitive spectrophotometric method was developed for the determination of cobalt(II) using 2-hydroxy-3-methoxy benzaldehyde thiosemicarbazone (HMBATSC) as a analytical reagent. The metal ion in aqueous medium forms a brown coloured complex with HMBATSC at pH 6.0. The complex has two absorption maxima at 375 nm and 390 nm. At 375 nm, the reagent shows considerable absorbance, while at 390 nm the reagent does not shows appreciable absorbance. Hence, analytical studies were carried out at 390 nm. Beer’s law is obeyed in the range of 0.059-2.357µg ml-1 of Co(II). The molar absorptivity and Sandall’s sensitivity of the method are 2.74×10⁴ l mol-1 cm-1 and 0.0024µg cm-2 respectively. The interference of various diverse ions has been studied. The complex has 1:2 [Co(II)- HMBATSC] stoichiometry. A method for the determination of cobalt(II) by second order derivative spectrophotometry has also been proposed. The proposed methods were applied for the determination of cobalt(II) in alloy steels, vitamin B12 and in some biological samples.
Keywords: Spectrophotometry, Determination of cobalt, HMBATSC
INTRODUCTION
Cobalt alloys are used in some industrial prod- ucts because of their sufficient hardness and resis-
tivity against oxidation at high temperatures, for example, in the manufacturing of turbine blades and cutting tools. Cobalt-60 is used as an efficient radioactive tracer and an anti-cancer treatment
agent in medicine. Some cobalt compounds, such as vitamin B12 (cyanocobalamine), are imported for biological activities.1 Therefore, the determination of cobalt is valuable for the quality control of artifi- cial and biologically samples in a simple selective and sensitive manner.
A wide variety of techniques are available for spectrophotometric determination of cobalt(II). Sol- vent extraction spectrophotometry,2,3 spectrophoto- metric measurement after pre-concentration with solid polymeric sorbents, such as amberite XADs4,5 and polyurethane foams,6 spectrophotometric pro- cedures using low melting point extractant,7 simple spectrophotometry in aqueous solution,8 derivative spectrophotometry,9 flow injection based techniques8 and H-point standard addition method in miscelliz- ing solution have also been proposed.10 Some of these methods have disadvantages such as low sen- sitivity,11-15 long time consuming,16 limitation of pH,17,18 interference from some ions11,15,17-19 and diffi- cult condition for complex formation (about 80oC).20 In the present paper, a simple, rapid, non-extract- able, selective and sensitive method was reported for the spectrophtomeric determination of trace amounts of cobalt(II) by complexing with 2-hydroxy-3-meth- oxy benzaldehyde thiosemicarbazone (HMBATSC).
The reagent forms a brown coloured complex with cobalt(II) in acid medium in the pH range 5.0-7.0 and was stable for more than 72 hours. Hence, a systematic study has been made to develop a spec- trophotometric method for the determination of cobalt in alloy steels, vitamin B12 and in some bio- logical samples.
EXPERIMENTAL
The absorbance and pH measurements were made on a Shimadzu UV-visible spectrophotometer (Model UV-160A) fitted with 1 cm Quartz cells and Phillips digital pH meter (model L1 613) respectively.
REAGENTS
Preparation of 2-hydroxy-3-methoxy benzalde- hyde thiosemicarbazone (HMBATSC)
The reagent (HMBATSC) is prepared by the Sah and Daniels21 procedure. 11.25 g of 2-hydroxy-3- methoxy benzaldehyde (I) and. 4.55 g of thiosemi- carbazide (II) are dissolved in sufficient volume of methanol and the mixture is refluxed for 60 min- utes. The contents are allowed to cool and the prod- uct separated by filtration. A crude sample (yield 80%) is obtained (C9H11O2SN3). The resultant prod- uct is recrystallised twice from hot methanol. Pure light yellowish green crystals of 2-hydroxy-3-meth- oxy benzaldehyde thiosemicarbazone (HMBATSC) (III) (m.p. 220-222oC.) are obtained.
A 0.01 M solution of HMBATSC in dimethyl for- mamide (DMF) was employed in the present studies.
Stock solution of Co(II) (1×10⁻² M) is prepared by dissolving appropriate amount of Co(NO3)2. 6H2O in doubly distilled water containing a few drops of conc. HNO3 in a 100 ml volumetric flask and standardized gravimetrically.22
The working solutions were prepared daily by diluting the stock solution to an appropriate vol- ume. All other chemicals used were of analytical grade.
Buffer solutions
The buffer solutions were prepared by mixing 1 M hydrochloric acid and 1 M sodium acetate (pH 1.0-3.0) and 0.2 M acetic acid and 0.2 M sodium acetate (pH 3.5-7.0). The pH of these solutions was checked with a pH meter.
PREPARATION OF SAMPLE SOLUTIONS Alloy steels
A 0.1-0.5 g of steel sample was dissolved com- pletely in minimum amount of aquaregia by slow heating on sand bath and then heated to fumes of oxides of nitrogen. After cooling 5-10 ml of 1:1 H2O:H2SO4 mixture was added and evaporated to
dryness. Sulphuric acid treatment was reported three times to remove all the nitric acid. The resi- due was dissolved in 20 ml of distilled water and filtered and the filtrate was made up to 100 ml in a calibrated volumetric flask with distilled water. The sample solution was appropriately diluted to obtain the concentration in the required range.
Vitamin B12
A sample solution of vitamin B12 tablet was pre- pared by grinding 50 tablets of Basiton forte and transfer into a beaker. The powder was dissolved in minimum volume of alcohol, then added 3 ml of 0.01 M nitric acid and evaporated to dryness. The dried mass was again dissolved in alcohol. This was filtered through whatman filter paper and the fil- trate was diluted to 100 ml with distilled water. The lower concentrations were prepared by the appro- priate dilution of the stock solution.
Biological samples (Tea leaf and vehicle exhaust) The tea leaf samples were supplied by Andra- Pradesh Agricultural research institute (APARI), Hyderabad (A.P.) India. The vehicle exhaust sam- ple was collected from Environment protection training and research institute (EPTRI), Hyderabad (A.P.) India. A 0.1 g of tea leaf sample was taken in a beaker and dissolved in conc. nitric acid (≈5 ml) with heating. The solution was cooled, diluted and filtered. The filtrate was made up to 100 ml with water in a calibrated flask. Vehicle exhaust parti- cles (1 g) were dissolved in a mixture of 18 ml of conc. nitric acid, 18 ml of conc. perchloric acid and 2 ml of conc. hydrofluoric acid in a 100 ml teflon beaker, evaporated to a small volume, filtered through a filter paper and made up to 100 ml with distilled water.
Procedure
Direct spectrophotometry
In each of set of different 10ml volumetric flasks, 5 ml of buffer solution (pH 6.0), 1 ml of HMBATSC (8×10⁻³M) and various volumes of 1×10⁻⁴ M cobalt(II) solution were taken and made up to the mark with double distilled water. The absorbance was mea-
sured at 390 nm against the reagent blank. The cal- ibration plot was prepared by plotting the absorbance against the amount of cobalt(II).
Second order derivative spectrophotometry For the above solutions, second order derivative spectra were recorded with a scan speed of fast (nearly 2400 nm min-1); slit width of 1 nm with nine degrees of freedom, in the wavelength range 390-510 nm. The derivative amplitudes measured at wavelengths 414 nm and 452 nm and plotted against amount of cobalt(II) to obtain the calibration.
The calibration graph follows the straight line equation Y= a c + b; where c is the concentration of the solution, Y is measured absorbance or peak or valley height and a and b are constants. By substi- tuting the corresponding experimental data substi- tuted in the above equation, the calibration equations were calculated as A390=0.2383c+0.0259 for zero order method, A414=0.4034c+.00282 and A452= 0.3638c+0.0187 for second derivative method.
RESULTS AND DISCUSSION
2-hydroxy-3-methoxy benzaldehyde thiosemicar- bazone (HMBATSC) produced a brown coloured complex with HMBATSC in acidic buffer at pH 6.0.
Direct method
The absorption spectra of the solution containing Cobalt(II) complex against the reagent blank and that of the reagent solution against the correspond- ing buffer blank were recorded in the wavelength region 350 to 500 nm. Typical spectra are presented in Fig. 1. The spectra show that cobalt(II) complex has two absorption maxima at 375 nm and 390 nm.
At 375 nm, the reagent shows considerable absor- bance while at 390 nm the reagent does not show appreciable absorbance. Hence, 390 nm was chosen for further studies.
The study of the effect of pH on the colour intensity of the reaction mixture showed that the maximum colour was obtained in the pH range 5.0-7.0. Analyti- cal studies were therefore, carried out at pH 6.0.
A 20 fold molar excess of HMBATSC was nec- essary for complex and constant colour develop- ment. Excess of the reagent has no effect on the
absorbance of the complex. The absorbance of the complex solution was found independent of the order of the addition of the reactants.
The absorbance of the solution was measured at different time intervals to ascertain the time stabil- ity of the colour complex was observed that the colour development is instantaneous and remains constant for more than 72 hours.
For the possible determination of Cobalt(II) at micro levels, the absorbance of the solution con- taining different amounts of the metal ion was mea- sured. The linear plot between the absorbance and the amount of cobalt(II) is drawn and the straight line obeyed the equation A=0.3868C+0.0085. Fur- ther, Beer’s law was obeyed in the range of 0.059 to 2.357 µg ml -1. The molar absorptivity and Sand- ell’s sensitivity were 2.47×10⁴ lit mol-1 cm-1 and 0.0024 µg cm-2 respectively. The standard deriva- tion of the method for ten determinations of 1.18
µg ml-1 is ± 0.0052.
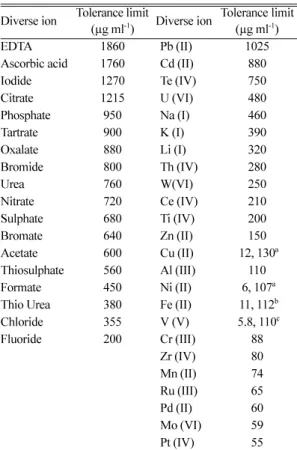
Effect of foreign ions
The effect of various foreign ions that are gener- ally associated with cobalt(II) on its determination under optimum conditions developed was studied and the results are presented in Table 1.
Among the various ions studied, all the anions and the cations Pb(II), Cd(II), Te(IV), U(VI), Na(I),
K(I), Li(I), Th(IV), W(VI), Ce(IV), Ti(IV), Zn(II) and Al(III) do not interfere even when present in more than 100 fold excess. Cr(III), Zr(IV), Mn(II), Ru(III), Pd(II), Mo(VI) and Pt(IV) are tolerable when present between 50-90 fold excess. Cu(II) and Fe(II) interfere when present in more than 10- fold excess, Ni(II) and V(V) interfere when present in more than 5-fold excess. However, in the pres- ence of 1860 µgof EDTA, Cu(II) and Ni(II) do not interfere even in 100-fold excess. Fe(II) is tolerable up to 90-fold excess in presence 1270 µg of iodide.
In presence of 950 µg of phosphate, V(V) is tolera- ble up to 100 fold excess.
Composition and stability of the complex The stoichiometry of the complex was determined by Job’s method (Fig. 2) and molar ratio method and found to be 1:1 (metal : reagent). The stability
Fig. 1. Absorption spectra of (a) HMBATSC Vs Buffer blank, (b) [Co(II)-HMBATSC] Vs reagent blank [Co(II)] = 2
×10-5 M; [HMBATSC] = 4×10⁻⁴ M; pH = 6.0.
Table 1. Tolerance limit of foreign ions Amount of Co(II) = 1.18 µg ml -1
Diverse ion Tolerance limit (µg ml-1) Diverse ion Tolerance limit (µg ml-1)
EDTA 1860 Pb (II) 1025
Ascorbic acid 1760 Cd (II) 880
Iodide 1270 Te (IV) 750
Citrate 1215 U (VI) 480
Phosphate 950 Na (I) 460
Tartrate 900 K (I) 390
Oxalate 880 Li (I) 320
Bromide 800 Th (IV) 280
Urea 760 W(VI) 250
Nitrate 720 Ce (IV) 210
Sulphate 680 Ti (IV) 200
Bromate 640 Zn (II) 150
Acetate 600 Cu (II) 12, 130a
Thiosulphate 560 Al (III) 110
Formate 450 Ni (II) 6, 107a
Thio Urea 380 Fe (II) 11, 112b
Chloride 355 V (V) 5.8, 110c
Fluoride 200 Cr (III) 88
Zr (IV) 80
Mn (II) 74
Ru (III) 65
Pd (II) 60
Mo (VI) 59
Pt (IV) 55
In the presence of a) 1860 µg of EDTA; b) 1270 µg of iodide;
c) 950 µg of Phosphate.
constant was determined by Job’s method as 6.719 x 10¹¹.
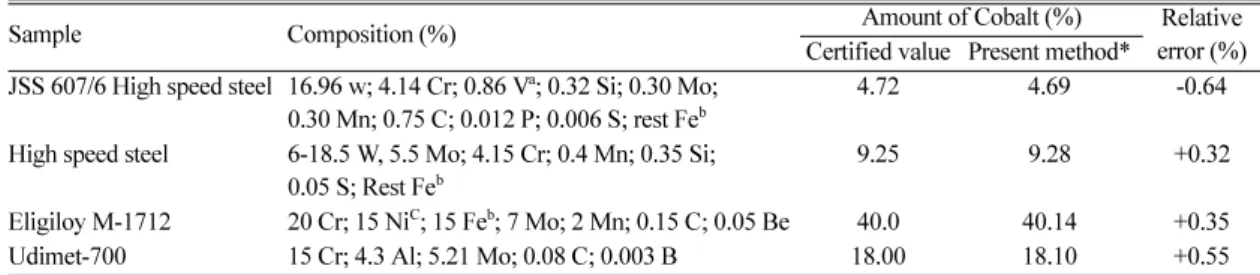
Applications
The present method was applied for the determi- nation of Co(II) in alloy steels, vitamin B12 and bio- logical samples.
Alloy steels
To known aliquots of the sample solutions were taken in different 10 ml volumetric flasks, 5 ml of buffer solution (pH 6.0), 950 µg of phosphate (to mask vanadium), 1270 µg of iodine (to mask Fe(II)) and 1860 µg of EDTA (to mask Ni(II)) and 1ml of HMBATSC (8×10⁻³ M) were added to each flask.
The contents were made up to the mark with dis- tilled water and the absorbance was measured at 390 nm. The amount of cobalt was calculated from a predetermined calibration plot and is given in
Table 2.
Vitamin B12
To known aliquots of the sample solutions were taken in different 10ml volumetric flasks, 5 ml of buffer solution (pH 6.0) and 1ml of HMBATSC (8×10⁻³ M) were added to each flask. The contents were made up to the mark with distilled water and the absorbance was measured at 390 nm. The amount of cobalt was calculated from a predetermined cali- bration plot and is given in Table 3.
Biological samples (Tea leaf and vehicle exhaust) An aliquot (10-50 ml) of the sample solution (procedure as described above) was taken individu- ally and cobalt was determined from predetermined calibration plot. The results are presented in Table 4.
Fig. 2. Job’s curve [Co(II)] = [HMBATSC] = 1×10⁻³M;
Wavelength = 390 nm; pH = 6.0.
Table 2. Determination of cobalt in alloy steel samples
Sample Composition (%) Amount of Cobalt (%) Relative
error (%) Certified value Present method*
JSS 607/6 High speed steel 16.96 w; 4.14 Cr; 0.86 Va; 0.32 Si; 0.30 Mo;
0.30 Mn; 0.75 C; 0.012 P; 0.006 S; rest Feb 4.72 4.69 -0.64 High speed steel 6-18.5 W, 5.5 Mo; 4.15 Cr; 0.4 Mn; 0.35 Si;
0.05 S; Rest Feb 9.25 9.28 +0.32
Eligiloy M-1712 20 Cr; 15 NiC; 15 Feb; 7 Mo; 2 Mn; 0.15 C; 0.05 Be 40.0 40.14 +0.35
Udimet-700 15 Cr; 4.3 Al; 5.21 Mo; 0.08 C; 0.003 B 18.00 18.10 +0.55
*= Average of five determinations; a = masked with 950 µg of phosphate; b = masked with 1270 µg of iodide; c = masked with 1860 µg of EDTA.
Table 3. Determination of cobalt in vitamin B12 tablet Sample and composition
(mg/tablet)
Amount of cobalt (µgml-1) Relative
error (%) methodAAS Present
method*
BASITON FORTE Thiamino mononitrate(B1) Riboflavine (B2) Pyridoxime hydrochloride Nicacinamide
Cyanocobalamine Folic acid
Calcium pentathenate Sodium ascarbate
: 10 : 10: 3 : 100 : 15: 1.5 : 50: 150
7.42 7.45 +0.40
*Average of five determinations
Table 4. Analysis of cobalt in biological samples
Sample Amount of cobalt (mg/g)
Certified value Present method*
Tea leaves 0.12 ± 0.008 0.110 ± 0.08 Vehicle exhaust 3.3 ± 0.30 3.15 ± 0.3
*Average of five determinations
Second order derivative method
The second order derivative curves recorded (Fig. 3) for experimental solutions showed the derivative amplitudes were measured at 414 nm (valley) and 452 nm (peak) for different concentrations of Co(II) and plots were made between the amount of Co(II) and the derivative amplitude. The plots were linear and obeyed Beer’s law in the range 0.030-3.535
µg ml-1 and 0.059-3.535 µgml-1 at 414 nm, 452 nm respectively.
Effect of foreign ions
The effect of various cations and anions on the derivative amplitude was studied and it was noticed that all the ions that did not interfere in the zero order determinations of Co(II) also did not inter- fere in second order derivative method. The metal ions Cu(II) and Fe(II) were interfered in 10-fold excess, Ni(II) and V(V) were interfered in 5-fold excess in zero order method, but in second order deriv- ative method. Cu(II) and Fe(II) were tolerable up to 25 fold excess. Further, V(V) and Ni(II) were interfere 5- fold excess in second order derivative method.
APPLICATIONS Analysis of alloys and steels
A known aliquot of the sample solution was taken in a 10 ml volumetric flask containing 5 ml of buffer solution (pH 6.0) and 950 µg ml-1 of phos- phate (to mask V(V)) and 1ml of HMBATSC (8×10⁻³ M) solution. The contents of the flask were made up to the mark with distilled water. The sec- ond derivative spectrum of the solution was recorded The derivative amplitude at 452 nm was measured and the amount of cobalt(II) was com- puted from the predetermined calibration plot and presented in Table 5.
Fig. 3. Second derivative spectra of Co(II) – HMBATSC Vs reagent blank Co(II) (µg ml-1) = (1) 0.2357; (2) 0.4714; (3) 0.7071; (4) 0.9428.
Table 5. Determination of Cobalt(II) in alloy steel samples
Sample Certified valueAmount of cobalt (%)Present method* Relative error (%)
High speed steela 9.25 9.30 0.54
BCS-483b 1.94 1.91 -1.54
JSS-607-6C (High speed steel) 4.72 4.76 0.85
*Average of five determinations. a: 9.25% Co; 0.40% Mn; 0.35% Si; 0.05% S; 0.05% P; 5.50% Mo; 6-18.5% W; 4.15% Cr, Rest Fe. b: 10.8% W; 3.21% Cr; 0.54% Vx ; 0.29% Mn; 0.17% Mo; 1.94% Co; Rest Fe. c: 16.96%W; 4.14% Cr; 0.86% Vx; 0.32% Si; 0.30% Mo; 0.30% Mn; 0.75% C, 0.012% P; 0.006% S; 4.72% Co; Rest Fe. x = masked with 950 mg of phosphate.
Table 6. Comparison of results of Co(II)
Parameter Zero order second derivative
Analytical wave length (nm) 390 414 452
Beer’s law range (µgml-1) 0.059-2.357 0.030-3.535 0.059-3.535
Angular coefficient (m) 0.3933 0.4034 0.3638
Y-intercept (b) 0.0013 0.0282 0.0187
Correlation coefficient (r) 0.9998 0.9997 0.9995
Standard deviation (s) ±0.0052 0.0118 0.0157
Comparison of results
The analytical characteristics of the zero and sec- ond order derivative methods in the present investi- gations for Co(II) were compared and presented in
Table 6. The results in this table reveal that second order derivative method is more sensitive and selec- tive than the zero order method.
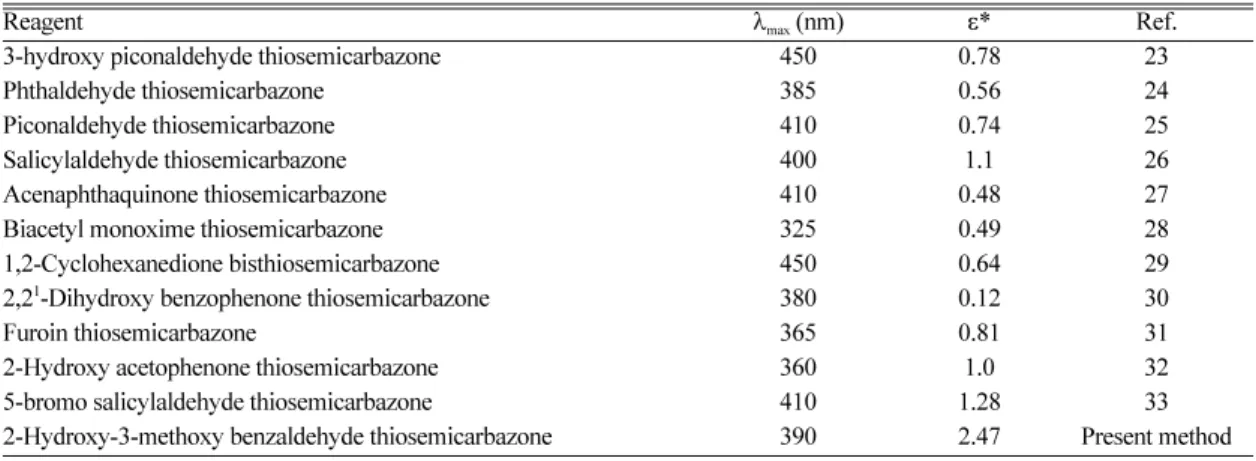
The sensitivity of the zero order method in the present investigations was compared with those of some reported methods and presented in Table 7.
The proposed method if found to be more sensitive than the reported methods.
REFERENCES
1. Daintith, “Oxford dictionary of chemistry”, Oxford Uni- versity press, Oxford, 123, 1996.
2. Barakat, S. A.; Rusan, M.; Burns, D. T. Anal. Chim.
Acta1977, 335, 163.
3. Shima, C.; Nukatula, I.; Ohzenki, K. Anal. Sci. 1998, 14, 337.
4. Sakai, Y.; Mori, N. Talanta, 1986, 33, 161.
5. Yang, G.; Dong, X.; Hu, Q.; Yin, J. Anal. Lett. 2002, 35, 1735.
6. Carvalho, M.S.; Fraga, I.C.S.; Neto, K.C.M.; Silva Filo, E. Q. Talanta, 1996, 43, 1675.
7. Taher, M. A. Anal. Sci. 2000, 16, 501.
8. Themelis, D. G.; Zachariadis, G. A.; Stratis, J. A. Analyst,
1995, 19, 1593.
9. Eskandari, H.; Ghanbari Seghseloo, A. Anal. Sci.,
2003, 19, 1513.
10. Eskandari, H.; Bagherian Dehaghi, G. H. Mikrochim.
Acta, 2004.
11. Kamburova, K. C.; Kumar, A.; Rajeev, P.; Rajeev, S.
Asian J. Chem. 1993, 5, 559.
12. Kamburova, M.; Alexandov, A.; Trifonov,K. Anal. Chem.
1994, 39, 639.
13. Appandoo, C.; Bhagwat, V. W. Talanta, 1994, 6, 703.
14. Shen, H.; Tang, Y.; Xio, X.; Zang, S.; Liu, R. Analyst,
1995, 120, 1599.
15. Sharma, R.; Dava, D. P. Indian J. Chem., 1997, 35A, 16. Puscal, R.; Lasser, E.; Katzengruber, K. 629. Anal. Chem.
1966, 223, 414.
17. Dasilva, J.; Martins, W. Talanta, 1992, 39, 1307.
18. Maheswari, V.; Balasubramanyan, N.; Fresenius, Z.
Anal. Chem., 1995, 351, 333.
19. Carvalho, M. S.; Frago, I. C. S.; Mateus, K. C. M.;
Nato, S.; Filo, E. Q. Talanta, 1996, 43, 1675.
20. Jadhav, S. B.; Utekar, S. S.; Kulkarni, A. J.; Varadara- jan, A.; Malve, S. P.; Talanta, 1998, 46, 1425.
21. Sah, P. T.; Daniels, T. C. REV. TRAV. KIM; 1950, 69, 1945.
22. Vogel, A. I. A Text book of Quantitative Inorganic Analysis, 4th Edn., ELBS and Longman, p. 460, 1985.
23. Pavon, J. M. C.; Levado, A.; Pino, F. Mikrochim. Acta,
1976, 11, 233.
24. Rueda, M. R.; Leyva, J. M. M. J. Antonoi, Quim. Anal.
1975, 29, 122.
25. Reddy, N. S., Ph. D. Thesis, Sri Krishnadevaraya Uni- versity, India, 1982.
26. Pavon, J. M. C.; Bendito, D. P.; Pino, F., Quim. Anal.
1969, 65, 667.
27. Singh, S. K. Kamani, Sindhwani, J. Chtu. Chem. Soc., (Taipei) 1982, 29, 31.
28. Benedito, D. P.; Pino, F. Inform Quim. Anal. 1967, 21, 31 (Anal. abstr. 1968, 15, 3342).
Table 7. Comparison with other methods
Reagent λmax (nm) ε* Ref.
3-hydroxy piconaldehyde thiosemicarbazone 450 0.78 23
Phthaldehyde thiosemicarbazone 385 0.56 24
Piconaldehyde thiosemicarbazone 410 0.74 25
Salicylaldehyde thiosemicarbazone 400 1.1 26
Acenaphthaquinone thiosemicarbazone 410 0.48 27
Biacetyl monoxime thiosemicarbazone 325 0.49 28
1,2-Cyclohexanedione bisthiosemicarbazone 450 0.64 29
2,21-Dihydroxy benzophenone thiosemicarbazone 380 0.12 30
Furoin thiosemicarbazone 365 0.81 31
2-Hydroxy acetophenone thiosemicarbazone 360 1.0 32
5-bromo salicylaldehyde thiosemicarbazone 410 1.28 33
2-Hydroxy-3-methoxy benzaldehyde thiosemicarbazone 390 2.47 Present method
ε*=104 L mol-1 cm-1
29. Leyva, J. A. M., Pavon, J. M. C. Pino, F. Quim. Anal.
1974, 28, 90 (Anal. abstr. 1974, 27, 3279).
30. Torbio, F.; Fernandez, J. M. L.; Bendito, D. P.; Valcar- cel, M. Microchem J., 1980, 25, 338.
31. Bhaskare, C. K.; Kulkarni, S. V.; Ganage, K. N.; Surekha, D. J. Indian Chem. Soc., 1978, 55,199.
32. Murthy, G. V. R.; Reddy, T. S. Chim. Acta, 1989, 17, 33. Ramanjaneyulu, G.; Raveendra Reddy, P.; Kirshna, V.189.
Reddy, T. Sreenivasulu Reddy, J. Indian Chem. Soc.,
2003, 80, 773.