ISSN 2234-3806 • eISSN 2234-3814
https://doi.org/10.3343/alm.2019.39.4.411 www.annlabmed.org 411
Ann Lab Med 2019;39:411-413
https://doi.org/10.3343/alm.2019.39.4.411
Letter to the Editor
Clinical Chemistry
A Multiplex Phytosterol Assay Utilizing Gas
Chromatography-Mass Spectrometry for Diagnosis of Inherited Lipid Storage Disorders
Joon Hee Lee, M.D.1,2, Kyunghoon Lee, M.D.1,3, Sun-Hee Jun, M.T.3, Sang Hoon Song, M.D.1,2, Choong Ho Shin, M.D.4, and Junghan Song , M.D.1,3
1Department of Laboratory Medicine, Seoul National University College of Medicine, Seoul, Korea; 2Department of Laboratory Medicine, Seoul National University Hospital, Seoul, Korea; 3Department of Laboratory Medicine, Seoul National University Bundang Hospital, Seongnam, Korea; 4Department of Pediatrics, Seoul National University Children’s Hospital, Seoul, Korea
Dear Editor,
Levels of phytosterols, including plant sterols and stanols, are increased in lipid storage disorders such as cerebrotendinous xanthomatosis (CTX) and sitosterolemia. Both are autosomal re- cessive diseases with heterogeneous clinical manifestations, such as tendon xanthoma, cataracts, and progressive neurologic ab- normalities. Decreased bile acid synthesis in CTX leads to the accumulation of cholestanol [1], whereas increased intestinal absorption and decreased biliary excretion in sitosterolemia lead to increased sitosterol and campesterol levels [2]. If appropri- ately treated, the outcomes of both diseases can dramatically improve. However, it is difficult to measure phytosterol levels us- ing standard diagnostic assays. For example, enzymatic colo- rimetry, based on the reaction with a C-5 double bond or the presence of a 3β-hydroxyl group, cannot differentiate between cholesterol and phytosterols because these groups are present in both sterol types [3, 4]. Among the methods that can prop- erly measure phytosterol levels, mass spectrometry (MS) is deemed superior because of its high analytical sensitivity and specificity.
We developed and evaluated a triplex phytosterol assay utilizing gas chromatography (GC-MS). The study was approved by the
Institutional Review Board of Seoul National University Hospital and Seoul National University Bundang Hospital (E-1901-001- 998).
Ten microliters of serum and 60 µL of working internal stan- dard (IS) (10 mg/L epicoprostanol in 90% ethanol) were mixed in glass tubes. One milliliter of 4% potassium hydroxide in 90%
ethanol was added, and the mixture was incubated at 65°C for 60 minutes. Liquid-liquid extraction was performed thrice: the sample was mixed with 1 mL distilled water and 2 mL hexane, centrifuged at 54×g for 7 minutes, and subjected to superna- tant extraction. After drying with nitrogen gas, 100 μL of bis (tri- methylsilyl) trifluoroacetamide and 10% trimethylchlorosilane (Regis Technologies, Inc., Morton Grove, IL, USA) were added, and the sample was incubated at 65°C for 60 minutes. Then, the sample was introduced into the GC-MS system: an HP 6890N gas chromatograph coupled to an HP 5975 mass spec- trometer (Agilent Technologies, Santa Clara, CA, USA) with an HP-5MS capillary column (30 [L] ×0.25 mm [i.d.], 0.25 μm [film thickness], Agilent Technologies). The column temperature gradient was programmed from 150°C (hold for 2 minutes) to 270°C at 30°C/minutes, to 290°C at 10°C/minutes (hold for 7
Received: September 2, 2018 Revision received: October 27, 2018 Accepted: January 15, 2019
Corresponding author: Junghan Song, M.D.
https://orcid.org/0000-0003-0576-9938
Department of Laboratory Medicine, Seoul National University Bundang Hospital, 82 Gumi-ro 173beon-gil, Bundang-gu, Seongnam 13620, Korea Tel: +82-2-2228-2442, Fax: +82-2-364-1583, E-mail: [email protected]
© Korean Society for Laboratory Medicine
This is an Open Access article distributed under the terms of the Creative Commons Attribution Non-Commercial License (http://creativecommons.org/licenses/by-nc/4.0) which permits unrestricted non-commercial use, distribution, and reproduction in any medium, provided the original work is properly cited.
1 / 1 CROSSMARK_logo_3_Test
2017-03-16 https://crossmark-cdn.crossref.org/widget/v2.0/logos/CROSSMARK_Color_square.svg
Lee JH, et al.
Multiplex phytosterol assay utilizing GC-MS
412 www.annlabmed.org https://doi.org/10.3343/alm.2019.39.4.411 minutes), to 300°C at 10°C/minutes (hold for 2 minutes). Quan-
titative data were obtained by selected ion monitoring (m/z 306, 343, 357, and 370 for cholestanol, sitosterol, campesterol, and IS, respectively), and the three phytosterols and IS were clearly separated by GC-MS.
Various parameters of analytical performance, such as impre- cision, linearity, lower limit of detection (LLOD) and quantification (LLOQ), ion suppression, recovery, and carryover effect, were evaluated for the assay. Within-run imprecision determined by five replicated analyses and between-run imprecision measured on five consecutive days were below 10.9% of CV for all com- pounds. According to the EP06-A CLSI guidelines [5], reproduc- ible linearity was observed at five concentrations (0, 50, 100, 150, and 200 mg/L) for each phytosterol (r2>0.999). The LLOD and LLOQ were determined as the lowest concentration with a sig- nal-to-noise ratio >3.0 and the lowest concentration with a pre- cision <20% and accuracy <20%, respectively. The absolute matrix effect (ME) and recovery and process efficiencies were quantitatively analyzed according to the protocol by Matuszewski et al. [6], and were acceptable in all three phytosterols. The afore- mentioned results are depicted in Table 1. Furthermore, carry- over was evaluated by injecting a reconstitution solvent blank immediately after the upper limit of quantification (ULOQ) of the standard curve. No significant carryover was observed; all con- centrations of the solvent blank were <20% of the LLOQ.
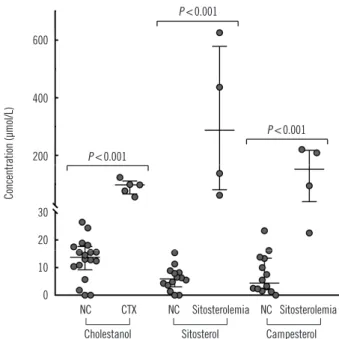
Phytosterol levels in serum samples of patients with CTX (N=
5) and sitosterolemia (N=4) were compared with that in serum samples from normal controls (N=18; Fig. 1). Cholestanol level was higher in CTX patients (median [lower-upper quartile], 98.4 [77.7–99.5] μmol/L) than in normal controls (13.7 [10.5–17.0]
μmol/L). Likewise, sitosterol and campesterol levels were higher in sitosterolemia patients (287.3 [119.1–483.9] μmol/L for sitos- terol and 152.1 [77.1–211.9] μmol/L for campesterol) than in normal controls (5.9 [3.8–8.1] μmol/L for sitosterol and 4.4 [2.3–
12.4] μmol/L for campesterol).
No consensus has been reached on the true prevalence of
CTX and sitosterolemia, with the latest reports estimating the prevalence as 5/100,000 [7] and <1/1,000,000 [8], respec- tively. Because of the low frequency of pediatric lipid testing and the difficulty in measuring phytosterol levels, these disorders are prone to underdetection [9, 10]. Though not pathognomonic, cholestanol and sitosterol are biomarkers for CTX and sitosterol- emia, respectively.
One limitation of our study is the small sample size; the rarity of CTX and sitosterolemia makes it difficult to obtain the desir- able sample numbers. However, our triplex phytosterol assay by GC-MS showed excellent analytical performance and can be utilized in the clinical laboratory for diagnosing inherited lipid stor- age disorders. In conjunction with earlier screening, this would ultimately lead to better disease outcomes.
Table 1. Analytical performance of the GC-MS assay for three phytosterols Within-run
imprecision (%) Between-run
imprecision (%) ME
(%) Recovery
(%) PE
(%) LLOD
(μmol/L) LLOQ (μmol/L)
Low High Low High Low High Low High Low High
Cholestanol 2.13 0.82 8.64 4.92 150.8 118.7 90.0 80.2 135.8 95.2 0.3 6.8
Sitosterol 4.37 2.57 7.32 9.06 119.0 107.4 94.9 83.5 112.9 89.7 0.2 12.1
Campesterol 1.64 1.16 10.94 10.23 114.8 103.3 95.5 82.2 109.6 84.9 0.3 7.5
Abbreviations: ME, matrix effect; PE, process efficiency; LLOD, lower limit of detection; LLOQ, lower limit of quantification; GC-MS, gas chromatography- mass spectrometry.
Fig. 1. Comparison of phytosterol levels between NCs (N=18) and patients with CTX (N=5) and sitosterolemia (N=4). The outer hori- zontal lines at both ends depict the upper and lower quartile values, and the middle horizontal line depicts the median. P value was cal- culated using the Mann–Whitney U test.
Abbreviations: NC, normal control; CTX, cerebrotendinous xanthomatosis.
7
Fig. 1. Comparison of phytosterol levels between NCs (N = 18) and patients with CTX (N = 5) and sitosterolemia (N = 4). The outer horizontal lines at both ends depict the upper and lower quartile values, and the middle horizontal line depicts the median. P value was calculated using the Mann–Whitney U test.
Abbreviations: NC, normal control; CTX, cerebrotendinous xanthomatosis.
600
400
200
Concentration (µmol/L)
30 20 10 0
NC CTX Cholestanol
NC Sitosterolemia Sitosterol
NC Sitosterolemia Campesterol P <0.001
P <0.001
P <0.001
Lee JH, et al.
Multiplex phytosterol assay utilizing GC-MS
https://doi.org/10.3343/alm.2019.39.4.411 www.annlabmed.org 413
Authors’ Disclosures of Potential Conflicts of Interest
No potential conflicts of interest relevant to this article were re- ported.
Acknowledgment
This study was supported by a grant from the Korea Health Tech- nology R&D Project, Ministry of Health and Welfare, Republic of Korea (A120030).
REFERENCES
1. Kuriyama M, Fujiyama J, Kasama T, Osame M. High levels of plant ste- rols and cholesterol precursors in cerebrotendinous xanthomatosis. J Lipid Res 1991;32:223-9.
2. Yoo EG. Sitosterolemia: a review and update of pathophysiology, clinical spectrum, diagnosis, and management. Ann Pediatr Endocrinol Metab 2016;21:7-14.
3. Kidambi S and Patel SB. Sitosterolaemia: pathophysiology, clinical pre- sentation and laboratory diagnosis. J Clin Pathol 2008;61:588-94.
4. Escola-Gil JC, Quesada H, Julve J, Martin-Campos JM, Cedo L, Blanco- Vaca F. Sitosterolemia: diagnosis, investigation, and management. Curr Atheroscler Rep 2014;16:424.
5. CSLI. Evaluation of the linearity of quantitative measurement procedures:
a statistical approach; approved guideline. CLSI document EP06-A. Wayne, PA: Clinical and Laboratory Standards Institute. 2003.
6. Matuszewski BK, Constanzer ML, Chavez-Eng CM. Strategies for the assessment of matrix effect in quantitative bioanalytical methods based on HPLC-MS/MS. Anal Chem 2003;75:3019-30.
7. Lorincz MT, Rainier S, Thomas D, Fink JK. Cerebrotendinous xantho- matosis: possible higher prevalence than previously recognized. Arch Neurol 2005;62:1459-63.
8. Patel SB. Sitosterolemia and other rare sterol disorders. In: Garg A, ed.
Dyslipidemias: pathophysiology, evaluation and management. 1st ed.
New York: Humana Press, 2015:235-50.
9. Lee MH, Lu K, Patel SB. Genetic basis of sitosterolemia. Curr Opin Li- pidol 2001;12:141-9.
10. Park JH, Chung IH, Kim DH, Choi MH, Garg A, Yoo EG. Sitosterolemia presenting with severe hypercholesterolemia and intertriginous xantho- mas in a breastfed infant: case report and brief review. J Clin Endocrinol Metab 2014;99:1512-8.