The Influence of Cooling on Muscle Force and Viscoelastic Properties of Human Tendon Structures in Vivo
Su-dong Chae, M.Sc.
Dept. of Health and Sport Science, Graduate School, Nippon Sport Science University Myeong-soo Jung
Kyung-il Lee, Ph.D.
Dept. of Physical Education, Chosun University Akira Horii, Ph.D.
Dept. of Health and Sport Science, Graduate School, Nippon Sport Science University
Abstract
1)This study was to investigate the influence of cooling on muscle force and viscoelastic properties of tendon structures in themedial gastrocnemius (MG) muscle. The subject was instructed to gradually in- crease force (10% MVC step) from a relaxed state to MVC within 3 s. At this time, it was measured by an ultrasonographic probe was attached and that an electrode was attached to monitor EMG. The F val- ues at 50~100% of MVC were significantly greater under the cold condition than under the non-cold condition (p<.05). The ΔF/ΔL values at 80~100% of MVC were significantly higher under the cold con- dition than under the non-cold condition (p<.05). The elongation under the non-cold condition had a ten- dency to be greater than that under the cold condition. The results suggest that cooling results in an in- crease in the stiffness of tendon structures with a reduction of muscle force and elongation.
Key Words: Cooling; Tendon elasticity; Ultrasonography.
Introduction
Cooling has been generally observed to cause a decrease in muscle force (Bigland-Ritchie et al, 1992;
Comeau et al, 2003; Davies and Young, 1983;
Edward et al, 1972; Faulkner et al, 1990; Howard et al, 1994; Sargeant, 1987). Maximum force decreases significantly with cooling below 25℃ for human muscle in vivo (Edward et al, 1972). The mechanism responsible for the decrease in maximum force and the rate of force development with a decrease in temperature has not yet been identified.
The maximal force that a muscle can exert has been shown to be highly correlated with its tendi- nous tissues (tendon and aponeurosis) and motor units. A very important, yet scarcely investigated factor in the performance of all functional activities
is the tendon. The tendon-aponeurosis complex is responsible for the transmission of contractile forces from muscle to bone, allowing movement to occur.
There is actually a possibility that the function of a tendon-aponeurosis complex may decrease with cooling. There have been reports in the literature that the stiffness of a muscle increases by cooling (Asmussen et al, 1976; Hunter et al, 1952;
Ranatunga, 1982; Wiles and Edwards, 1982), and moreover, upon cooling, it was reported that the stiffness of a hand tendon increased (Hunter and Whillans, 1951).
However, these previous studies did not take measurements in vivo. Muscle fibres not only trans- mit force to tendons, but also interact with them as a result of tendon compliance. Therefore, to identify the functional characteristics of human muscle fibre and tendon-aponeurosis complex during movement,
Corresponding author: Su-dong Chae [email protected]
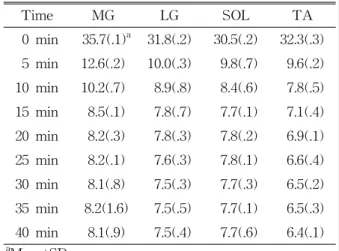
Time MG LG SOL TA 0 min 35.7(.1)a 31.8(.2) 30.5(.2) 32.3(.3) 5 min 12.6(.2) 10.0(.3) 9.8(.7) 9.6(.2) 10 min 10.2(.7) 8.9(.8) 8.4(.6) 7.8(.5) 15 min 8.5(.1) 7.8(.7) 7.7(.1) 7.1(.4) 20 min 8.2(.3) 7.8(.3) 7.8(.2) 6.9(.1) 25 min 8.2(.1) 7.6(.3) 7.8(.1) 6.6(.4) 30 min 8.1(.8) 7.5(.3) 7.7(.3) 6.5(.2) 35 min 8.2(1.6) 7.5(.5) 7.7(.1) 6.5(.3) 40 min 8.1(.9) 7.5(.4) 7.7(.6) 6.4(.1)
aMean±SD.
Table 1. Before and after cooling differences for the MG, LG, SOL, and TA at each environmental tem- perature
we need to measure directly and successively their in vivo geometric arrangements.
Recent progress in technology has made it possible to study the dynamics of the muscle-tendon complex in vivo with the use of ultrasonography (Ito et al, 1998;
Kawakami et al, 1998; Kubo et al, 1999; Maganaris and Paul, 1999). Using ultrasonography, the tendon struc- tures under cooling can be checked in real time.
Because the stiffness of a tendon-aponeurosis complex increases by cooling, it is also expected that cooling affects tendinous tissue. The purpose of this study was to investigate the influence of cooling on muscle force, and the viscoelastic properties of ten- don structures in the medial gastrocnemius muscle.
Methods
Subjects
The subjects of this study were eight healthy men (age 24.3±3.7 yrs, height 170.3±8.2 ㎝, weight 71.2±4.6
㎏). All subjects were volunteers; they were informed of the potential risks and benefits of testing protocols and gave their written consent to participate.
Experimental protocol
Before the experimental session, each subject per- formed two maximal isometric contractions to enable us to obtain an average value of maximal voluntary contraction (MVC). The leg for measuring was chos- en at random. The subject was instructed to gradu- ally increase force (10% MVC step) from a relaxed state to MVC within 3 s. At this time, it was meas- ured by an ultrasonographic probe was attached and that an electrode was attached to monitor EMG. A thermistor was attached to measure skin temperature.
In this study, data obtained by serial measurement provided control values. Data for each subject was obtained under cold and non-cold conditions, re- spectively, and measurements of various parameters of the left or right leg, chosen randomly, were taken.
The subjects were subjected the same control measure- ments for skin cooling conditions one week later.
Skin Temperature Measurement2)
Cooling was conducted on the surface skin of whole calf muscle by applying three ice packs for 40 min. The skin surface was cooled for 30 min during the rest period while measurements were being tak- en, and for 10 minutes during the plantar flexion ex- ercise (Table 1). Skin temperature was measured us- ing skin thermistors1) attached to the skin with ad- hesive tape at four sites: the medial gastrocnemius (MG), lateral gastocnemius (LG), soleus (SOL), and tibialis anterior (TA). These temperatures were re- corded at 2 s intervals using a data logger. The average skin surface temperature was derived from the values during the rest period and those during the plantar flexion exercise. The calculation method averaged data recorded at intervals of 2 seconds over increments of 5 minutes.
1) LT-8, Gram, Japan.
Figure 1. Ultrasonic images of longitudinal sections of medial gastrocnemius (MG) muscle during isometric contraction. The cross-point (P) was determined from the ultrasonography echoes of the deep aponeurosis and facicles. P moved proximally during isometric torque development from rest (P1) to 100% MVC (P2). The distance traveled by P (L) was defined as the length of change of the tendon and aponeurosis during contraction.
Joint Position Settings and Torque Measurements3)
A biodex system2) was used to fix the ankle joint and to measure the plantar flexion torque. Each sub- ject was seated on a test bench of a Biodex System 3 with a backrest, and secured by straps around the waist, chest, and right and left footplate. The center of rotation of the Biodex was visually aligned with the center of the rotation of the ankle joint. The foot was fixed at a neutral anatomic position, where the sole of the foot was at 0 degrees to the tibia. Prior to the test, the subject performed a standardized warm-up and sub maximal contractions to become accustomed to the test procedure. The subject was instructed to gradually increase force (measuring MVC 10~100%) from a relaxed state to maximal voluntary contraction (MVC) within 3 s. Torque sig- nals were A/D converted at a sampling rate of 1 ㎑ (MacLab, AD instrument), and analyzed by a PC3).4)
Measurement of the Aponeurosis Elongation Longitudinal ultrasound images were recorded in the medial gastrocnemius muscle using an Aloka SSD-1000 real-time scanner with a 7.5 ㎒ linear array transducer. To evaluate the elongation of the super- ficial aponeurosis along with position-dependent length change, movements at the following two points were recorded by ultrasonography: P1 and P2 (Figure 1).
Any movement of the line cast by the external marker on the ultrasound image indicated movement of the transducer with respect to the scanned struc- ture and trial would therefore be omitted from any further analysis. Measurements of displacement were analyzed at 10% intervals of maximal torque, using the public domain scion image program. The meas- ured torque (TQ) during isometric plantar flexion was converted of muscle force (Fm) by the following equation: Fm = k·TQ / MA
where k is the relative contribution of the physio- logical cross-sectional area of MG within the plantar flexor muscles, and MA is the moment arm of the triceps surae muscles at 0° of the ankle joint.
2) model Biodex System 3, Sakai, Tokyo, Japan.
3) PowerbookG3, Apple, Tokyo, Japan.
Measurements of muscle cross-sectional area.
Measurements of gastrocnemius muscle cross-sec- tional area (CSA) were carried out by magnetic res- onance imaging scans4). T1-weighted spin-echo, ax- ial-plane imaging was performed with the following parameters: TR 850 ㎳, TE 25 ㎳, matrix 256×256, field-of-view 320 ㎜, slice thickness 10 ㎜, and in- terval slice 10 ㎜. The number of sections obtained for each subject was 32~36. The muscles inves- tigated were the m. medial gastrocnemius (MG), m.
lateral gastocnemius (LG), and m. soleus (SOL).
From the axial image, outlines of each muscle were transferred, and the transferred images were ana- lyzed ona vaio computer5) for calculation of the CSA using the public domain scion image program.
Measurement of the EMG5)6)7)8)
The EMG activity was recorded during the iso- metric contraction, and under cold and non-cold con- ditions, respectively. Single differential electrodes (10
㎜ in width) were placed over the bellies of the me- dial gastrocnemius (MG), lateral gastocnemius (LG), soleus (SOL), and tibialis anterior (TA). The EMG6) signals were transmitted to a PC7) and sampled at a rate of 1 ㎑. The EMG was full-wave rectified and integrated for the duration of the contraction, and under cold and non-cold conditions to obtain an in- tegrated EMG (iEMG) value.
Statistics
Descriptive data included ±SD for the means.
One-way analysis of variance (ANOVA) with re- peated measures was used to detect the significant effects of force level (%MVC) on the tendon force and elongation at every 10% MVC. In the event of significant values of F in the ANOVA, Tukey’s post hoc test of critical difference was used to locate sig- nificance between the different means. The level of significance was set at p<.05.
Results
Skin temperature changed due to the cooling procedures. Table 1 displays the skin temperature cooling of the MG, LG, SOL, and TA at 5-minute intervals during exposure to each environmental temperature. The decrease in temperature reached a maximum within the first two minutes of cooling.
Figure 2 shows the relationships between %MVC and F under cold and non-cold conditions. The ex- tent of force under the non-cold condition had a ten- dency to be greater than that under the cold condition. The F/L values at 50~100% of MVC were significantly greater under the cold condition than under the non-cold condition. The F and the L rela- tion under the cold and the non-cold conditions are shown in Figure 3. The elongation under the non-cold condition had a tendency to be greater than that under the cold condition. The differences be- tween the two conditions were statistically significant at force development above 580 N (about 80% of MVC). The maximum elongation (Lmax) at MVC was significantly greater under the non-cold con- dition (40.3±8.4 ㎜) than under the cold condition (30.1±8.3 ㎜). This finding indicates the correlation between %MVC and ΔF/ΔL at every 10% MVC un- der cold and non-cold conditions (Figure 4), although the ΔF/ΔL had a tendency to increase curvilinearly with increasing force (the changes of ΔF/ΔL above 10% of MVC). Under cold and non-cold conditions, the ΔF/ΔL values at 10~20%, 40~70%, and 100% of MVC were significantly higher under the cold con- dition than under the non-cold condition. Table 2 shows the iEMG activity of the MG, LG, SOL, and TA muscles under the cold and non-cold conditions.
The mean iEMG activity of the MG, LG, and Sol muscles changed under the cold condition: the MG, LG, and SOL increased (p<.001), but TA remained unchanged (p<.25).
4) Airis, Hitachi Medical Corp, Tokyo, Japan.
5) Vaio R505J/BD, Sony Computer.
6) Delsys, U.S.A.
7) PowerbookG3, Apple, Tokyo, Japan.
Figure 2. Correlation between %MVC and △F under cold and non-cold conditions.
The changes in △F above 10% MVC are significantly different between he two conditions. Values are means and SD. Significant difference between cold and non-cold conditions at *p<.05, ***p<.001.
Figure 3. Correlation between △L and △F under cold and non-cold conditions.
Values are means and SD. Significant difference between cold and non-cold conditions at *p<.05, **p<.01.
Discussion
The main finding of this study is to show that the stiffness of the tendon structures increases after cooling along with a reduction in muscle force and elongation. This is the first evidence that shows the effects of cooling on the elastic profiles of human tendon structures in vivo.
This agrees with the previous findings obtained from human experiments (Bigland-Ritchie et al, 1992;
Comeau et al, 2003; Davies and Young, 1983;
Edward et al, 1972; Faulkner et al, 1990; Howard et al, 1994; Sargeant, 1987). For example, Sargeant (1987) showed significant decreases in maximal peak force at 2 cooling conditions (18℃ and 12℃) com- pared to normal conditions (22℃) during exercise on
Figure 4. Correlation between △F/△L and %MVC at every 10% MVC. Although the △F/△L had a tendency to increase force, the changes in △F/△L above 10%
MVC were significantly different. Values are means and SD. Significant difference between cold and non-cold at *p<.05, **p<.01, ***p<.001.
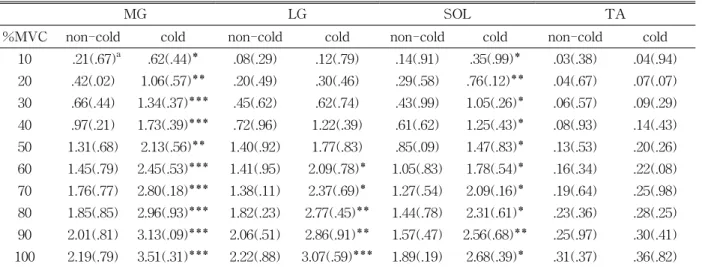
MG LG SOL TA
%MVC non-cold cold non-cold cold non-cold cold non-cold cold
10 .21(.67)a .62(.44)* .08(.29) .12(.79) .14(.91) .35(.99)* .03(.38) .04(.94) 20 .42(.02) 1.06(.57)** .20(.49) .30(.46) .29(.58) .76(.12)** .04(.67) .07(.07) 30 .66(.44) 1.34(.37)*** .45(.62) .62(.74) .43(.99) 1.05(.26)* .06(.57) .09(.29) 40 .97(.21) 1.73(.39)*** .72(.96) 1.22(.39) .61(.62) 1.25(.43)* .08(.93) .14(.43) 50 1.31(.68) 2.13(.56)** 1.40(.92) 1.77(.83) .85(.09) 1.47(.83)* .13(.53) .20(.26) 60 1.45(.79) 2.45(.53)*** 1.41(.95) 2.09(.78)* 1.05(.83) 1.78(.54)* .16(.34) .22(.08) 70 1.76(.77) 2.80(.18)*** 1.38(.11) 2.37(.69)* 1.27(.54) 2.09(.16)* .19(.64) .25(.98) 80 1.85(.85) 2.96(.93)*** 1.82(.23) 2.77(.45)** 1.44(.78) 2.31(.61)* .23(.36) .28(.25) 90 2.01(.81) 3.13(.09)*** 2.06(.51) 2.86(.91)** 1.57(.47) 2.56(.68)** .25(.97) .30(.41) 100 2.19(.79) 3.51(.31)*** 2.22(.88) 3.07(.59)*** 1.89(.19) 2.68(.39)* .31(.37) .36(.82)
aMean±SD.
Significant differences between gastrocnemius (MG), lateral gastrocnemius (LG), soleus (SOL), and tibialis anterior (TA) observed between different clothing ensembles. Significant difference between cold and non-cold at *p<.05,
**p<.01, ***p<.001.
Table 2. Change in integrated electromyogram (iEMG) amplitude in the MG, LG, SOL, and TA observed dif- ferent clothing ensembles
a constant-revolution bicycle. Mattacola and Perrin (1993) found significant differences in force pro- duction of the plantar flexors when comparing a cold-water treatment condition (15℃) to a resting body temperature condition, at a testing speed of
1.05 rad·s-1. The present results on the changes in muscle force after cooling were agreed with the pre- vious studies (Bigland-Ritchie et al, 1981; Comeau et al, 2003; Davies and Young, 1983; Edward et al, 1972; Faulkner et al, 1990; Howard et al, 1994;
Sargeant, 1987). These previous researchers stated that the cooling the muscle reduced the release of calcium from the sarcoplasmic reticulum resulting in a decline in adenosine triphosphate availability.
In addition to the effects of skin surface temper- ature on the muscle force, Asmussen et al (1976) re- ported that muscle stiffness increases with decreases in skin surface temperature. Some previous studies also showed that the maximal rate force development decreased in soleus muscle following a cooling (e.g., Segal et al, 1986). In this study, the rate of muscle force development decreased significantly together with elongation. These changes in various muscle functions could be attributed to the changes in the tendon properties with their temperatures, because muscle fibers are attached to tendon and aponeurosis.
In the present study, the tendon stiffness increased significantly after cooling, although changes in the tendon properties were found after cooling. Taking the present result into account together with the previous findings, the reasons for the stiffness of a tendon increases with cooling is the decrease in vis- cosity and fluids in the tendinous tissue.
In the present study, changes in the tendon prop- erties were found after cooling. According to the previous findings in animal models, the muscle force and viscoelastic properties of tendon were altered cooling. For example, Bressler (1981) reported that the elastic modulus decreased significantly in am- phibian skeletal muscle and tendon in the temper- ature range of 0 to 20℃. However, it should be not- ed that the temperature ranges investigated in these previous studies far exceed those in human muscles in vivo. Unfortunately, no studies have ever at- tempted to measure the tendon temperature in vivo as far as we know. Anyway, we may say that the ranges in muscle and tendon temperatures in the pres- ent study were narrower than the previous findings using animals (Bressler, 1981; Walker et al, 1976).
Considering these points, the present results indicated that the general application of ice pack changes the mechanical properties of muscle and tendon.
In the present study, the average stiffness values of the cold and non-cold conditions were 39, 33 N/
㎜, respectively. Recent studies have shown that the stiffness values of human tendon structures were 150 N/㎜ for Maganaris and Paul (1999) and 480 N/㎜
for Magnusson et al (2001), respectively. This differ- ence in the stiffness values between the present study and the previous in vivo measurements would be caused by the differences in the proximal-distal location of measurement site, the calculation of mus- cle force, the calculated range of force-elongation re- lationship, and characteristics of subjects.
Some researchers reported that the stiffness and Young’s modulus of the human tendon-aponeurosis complex in vivo was considerably lower than those previously reported for animal and human cadaver tendons (Ito et al, 1998; Maganaris et al, 1999). In vivo measures of stiffness for the tibialis anterior aponeurosis and tendon has been reported to be 32~
161 N/㎜ with a Young’s modulus of 530~1200 MPa (Ito et al, 1998; Maganaris et al, 1999). The stiffness and Young’s modulus for the combined human tri- ceps surae aponeurosis and tendon were reported several studies to be 467 N/㎜ and 1474 MPa (Maganaris et al, 1999; Magnusson et al, 2001).
Using a cooling condition method Asmussen et al (1976) reported that stiffness increases with de- creases in skin surface temperature. However, the effects of the treatments of cooling in real time and in vivo on the muscle and tendon were unclear.
Considering these results, we may say that cooling condition could increase the risk of injury during recreational and athletic sports participation. In the present study, it was found that sports related in- juries were very common among various sports ac- tivities (Merrick et al, 1999). Cool ambient temper- atures are almost universally emphasized in post-in- jury, post-operative rehabilitation and performance enhancement. In the present study, changes in the tendon properties were found after cooling. It is well known that the tendon structures act as a mechanical stiffer, protecting the muscle from damage during
high intensity contractions (Asmussen et al, 1976).
The iEMG activity of the MG, LG, and SOL in- creased significantly after cooling (Table 2), though the exposure had no significant effect on the TA.
The amplitude increase in EMG indicated enhanced motor unit activity in the non-cold gastrocnemius muscle compared to when it was cooled, This implies the higher muscle strain in the leg which had cooled more. These results supported the data in previous studies (Faulkner et al, 1990; Hopf and Maurer, 1990;
Rissanen et al, 1996; Rome, 1990; Winkel and Jorgensen, 1991), which have shown that more motor units, and thus more muscle fibres, are recruited at low temperatures to sustain a given level of power.
Conclusion
Cooling of muscle tissue have been used to obtain specific therapeutic objectives. During isometric plan- tar flexion, significant changes in the elongation of muscle fascicle, tendon and aponeurosis were found after cooling. Furthermore, the stiffness of tendon and aponeurosis during isometric contraction were found after cooling. From a practical viewpoint the present data indicated that the general application of icing pack change the mechanical properties of mus- cle and tendon.
References
Asmussen E, Bonde-Petersen F, Jorgensen K.
Mechano-elastic properties of human muscles at different temperatures. Acta Physiol Scand.
1976;96(1):83-93.
Bigland-Ritchie B, Thomas CK, Rice CL, et al. Muscle temperature, contractile speed, and motoneuron firing rates during human voluntary contractions.
Am Appl Physiol. 1992;73(6):2457-2461.
Bressler BH. Isometric contractile properties and in- stantaneous stiffness of amphibian skeletal mus-
cle in the temperature range from 0 to 20 de- grees C. Can J Physiol Pharmacol.
1981;59(6):548-554.
Comeau MJ, Potteiger JA, Brown LE. Effects of en- vironmental cooling on force production in the quadriceps and hamstrings. J Strength Cond Res. 2003;17(2):279-284.
Davies CT, Young K. Effect of temperature on the contractile properties and muscle power of tri- ceps in humans. J Appl Physiol. 1983;55(1 pt 1):191-195.
Edward RHT, Harris RC, Hultman E, et al. Effect of temperature on muscle energy metabolism and endurance during successive isometric con- tractions, sustained to fatigue, of the quadriceps muscle in man. J Physiol Lond.
1972;220:335-352.
Faulkner JA, Zerba E, Brooks SV. Muscle temper- ature of mammals: Cooling impairs most func- tional properties. Am J Physiol. 1990;259(2 pt 2):R259-R265.
Hopf HC, Maurer K. Temperature dependence of the electrical and mechanical responses of the ad- ductor pollicis muscle in humans. Muscle Nerve.
1990;13(3):259-262.
Howard RL, Kraemer WJ, Stanley DC, et al. The ef- fects of cold immersion on muscle strength. J Strength Cond Res. 1994;8:129-133.
Hunter J, Keer EH, Whillans MG. The realtion be- tween joint stiffness upon exposure to cold and the characteristics. Can J Med Sci.
1952;30(5):367-377.
Hunter J, Whillans MG. A study of the effect of cold on joint temperature and mobility. Can J Med Sci. 1951;29(5):255-262.
Ito M, Kawakami Y, Ichinose Y, et al. Nonisometric behavior of fascicles during isometric con- tractions of a human muscle. J Appl Physiol.
1998;85(4):1230-1235.
Kawakami Y, Ichinose Y, Fukunaga T. Architectural and functional features of human triceps surae muscle during contraction. J Appl Physiol.
This article was received October 4, 2006, and was accepted October 30, 2006.
1998;85(2):398-404.
Kubo K, Kanehisa H, Fukunaga T. Is passive stiff- ness related to the elasticity of tendon struc- tures? Eur J Appl Physiol. 2001;85(3-4):226-232.
Kubo K, Kawakami Y, Fukunaga T. The influences of elastic properties of tendon structures on jump performance in humans. J Appl Physiol.
1999;87(6):2090-2096.
Maganaris CN, Paul JP. In vivo human tendon me- chanical properties. J Physiol. 1999;521(Pt 1):307-313.
Magnusson SP, Aagaard P, Rosager S, Poulsen PD, Kjaer M. Load-displacement properties of the human triceps surae aponeurosis in vivo. J Physiol. 2001;531:277-288.
Mattacola CG, and Perrin DH. Effects of cold water application on isokinetic strength of the plantar flexors. Isokinet Exerc Sci. 1993;3:152-154.
Merrick MA, Rankin, JM, Andres, FA, Hinman, CL.
A preliminary examination of cryotherapy and secondary injury in skeletal muscle. Med Sci Sports Exerc. 1999;31(11):1516-1521.
Ranatunga KW. Temperature-dependence of short- ening velocity and rate of isometric tension de- velopment in rat skeletal muscle. J Physiol.
1982;329:465-483.
Rissanen S, Oksa J, Rintamaki H, et al. Effects of leg covering in humans on muscle activity and ther- mal responses in a cool environment. Eur J Appl Physiol Occup Physiol. 1996;73(1-2):163-168.
Rome LC. Influence of temperature on muscle re- cruitment and muscle function in vivo. Am J Physiol. 1990;259(2 Pt 2):R210-R222.
Sargeant AJ. Effect of muscle temperature on leg extension force and short-term power output in humans. Eur J Appl Physiol Occup Physiol.
1987;56(8):693-698.
Segal SS, Faulkner JA, White TP. Skeletal muscle fatigue in vitro is temperature dependent. J Appl Physiol. 1986;61(2):660-665.
Walker PS, Amstutz HC, Rubinfeld M. Canine tendon studies Ⅱ. Biomechanical evaluation of normal
and regrown canine tendons. J Biomed Mater Res. 1976;10:61-76.
Wiles CM., Edwards RHT. The effect of temperature, ischaemia and contractile activity on the relaxa- tion rate of human muscle. Clin Physiol.
1982;2(6):485-497.
Winkel J, Jorgensen K. Significance of skin temper- ature changes in surface electromyography. Eur J Appl Physiol Occup Physiol. 1991;63(5):345-348.