pISSN 2508-5999 • eISSN 2671-9886 Original Article
Copyright ⓒ Korean Society for Healthcare-associated Infection Control and Prevention
This is an Open Access article distributed under the terms of the Creative Commons Attribution Non-Commercial License (http://creativecommons.org/
licenses/by-nc/4.0).
전국의료관련감염감시체계 중환자실 부문 결과 보고: 2018년 7월부터 2019년 6월
김은진1ㆍ곽이경2ㆍ곽선희3ㆍ고수희4ㆍ김진화5ㆍ김의석6ㆍ김태형7ㆍ류성렬8ㆍ문희원9ㆍ박선희10ㆍ 안진영11ㆍ유소연12ㆍ유현미13ㆍ윤나라14ㆍ이미숙15ㆍ이상오16ㆍ조난형17ㆍ최지연18ㆍ홍기호19ㆍ 최영화1ㆍ김미나20
아주대학교 의과대학 감염내과학교실1, 인제대학교 일산백병원 내과2, 서울아산병원 감염관리실3, 보라매병원 감염관리실4, 순천향대학 교 서울병원 감염관리실5, 서울대학교 의과대학 내과학교실6, 순천향대학교 의과대학 내과학교실7, 계명대학교 동산의료원 감염내과8,
건국대학교 의과대학 진단검사의학교실9, 가톨릭대학교 의과대학 내과학교실10, 연세대학교 의과대학 내과학교실11, 가천대학교 간호대
학12, 인제대학교 상계백병원 감염관리실13, 조선대학교 의과대학 내과학교실14, 경희대학교 의과대학 내과학교실15, 울산대학교 의과대학 서울아산병원 감염내과16, 강남세브란스병원 감염관리실17, 중앙대학교병원 감염관리팀18, 서울의료원 진단검사의학과19, 울산대학교 의
과대학 서울아산병원 진단검사의학과20
Korean National Healthcare-associated Infections Surveillance System, Intensive Care Unit Module Report: Summary of Data from July 2018 to June 2019
Eun Jin Kim1, Yee Gyung Kwak2, Sun Hee Kwak3, Su Hui Ko4, Jin Hwa Kim5, Eu Suk Kim6,
Tae Hyong Kim7, Seong Yeol Ryu8, Hee-Won Moon9, Sun Hee Park10, Jin Young Ahn11, So-Yeon Yoo12, Hyeon Mi Yoo13, Na Ra Yun14, Mi Suk Lee15, Sang-Oh Lee16, Nan-hyoung Cho17, Ji-youn Choi18, Ki Ho Hong19, Young Hwa Choi1, Mi-Na Kim20
Department of Infectious Diseases, Ajou University School of Medicine1, Suwon, Department of Internal Medicine, Inje University Ilsan Paik Hospital2, Goyang, Office for Infection Control, Asan Medical Center3, Infection Control Office, Boramae Medical Center4, Infection Control Team, Soonchunhyang University Seoul Hospital5, Department of Internal Medicine, Seoul National University College of Medicine6, Seoul, Department of Internal Medicine, Soonchunhyang University College of Medicine7, Cheonan, Department of Infectious Disease, Keimyung University Dongsan Medical Center8, Daegu, Department of Laboratory Medicine, Konkuk University School of Medicine9, Department of Internal Medicine, College of Medicine, The Catholic University of Korea10, Department of Internal Medicine, Yonsei University College of Medicine11, Seoul, Department of Nursing, Gachon University College of Nursing12, Incheon, Infection Control Office, Inje University Sanggye Paik Hospital13, Seoul, Department of Internal Medicine, Chosun University College of Medicine14, Gwangju, Department of Internal Medicine, Kyung Hee University School of Medicine15, Department of Infectious Diseases, Asan Medical Center, University of Ulsan College of Medicine16, Office of Infection Control, Gangnam Severance Hospital17, Infection Control Team, Chungang University Hospital18, Department of Laboratory Medicine, Seoul Medical Center19, Department of Laboratory Medicine, Asan Medical Center, University of Ulsan College of Medicine20, Seoul, Korea
Background: In this report, we present the annual data of the intensive care unit (ICU) mod- ule of the Korean National Healthcare-associated Infections Surveillance (KONIS) System from July 2018 to June 2019.
Methods: We performed a prospective surveillance of healthcare-associated urinary tract infections (UTIs), bloodstream infections (BSIs), and pneumonia (PNEU) at 316 ICUs in 227 hospitals using the KONIS system. Healthcare-associated infection (HAI) and device-associat- ed infection rates were calculated as the number of infections per 1,000 patient-days (PDs) and device-days (DDs), respectively. Device utilization was calculated as the ratio of DDs to PDs.
Introduction
의료관련감염은 입원을 포함한 의료제공과 관련하여 발 생하는 모든 감염을 의미하며, 특히 중환자실은 다제내성 균에 의한 감염 위험이 높고, 침습적 중재, 중증도, 기저질 환 등으로 의료관련감염이 쉽게 발생하는 곳이다[1,2]. 감 염감시(surveillance)는 집단 내 질병의 발생, 분포, 질병 발생의 위험을 증가시키거나 감소시키는 데 영향을 미치는 요인을 지속적이고 체계적으로 수집하고 분석하여 결과를 개선시킬 수 있는 대상에게 정보를 제공하는 것으로, 의료 관련감염을 관리하기 위한 첫 걸음이라고 할 수 있다[3].
대한의료관련감염관리학회는 의료관련감염의 발생현 황을 파악하고 감염예방관리 사업과 정책에 활용하고자, 2006년부터 전국의료관련감시체계(Korean National Healthcare-associated Infections Surveillance Sys- tem, KONIS)를 구축하여 운영하고 있다[4]. KONIS는 2006년 7월부터 전국에서 자발적으로 참여하는 병원들에 의해 시작된 우리나라의 대표적인 의료관련감염 감시체계 로, 2018년 기준 전체 참여대상인 308개 병원 중 73.7%
가 참여하여 대표적인 전국의 종합병원 및 대학병원의 중 환자실 의료관련감염감시 자료로 명실상부하게 자리매김 하고 있다[5-7]. 표준화된 방법으로 각 병원의 중환자실에 서 발생하는 요로감염(urinary tract infection, UTI), 혈 류감염(bloodstream infection, BSI), 폐렴(pneumonia) 에 대한 감시를 지속적으로 유지하면서 감염률을 산출하여 2007년 7월부터 연간 중환자실 의료관련감염률 자료를 보 고하고 있으며, 감염관리 중재활동의 효과를 판정할 수 있 는 지표로 활용하고 있다[8].
의료관련감염 감시를 통해서 자료를 확보하게 되면 그
자료에 근거하여 감염관리 활동의 우선순위를 결정하는 데 도움을 줄 수 있으며, 활용 가능한 자원을 배분하기 위한 판단의 기준을 삼을 수 있다. 또한, 감염감시 결과는 의료 관련감염의 대책을 마련하기 위한 근거 자료가 될 수 있다 [8-10]. KONIS를 통해 자료가 축적되면서 중환자실 기구 관련 의료관련감염률의 위험인자와 원인균의 변화, 기구사 용비와 기구관련 감염률의 변화 등에 대해 분석하여 보고 하였으며, KONIS를 통한 지속적 감염감시가 감염률 감소 에 기여한다는 것을 보고하였다[11-15]. 또한 2008년부터 격년마다 시행되어 온 ‘전국병원감염감시체계 자료 타당 도 조사’를 통해 KONIS 자료의 높은 신뢰도를 확인하였다 [16].
이 보고서는 의료관련감염관리 정책 수립과 의료기관 의 중재활동 기초 자료로 제공하고자 쓴 2018년 7월부터 2019년 6월까지의 KONIS 중환자실 감염 감시의 열두 번 째 연간 보고이다.
Materials and Methods
2018년 7월부터 2019년 6월까지 200병상 이상의 총 227개 병원이 참여하였으며, 각 참여병원의 성인 중환자 실 중 대표적인 내과계와 외과계 중환자실 또는 통합 중환 자실을 대상으로 하여 316개 중환자실이 감시에 참여하 였다. 각 참여병원의 형태적 특성, 인력 구성 등 기초정보 를 조사하였다. 2016년부터 참여병원이 200병상 이상 규 모의 병원으로 확대되면서 병상 규모에 따라 200-299, 300-499, 500-699, 700-899병상, 900병상 이상의 다섯 군으로 분류하여 분석하였다. 중환자실의 분류는 해당 중 환자실 병상의 평균 진료과별 환자 구성에 따라 하였으며,
Received November 26, 2020 Revised December 1, 2020 Accepted December 2, 2020
Corresponding author:
Young Hwa Choi
E-mail: [email protected] ORCID:
https://orcid.org/0000-0001-5254-3101
Results: A total of 4,874 HAIs were found during the study period: 1,682 UTIs (1,633 urinary catheter-associated cases), 2,110 BSIs (1,769 central line-associated cases), and 1,082 PNEUs (569 ventilator-associated cases). The rate of urinary catheter-associated UTIs (CAUTIs) was 1.28 cases per 1,000 DDs [95% confidence interval (CI), 1.22-1.34], and the urinary catheter utilization ratio was 0.86 (95% CI, 0.859-0.861). The rate of CAUTIs was higher than that in the previous year [1.16/1,000 DDs (95% CI, 1.10-1.22)]. The rate of central line-associated BSIs was 2.32/1,000 DDs (95% CI, 2.22-2.43), and the central line utilization ratio was 0.51 (95% CI, 0.509-0.511). The rate of ventilator-associated PNEUs was 1.08/1,000 DDs (95% CI, 0.99-1.17), and the ventilator utilization ratio was 0.35 (95% CI, 0.349-0.351).
Conclusion: The overall HAI rate was similar to that in the previous year, but the rate of CAUTIs increased. In addition, the central line utilization ratio increased; thus, intervention is necessary.
Key Words: Korean National Healthcare-associated Infections Surveillance System, KONIS, Intensive care unit, Healthcare-associated infection
내과계열 환자가 단독으로 80% 이상인 경우 내과 중환자 실, 일반외과와 신경외과 환자가 각각 단독으로 80%를 넘 는 경우는 각각 외과 중환자실과 신경외과 중환자실로 정 의하였다. 그 외의 경우는 내과계통합 중환자실 또는 외과 계통합중환자실로 분류하였다[17]. 연구 기간 동안 각 참 여 중환자실에서 요로감염, 혈류감염, 폐렴에 대한 의료관 련감염 감시를 수행하였다. 중환자실 의료관련감염과 요로 감염, 혈류감염, 폐렴의 정의는 미국 질병관리본부(Center for Disease Control and Prevention, CDC)의 정의에 근거하였다[9,18].
요로감염은 ‘증상이 있는 요로감염(symptomatic uri- nary tract infection, SUTI)’과 ‘무증상 균혈증 요로감염 (asymptomatic bacteremic urinary tract infection, ABUTI)’을 포함하였고 혈류감염은 ‘원인균 확인 혈류감염 (laboratory-confirmed bloodstream infection)’을 감 시대상으로 하였다. 폐렴은 ‘임상적 폐렴(clinically de- fined pneumonia, PNEU1)’, ‘원인균 확인 폐렴(pneu- monia with specific laboratory findings, PNEU2)’
과 ‘면역저하자 폐렴(pneumonia in immunocompro- mised patients, PNEU3)’으로 분류하였다[6]. 요로감염, 혈류감염과 폐렴에서 각각 유치도뇨관, 중심정맥관, 인공 호흡기와의 관련 여부를 구분하였다. 의료관련감염률은 재 원일수(patient-days, PD) 1,000일당 의료관련감염 건 수, 기구일수감염률은 기구일수(device-days, DD) 1,000 일당 기구관련감염 건수, 기구사용비는 기구일수/재원일 수로 계산하였다. 항생제 감수성 결과가 있는 주요 세균을 대상으로 항생제에 대한 내성률을 조사하였고 중등도 내성 은 내성에 포함하여 분석하였다. KONIS 의료관련감염감 시가 기구일수 감염률에 미친 영향을 분석하기 위해 2018 년 7월-2019년 6월 기간의 기구일수 감염률 자료를 2014 년 7월-2018년 6월 사이 4년간의 연간자료와 비교하였다 [5,6,19,20]. 95% 신뢰구간(confidence interval, CI)이 겹치지 않는 경우에 유의한 차이가 있는 것으로 판단하였 다.
Results
1. KONIS 참여병원과 참여중환자실의 특성
2018년 7월부터 2019년 6월까지 KONIS 중환자실 부 문에 참여한 병원과 중환자실의 특성은 Table 1과 같다.
참여병원이 전년도 216개에서 227개로 전년도 대비 5.1%
인 11개 병원이 증가하였고, 900병상 이상 규모 병원 1개, 500-699 규모에서 1개, 300-499 규모에서 3개, 299이하 규모에서 7개기관이 증가하고 700-899규모에서 1개 기관 이 감소하였다. 전체 참여병원의 59.3%가 500병상 이하 규모의 병원이었으며, 500병상 이하 규모 병원에서 10개 (전년도 125개 대비 8.0%) 병원이 증가하였고 이 중 299 병상 이하 규모 병원 7개(전년도 66개 대비 10.6%)가 신 규로 참여하였다. 총 216개의 참여 병원 중 전공의 및 의 대학생 실습 수련병원인 주교육병원은 74개(32.6%)였고, 평균 병상 수는 534개였다. 감염관리전담인력은 각 병원 당 3.8명이었고 이들은 1인당 평균 139병상을 담당하고 있었다. 감염내과 전문의는 병원당 0.9명이었다. 참여중환 자실은 전년도 308개에서 316개로 8개가 증가하였다. 내 과계 통합 중환자실 128개(40.5%), 내과 중환자실 91개 (28.8%), 외과계 통합 중환자실45개(14.2%), 외과 중환자 실 24개(7.6%), 신경외과 중환자실 28개(8.9%)가 참여하 Table 1. Characteristics of hospitals and intensive care units participated in KONIS from July 2018 through June 2019
Variables Number (%)
Characteristics of hospitals
Total no. of hospitals 227
No. of major teaching hospitals 74 (32.6) No. of private hospitals 171 (75.3)
Average no. of beds 534
Beds size
≥ 900 26 (11.5)
700-899 32 (14.1)
500-699 34 (15.0)
300-499 62 (27.3)
200-299 73 (32.2)
Area
Seoul 43 (18.9)
Kangwon/Gyeonggi/Incheon 72 (31.7)
Central/South 112 (49.3)
Hospitals with special ward
Solid organ transplantation 16 (7.0)
Hemodialysis 202 (89.0)
Infectious diseases physician per hospital 0.9 Infection control professional per hospital 3.8 Beds per infection control professional 139 Composition of intensive care units (ICUs)
Total no. of ICUs 316
Medical ICU (MICU) 91 (28.8)
Medical combined ICU (MCICU) 128 (40.5) Surgical combined ICU (SCICU) 45 (14.2)
Surgical ICU (SICU) 24 (7.6)
Neurosurgical ICU (NSICU) 28 (8.9)
였다. 내과계열 중환자실의 비율이 69.3%로 높았으며, 전 년도와 같이 신규 참여병원의 중환자실도 내과계 통합 중 환자실의 비율이 높았다[5].
2. 중환자실 의료관련감염률
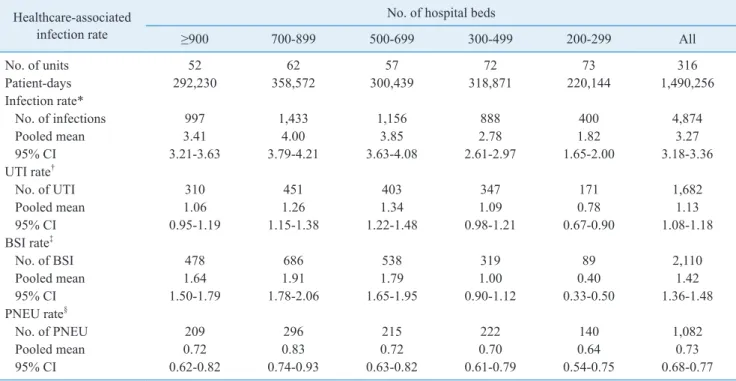
연구 기간 동안 총 4,874건의 의료관련감염이 보고되 었다. 이 중 혈류감염이 2,110건(43.3%)으로 가장 많았고 요로감염 1,682건(34.5%), 폐렴 1,082건(22.2%) 순이었 다. 참여중환자실의 총 재원일수는 1,490,256일이었다.
전체 의료관련감염률은 3.27/1,000 PD (95% CI, 3.18- 3.36)로 전년도 3.07/1,000 PD (95% CI, 2.98-3.16)에 비해 증가하였다[2]. 요로감염 발생률은 2016년 이후 지 속적으로 1.13/1,000 PD (95% CI, 1.08-1.18)로 전년도 (1.03/1,000 PD [95% CI, 0.98-1.08])에 비해 증가하였 으나, 혈류감염 발생률은 1.42/1,000 PD (95% CI, 1.36- 1.48), 폐렴 발생률은 0.73/1,000 PD (95% CI, 0.68- 0.77)로 전년도 자료인 1.35/1,000 PD (95% CI, 1.29- 1.41), 0.69/1,000 PD (95% CI, 0.65-0.74)와 비교할 때 유의한 차이는 없었다(Table 2).
3. 기구관련 의료관련감염률과 기구사용비
요로감염 1,682건 중 1,633건(97.1%)이 유치도뇨관과 관련이 있었다. 전체 유치도뇨관 기구일수는 1,278,137 일이었고, 유치도뇨관 관련 요로감염(urinary catheter- associated UTI) 발생률은 1.28/1,000 DD (95% CI, 1.22-1.34)로 전년도(1.16/1,000 DD [95% CI, 1.10- 1.22])에 비해 증가하였다(Table 3). 유치도뇨관 사용비 는 0.86 (95% CI, 0.859-0.861)로 전년도와 동일하였다 (Table 4). 혈류감염 2,110건 중 1,769건(83.8%)이 중심 정맥관과 관련된 감염이었다. 중심정맥관 관련 혈류감염 (central line-associated BSI) 발생률은 2.32/1,000 DD (95% CI, 2.22-2.43)로 전년도(2.29/1,000 DD [95% CI, 2.18-2.40])와 유사하였다. 전체 중심정맥관 기구일수는 761,513일이었고, 중심정맥관의 사용비는 0.51 (95% CI, 0.509-0.511)로 전년도(0.50 [95% CI, 0.499-0.501]) 에 비해 증가하였다. 폐렴 1,082건 중 569건(52.6%)이 인공호흡기와 관련된 것이었다. 전체 인공호흡기 기구일 수는 526,924일이었고, 인공호흡기 관련 폐렴 발생률은 1.08/1,000 DD (95% CI, 0.99-1.17), 인공호흡기의 기
Table 2. Pooled means of healthcare-associated infection rates, by number of hospital beds, from July 2018 through June 2019 Healthcare-associated
infection rate
No. of hospital beds
≥900 700-899 500-699 300-499 200-299 All
No. of units 52 62 57 72 73 316
Patient-days 292,230 358,572 300,439 318,871 220,144 1,490,256
Infection rate*
No. of infections 997 1,433 1,156 888 400 4,874
Pooled mean 3.41 4.00 3.85 2.78 1.82 3.27
95% CI 3.21-3.63 3.79-4.21 3.63-4.08 2.61-2.97 1.65-2.00 3.18-3.36
UTI rate†
No. of UTI 310 451 403 347 171 1,682
Pooled mean 1.06 1.26 1.34 1.09 0.78 1.13
95% CI 0.95-1.19 1.15-1.38 1.22-1.48 0.98-1.21 0.67-0.90 1.08-1.18
BSI rate‡
No. of BSI 478 686 538 319 89 2,110
Pooled mean 1.64 1.91 1.79 1.00 0.40 1.42
95% CI 1.50-1.79 1.78-2.06 1.65-1.95 0.90-1.12 0.33-0.50 1.36-1.48
PNEU rate§
No. of PNEU 209 296 215 222 140 1,082
Pooled mean 0.72 0.83 0.72 0.70 0.64 0.73
95% CI 0.62-0.82 0.74-0.93 0.63-0.82 0.61-0.79 0.54-0.75 0.68-0.77
*Pooled mean=(No. of UTIs, BSIs, or PNEUs/No. of patient-days)×1,000.
†Pooled mean=(No. of UTIs/No. of patient-days)×1,000.
‡Pooled mean=(No. of BSIs/No. of patient-days)×1,000.
§Pooled mean=(No. of PNEUs/No. of patient-days)×1,000.
Abbreviations: UTI, urinary tract infection; BSI, bloodstream infection; PNEU, pneumonia; CI, confidence interval.
구사용비는 0.35 (95% CI, 0.349-0.351)이었으며, 전년 도와 유의한 차이는 없었다(Table 3, 4).
4. 병상규모에 따른 기구관련 의료관련감염률과 기구사 용비
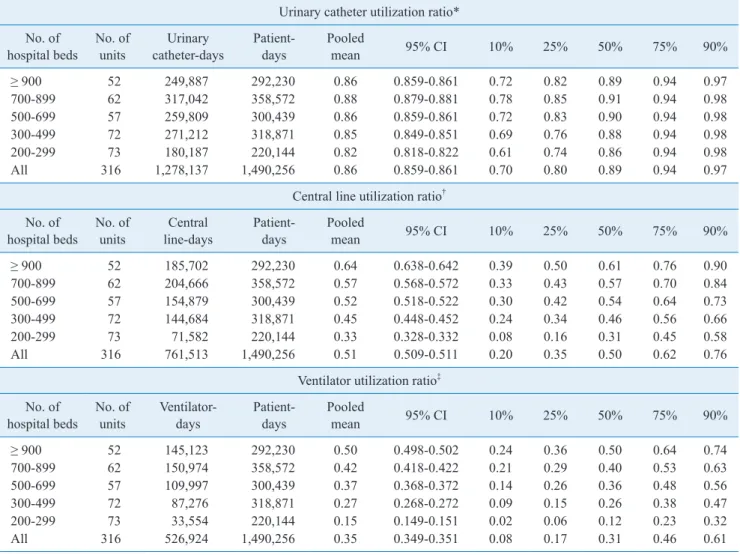
유치도뇨관 사용비는 병상규모가 커질수록 높아지는 경 향을 보였으며, 그 중에서도 700-899 병상의 병원이 전 년도와 같이 가장 높은 사용비(0.88 [95% CI, 0.879- 0.881])를 보였다(Table 4). 유치도뇨관 관련 요로감염률 은 200-299병상의 병원(0.92/1,000 DD [95% CI, 0.79- 1.07])에서 다른 규모 병원과 비교하여 유의하게 낮은 감 염률을 보였다(Table 3). 중심정맥관과 인공호흡기 기구
사용비는 병상규모가 커질수록 기구사용비도 유의하게 증 가하였다(Table 4). 중심정맥관 관련 혈류감염률은 500병 상 이상의 병원에서 200-499병상 규모의 병원에 비해 유 의하게 높았다(2.67/1,000 DD [95% CI, 2.54-2.81] vs.
1.45/1,000 DD [95% CI, 1.30-1.62]). 인공호흡기 관련 폐렴은 200-299병상의 병원(1.91/1,000 DD [95% CI, 1.49-2.44])에서 다른 규모의 병원에 비해 유의하게 높았 다(Table 3).
5. 중환자실 유형에 따른 기구관련 의료관련감염률과 기 구사용비
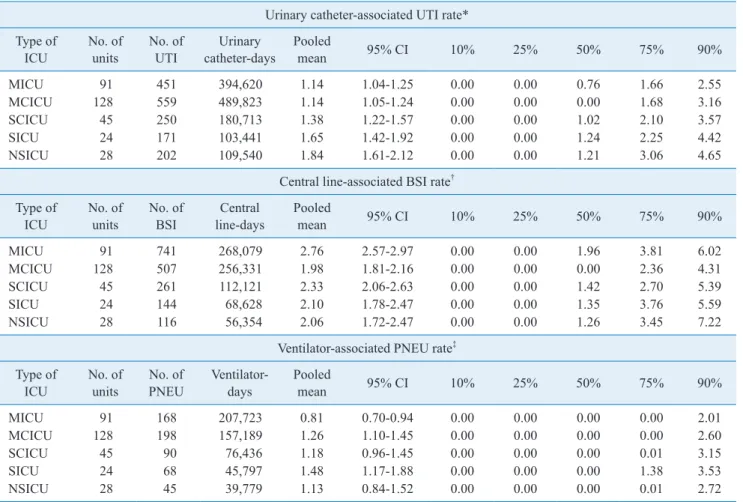
유치도뇨관 관련 요로감염 발생률은 내과 중환자실 Table 3. Pooled means and percentiles of the distribution of device-associated infection rates, by number of hospital beds, from July 2018 through June 2019
Urinary catheter-associated UTI rate*
No. of
hospital beds No. of
units No. of
UTI Urinary
catheter-days Pooled
mean 95% CI 10% 25% 50% 75% 90%
≥ 900 52 303 249,887 1.21 1.08-1.36 0.00 0.00 0.83 1.78 2.89
700-899 62 443 317,042 1.40 1.27-1.53 0.00 0.00 0.98 2.02 3.44
500-699 57 388 259,809 1.49 1.35-1.65 0.00 0.00 1.08 2.06 3.80
300-499 72 334 271,212 1.23 1.11-1.37 0.00 0.00 0.89 2.10 3.42
200-299 73 165 180,187 0.92 0.79-1.07 0.00 0.00 0.00 1.29 2.73
All 316 1,633 1,278,137 1.28 1.22-1.34 0.00 0.00 0.81 1.88 3.33
Central line-associated BSI rate† No. of
hospital beds No. of
units No. of
BSI Central
line-days Pooled
mean 95% CI 10% 25% 50% 75% 90%
≥ 900 52 424 185,702 2.28 2.08-2.51 0.00 0.00 1.61 3.45 5.79
700-899 62 598 204,666 2.92 2.70-3.17 0.00 0.00 2.21 4.01 6.27
500-699 57 434 154,879 2.80 2.55-3.08 0.00 0.00 2.06 4.26 6.79
300-499 72 253 144,684 1.75 1.55-1.98 0.00 0.00 0.00 2.46 4.34
200-299 73 60 71,582 0.84 0.65-1.08 0.00 0.00 0.00 0.00 2.68
All 316 1,769 761,513 2.32 2.22-2.43 0.00 0.00 0.98 3.15 5.25
Ventilator-associated PNEU rate‡ No. of
hospital beds No. of
units No. of
PNEU Ventilator-
days Pooled
mean 95% CI 10% 25% 50% 75% 90%
≥ 900 52 138 145,123 0.95 0.80-1.12 0.00 0.00 0.00 0.36 2.93
700-899 62 161 150,974 1.07 0.91-1.24 0.00 0.00 0.00 0.89 2.41
500-699 57 107 109,997 0.97 0.80-1.18 0.00 0.00 0.00 0.00 3.00
300-499 72 99 87,276 1.13 0.93-1.38 0.00 0.00 0.00 0.00 3.00
200-299 73 64 33,554 1.91 1.49-2.44 0.00 0.00 0.00 0.00 1.64
All 316 569 526,924 1.08 0.99-1.17 0.00 0.00 0.00 0.01 2.71
*Pooled mean=(No. of urinary catheter-associated UTIs/No. of urinary catheter-days)×1,000.
†Pooled mean=(No. of central line-associated BSIs/No. of central line-days)×1,000.
‡Pooled mean=(No. of ventilator-associated PNEUs/No. of ventilator-days)×1,000.
Abbreviations: UTI, urinary tract infection; BSI, bloodstream infection; PNEU, pneumonia; CI, confidence interval.
(1.14/1,000 DD [95% CI, 1.04-1.25])과 내과계 통합 중환자실(1.14/1,000 DD [95% CI, 1.05-1.24])에서 외 과 중환자실(1.65/1,000 DD [95% CI, 1.42-1.92]), 신경 외과 중환자실(1.84/1,000 DD [95% CI, 1.61-2.12])에 비해 유의하게 낮았다. 중심정맥관 관련 혈류감염 발생률 은 내과중환자실(2.76/1,000 DD [95% CI, 2.57-2.97]) 에서 내과계 통합중환자실(1.98/1,000 DD [95% CI, 1.81-2.16])에 비해 유의하게 높았다. 또한 외과 중환자실 (2.10/1,000 DD [95% CI, 1.78-2.47]), 신경외과 중환자 실(2.06/1,000 DD [95% CI, 1.72-2.47])에 비해서도 유 의하게 높은 비율을 보였다. 인공호흡기 관련 폐렴 발생률 은 외과 중환자실(1.48/1,000 DD [95% CI, 1.17-1.88])
에서 내과 중환자실(0.81/1,000 DD [95% CI, 0.70- 0.94])에 비해 유의하게 높았다(Table 5).
유치도뇨관 사용비는 내과 중환자실(0.84 [95% CI, 0.839-0.841])에서 가장 낮았으며, 신경외과 중환자실 (0.90 [95% CI, 0.898-0.902])에서 가장 높았다. 중심 정맥관 사용비는 내과계 통합중환자실(0.45 [95% CI, 0.449-0.451])에서 가장 낮았고, 외과 중환자실(0.57 [95% CI, 0.567-0.573])에서 가장 높았다. 인공호흡기 사용비는 내과계 통합중환자실(0.27 [95% CI, 0.269- 0.271])에서 가장 낮았으며, 내과 중환자실(0.44 [95% CI, 0.439-0.441])에서 가장 높았다(Table 6).
Table 4. Pooled means and percentiles of the distribution of device-utilization ratios, by number of hospital beds, from July 2018 through June 2019
Urinary catheter utilization ratio*
No. of
hospital beds No. of
units Urinary
catheter-days Patient-
days Pooled
mean 95% CI 10% 25% 50% 75% 90%
≥ 900 52 249,887 292,230 0.86 0.859-0.861 0.72 0.82 0.89 0.94 0.97
700-899 62 317,042 358,572 0.88 0.879-0.881 0.78 0.85 0.91 0.94 0.98
500-699 57 259,809 300,439 0.86 0.859-0.861 0.72 0.83 0.90 0.94 0.98
300-499 72 271,212 318,871 0.85 0.849-0.851 0.69 0.76 0.88 0.94 0.98
200-299 73 180,187 220,144 0.82 0.818-0.822 0.61 0.74 0.86 0.94 0.98
All 316 1,278,137 1,490,256 0.86 0.859-0.861 0.70 0.80 0.89 0.94 0.97
Central line utilization ratio† No. of
hospital beds No. of
units Central
line-days Patient-
days Pooled
mean 95% CI 10% 25% 50% 75% 90%
≥ 900 52 185,702 292,230 0.64 0.638-0.642 0.39 0.50 0.61 0.76 0.90
700-899 62 204,666 358,572 0.57 0.568-0.572 0.33 0.43 0.57 0.70 0.84
500-699 57 154,879 300,439 0.52 0.518-0.522 0.30 0.42 0.54 0.64 0.73
300-499 72 144,684 318,871 0.45 0.448-0.452 0.24 0.34 0.46 0.56 0.66
200-299 73 71,582 220,144 0.33 0.328-0.332 0.08 0.16 0.31 0.45 0.58
All 316 761,513 1,490,256 0.51 0.509-0.511 0.20 0.35 0.50 0.62 0.76
Ventilator utilization ratio‡ No. of
hospital beds No. of
units Ventilator-
days Patient-
days Pooled
mean 95% CI 10% 25% 50% 75% 90%
≥ 900 52 145,123 292,230 0.50 0.498-0.502 0.24 0.36 0.50 0.64 0.74
700-899 62 150,974 358,572 0.42 0.418-0.422 0.21 0.29 0.40 0.53 0.63
500-699 57 109,997 300,439 0.37 0.368-0.372 0.14 0.26 0.36 0.48 0.56
300-499 72 87,276 318,871 0.27 0.268-0.272 0.09 0.15 0.26 0.38 0.47
200-299 73 33,554 220,144 0.15 0.149-0.151 0.02 0.06 0.12 0.23 0.32
All 316 526,924 1,490,256 0.35 0.349-0.351 0.08 0.17 0.31 0.46 0.61
*Pooled mean=(No. of urinary catheter-days/No. of patient-days).
†Pooled mean=(No. of central line-days/No. of patient-days).
‡Pooled mean=(No. of ventilator-days/No. of patient-days).
Abbreviations: UTI, urinary tract infection; BSI, bloodstream infection; PNEU, pneumonia; CI, confidence interval.
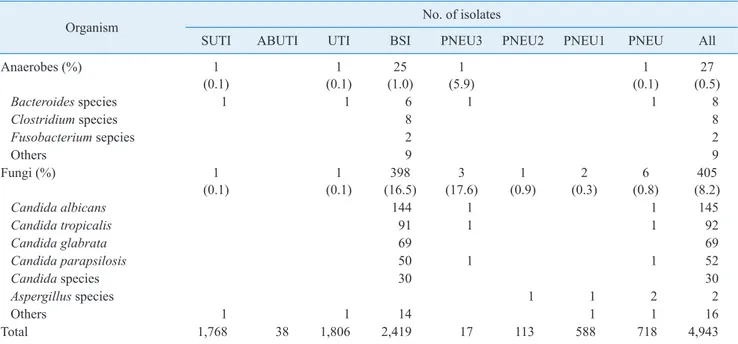
6. 원인미생물과 주요 미생물의 항생제 내성률
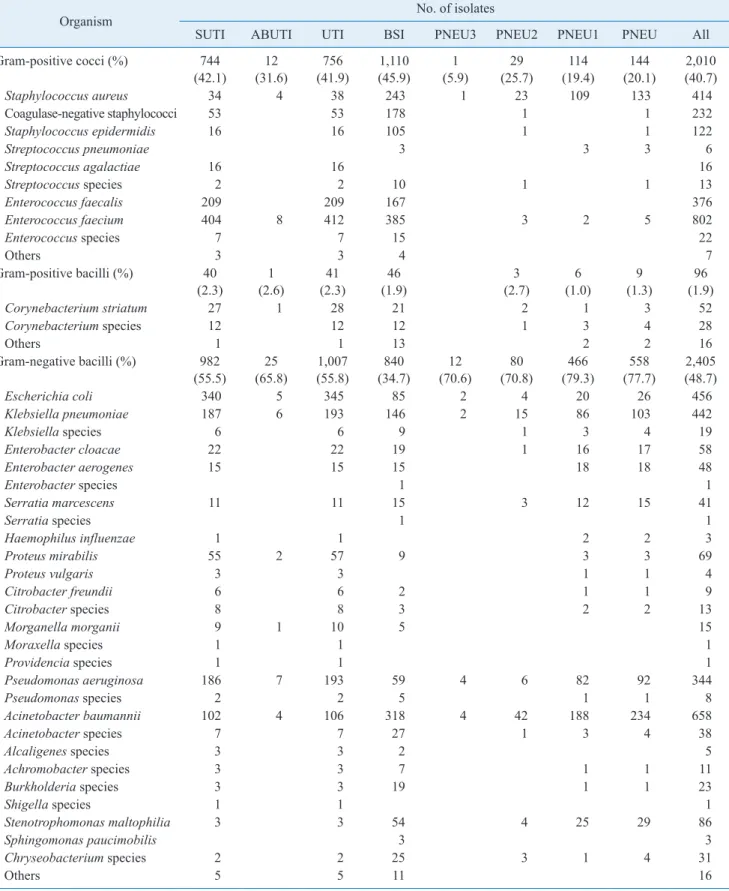
총 4,874건의 감염에서 4,943균주가 분리되었다. 그 람음성막대균 2,405 (48.7%), 그람양성알균 2,010 (40.7%), 진균 405 (8.2%)의 순이었다. 분리된 미생물 을 Table 7에 기술하였다. 요로감염에서는 그람음성막 대균이 1,007 (55.8%)로 가장 많았고 Escherichia coli (34.3%, 345/1,007)가 가장 흔하게 분리되었다. 혈류감염 은 그람양성알균이 45.9%로 가장 흔하게 분리되었고 En- terococcus faecium (34.7%, 385/1,110), Staphyococ- cus aureus (21.9%, 243/1,110), coagulase-negative staphylococci (16.0%, 178/1,110) 순이었다. 그람음성 간균은 34.7%가 분리되었으며, Acinetobacter baumannii (37.9%, 318/840)가 가장 많이 분리되었다. 혈류감염에
서 진균은 16.5% (398)가 분리되었으며, 가장 흔한 원인균 은 Candida albicans (36.2%, 144/398)였다. 폐렴에서는 그람음성막대균이 77.7%로 가장 많았고 폐렴의 흔한 원 인균은 Acinetobacter baumannii (41.9%, 234/558), S.
aureus (23.8%, 133/558)였다(Table 7).
주요 세균의 주요 항생제에 대한 내성률을 Table 8에 기 술하였다. 메티실린 내성 황색포도알균은 74.5%로 전년 도 79.4%에 비해 지속적으로 감소하는 경향을 보이고 있 었다. Vancomycin 내성 Enterococcus faecium의 비율은 55.9%로 전년도 50.7%에 비해 증가하였다. A. baumannii 의 imipenem 내성률은 89.3%로 높았고 전년도 89.6%와 유사하였으며, Klebsiella pneumoniae의 imipenem 내성 률은 18.3%로 전년도(15.1%) 보다 증가하였다(Table 8).
Table 5. Pooled means and percentiles of the distribution of device-associated infection rates, by type of ICU, from July 2018 through June 2019
Urinary catheter-associated UTI rate*
Type of
ICU No. of
units No. of
UTI Urinary
catheter-days Pooled
mean 95% CI 10% 25% 50% 75% 90%
MICU 91 451 394,620 1.14 1.04-1.25 0.00 0.00 0.76 1.66 2.55
MCICU 128 559 489,823 1.14 1.05-1.24 0.00 0.00 0.00 1.68 3.16
SCICU 45 250 180,713 1.38 1.22-1.57 0.00 0.00 1.02 2.10 3.57
SICU 24 171 103,441 1.65 1.42-1.92 0.00 0.00 1.24 2.25 4.42
NSICU 28 202 109,540 1.84 1.61-2.12 0.00 0.00 1.21 3.06 4.65
Central line-associated BSI rate† Type of
ICU No. of
units No. of
BSI Central
line-days Pooled
mean 95% CI 10% 25% 50% 75% 90%
MICU 91 741 268,079 2.76 2.57-2.97 0.00 0.00 1.96 3.81 6.02
MCICU 128 507 256,331 1.98 1.81-2.16 0.00 0.00 0.00 2.36 4.31
SCICU 45 261 112,121 2.33 2.06-2.63 0.00 0.00 1.42 2.70 5.39
SICU 24 144 68,628 2.10 1.78-2.47 0.00 0.00 1.35 3.76 5.59
NSICU 28 116 56,354 2.06 1.72-2.47 0.00 0.00 1.26 3.45 7.22
Ventilator-associated PNEU rate‡ Type of
ICU No. of
units No. of
PNEU Ventilator-
days Pooled
mean 95% CI 10% 25% 50% 75% 90%
MICU 91 168 207,723 0.81 0.70-0.94 0.00 0.00 0.00 0.00 2.01
MCICU 128 198 157,189 1.26 1.10-1.45 0.00 0.00 0.00 0.00 2.60
SCICU 45 90 76,436 1.18 0.96-1.45 0.00 0.00 0.00 0.01 3.15
SICU 24 68 45,797 1.48 1.17-1.88 0.00 0.00 0.00 1.38 3.53
NSICU 28 45 39,779 1.13 0.84-1.52 0.00 0.00 0.00 0.01 2.72
*Pooled mean=(No. of urinary catheter-associated UTIs/No. of urinary catheter-days)×1,000.
†Pooled mean=(No. of central line-associated BSIs/No. of central line-days)×1,000.
‡Pooled mean=(No. of ventilator-associated PNEUs/No. of ventilator-days)×1,000.
Abbreviations: ICU, intensive care unit; MICU, medical ICU; MCICU, medical combined ICU; SCICU, surgical combined ICU; SICU, surgical ICU; NSICU, neurosurgical ICU; UTI, urinary tract infection; BSI, bloodstream infection; PNEU, pneumonia; CI, confidence interval.
7. 2014-2019년도의 기구사용비와 기구관련 의료관련 감염률
2018년 7월부터 2019년 6월까지 1년간의 기구사용비 와 기구일수 의료관련감염률을 이전 4년간의 KONIS 자 료와 비교하였다(Table 9). 유치도뇨관 관련 요로감염 발 생률은 2015년부터 지속적으로 전년도에 비해 증가하였 다[5]. 2015년부터 지속적으로 증가해오던 유치도뇨관 사 용비는 전년도와 동일하였다. 중심정맥관 사용비는 2016 년부터 지속적으로 증가하였으나 중심정맥관 관련 혈류감 염률의 변화는 유의하지 않았다. 인공호흡기 사용비와 인 공호흡기 관련 폐렴 발생률은 이전 4년간의 자료와 비교할 때 유의한 차이가 없었다(Table 9).
Discussion
KONIS 중환자실 부문은 2006년 7월부터 의료관련감염 감시를 시작하여 2007년 7월부터 연간자료를 발표하기 시 작하였으며, 이번 결과보고는 KONIS에 참여한 227개의 병원이 감시를 수행한 2018년 7월부터 2019년 6월까지의 자료를 정리한 열두 번째 연간자료이다. 2016년부터 건강 보험심사평가원의 의료질향상분담금 지표에 KONIS 참여 여부가 포함되었고, 참여병원 기준이 200병상 이상의 병 원으로 확대되었으며, 모든 참여병원이 연중 감시하는 것 으로 확대되었다. 이러한 변화로 2016년 참여병원은 195 개 기관 285개 중환자실, 2017년에는 216개 병원 308개 중환자실, 2019년에는 227개 병원 316개 중환자실로 증 가하였으며, 대상 기관 308개 중 73.7%의 높은 참여율을 보였다[5,8]. 이번 열두 번째 KONIS 중환자실 부문 연간 Table 6. Pooled means and percentiles of the distribution of device-utilization ratios, by type of ICU, from July 2018 through June 2019
Urinary catheter utilization ratio*
Type of
ICU No. of
units Urinary
catheter-days Patient-
days Pooled
mean 95% CI 10% 25% 50% 75% 90%
MICU 91 394,620 469,513 0.84 0.839-0.841 0.69 0.78 0.86 0.92 0.96
MCICU 128 489,823 575,835 0.85 0.849-0.851 0.66 0.77 0.88 0.93 0.97
SCICU 45 180,713 202,217 0.89 0.889-0.891 0.76 0.87 0.93 0.96 0.98
SICU 24 103,441 120,551 0.86 0.858-0.862 0.76 0.82 0.89 0.93 0.96
NSICU 28 109,540 122,140 0.90 0.898-0.902 0.75 0.89 0.94 0.97 0.99
Central line utilization ratio† Type of
ICU No. of
units Central
line-days Patient-
days Pooled
mean 95% CI 10% 25% 50% 75% 90%
MICU 91 268,079 469,513 0.57 0.569-0.571 0.21 0.42 0.56 0.69 0.82
MCICU 128 256,331 575,835 0.45 0.449-0.451 0.14 0.27 0.41 0.56 0.67
SCICU 45 112,121 202,217 0.55 0.548-0.552 0.34 0.46 0.55 0.67 0.75
SICU 24 68,628 120,551 0.57 0.567-0.573 0.31 0.44 0.58 0.74 0.85
NSICU 28 56,354 122,140 0.46 0.457-0.463 0.26 0.34 0.45 0.58 0.70
Ventilator utilization ratio‡ Type of
ICU No. of
units Ventilator-
days Patient-
days Pooled
mean 95% CI 10% 25% 50% 75% 90%
MICU 91 207,723 469,513 0.44 0.439-0.441 0.11 0.25 0.43 0.58 0.70
MCICU 128 157,189 575,835 0.27 0.269-0.271 0.05 0.11 0.21 0.34 0.50
SCICU 45 76,436 202,217 0.38 0.378-0.382 0.19 0.29 0.37 0.45 0.53
SICU 24 45,797 120,551 0.38 0.377-0.383 0.15 0.25 0.37 0.48 0.57
NSICU 28 39,779 122,140 0.33 0.327-0.333 0.13 0.18 0.28 0.41 0.59
*Pooled mean=(No. of urinary catheter-days/No. of patient-days).
†Pooled mean=(No. of central line-days/No. of patient-days).
‡Pooled mean=(No. of ventilator-days/No. of patient-days).
Abbreviations: ICU, intensive care unit; MICU, medical ICU; MCICU, medical combined ICU; SCICU, surgical combined ICU; SICU, surgical ICU; NSICU, neurosurgical ICU; UTI, urinary tract infection; BSI, bloodstream infection; PNEU, pneumonia; CI, confidence interval.
Table 7. Number (%) of microorganisms isolated from clinical specimens of patients with healthcare-associated infections
Organism No. of isolates
SUTI ABUTI UTI BSI PNEU3 PNEU2 PNEU1 PNEU All
Gram-positive cocci (%) 744
(42.1) 12
(31.6) 756
(41.9) 1,110
(45.9) 1
(5.9) 29
(25.7) 114
(19.4) 144
(20.1) 2,010 (40.7)
Staphylococcus aureus 34 4 38 243 1 23 109 133 414
Coagulase-negative staphylococci 53 53 178 1 1 232
Staphylococcus epidermidis 16 16 105 1 1 122
Streptococcus pneumoniae 3 3 3 6
Streptococcus agalactiae 16 16 16
Streptococcus species 2 2 10 1 1 13
Enterococcus faecalis 209 209 167 376
Enterococcus faecium 404 8 412 385 3 2 5 802
Enterococcus species 7 7 15 22
Others 3 3 4 7
Gram-positive bacilli (%) 40
(2.3) 1
(2.6) 41
(2.3) 46
(1.9) 3
(2.7) 6
(1.0) 9
(1.3) 96
(1.9)
Corynebacterium striatum 27 1 28 21 2 1 3 52
Corynebacterium species 12 12 12 1 3 4 28
Others 1 1 13 2 2 16
Gram-negative bacilli (%) 982
(55.5) 25
(65.8) 1,007
(55.8) 840
(34.7) 12
(70.6) 80
(70.8) 466
(79.3) 558
(77.7) 2,405 (48.7)
Escherichia coli 340 5 345 85 2 4 20 26 456
Klebsiella pneumoniae 187 6 193 146 2 15 86 103 442
Klebsiella species 6 6 9 1 3 4 19
Enterobacter cloacae 22 22 19 1 16 17 58
Enterobacter aerogenes 15 15 15 18 18 48
Enterobacter species 1 1
Serratia marcescens 11 11 15 3 12 15 41
Serratia species 1 1
Haemophilus influenzae 1 1 2 2 3
Proteus mirabilis 55 2 57 9 3 3 69
Proteus vulgaris 3 3 1 1 4
Citrobacter freundii 6 6 2 1 1 9
Citrobacter species 8 8 3 2 2 13
Morganella morganii 9 1 10 5 15
Moraxella species 1 1 1
Providencia species 1 1 1
Pseudomonas aeruginosa 186 7 193 59 4 6 82 92 344
Pseudomonas species 2 2 5 1 1 8
Acinetobacter baumannii 102 4 106 318 4 42 188 234 658
Acinetobacter species 7 7 27 1 3 4 38
Alcaligenes species 3 3 2 5
Achromobacter species 3 3 7 1 1 11
Burkholderia species 3 3 19 1 1 23
Shigella species 1 1 1
Stenotrophomonas maltophilia 3 3 54 4 25 29 86
Sphingomonas paucimobilis 3 3
Chryseobacterium species 2 2 25 3 1 4 31
Others 5 5 11 16
보고는 2016년의 변화 이후 세번째 보고이다.
2018년 7월에 변경된 KONIS 매뉴얼에서는 2차 혈류감 염의 기준을 좀 더 명확하게 수립하여 혈류감염의 민감도 를 높이기 위한 노력을 시행하였으며, 이전과 같이 현장교 육 및 실무자 교육을 지속하였다[9,17]. 이러한 노력과 익 명성의 보장이 자료의 신뢰성을 확보하여 축적된 감시 자 료를 근거로 각 병원에서의 중재활동을 할 수 있도록 하며, 국가 정책의 근거자료로 활용할 수 있을 것이다[21].
참여병원은 11개 병원(전년도 대비 5.1%)이 증가하였으 며, 500병상 이하 규모 병원에서 10개 병원이 증가하였고, 전체 참여병원의 59.3%가 500병상 이하 규모의 병원이었
다. 이는 2015년 500병상 이하 규모의 비율이 24.3%였으 나 2016년 54.3%로 급격히 증가한 이후 지속 유지되었다 [20]. 따라서 2016년 이후부터는 500병상 이하 규모의 참 여병원의 영향을 고려하고, 이전의 결과와는 참여병원의 규모가 다르다는 전제하에서 해석되어야 하겠다.
감염관리전담인력 1인당 병상은 2015년 365병상에서 2016년 142명으로 변화한 후 2018년 평균 139병상을 담 당하고 있었다. 병원당 감염내과 전문의 수는 2015년 1.5 명에서 2016년부터 감소한 이후 병원당 0.9명으로 유지되 었다. 이는 2016년 9월부터 시작된 감염예방관리료 지급 과 신규 참여병원의 부족한 감염내과 의사의 실태를 반영 하는 것으로 보인다[6,19].
기구관련 의료관련감염률 자료에서 유치도뇨관 관련 요 로감염 발생률은 2015년 이후 지속적으로 증가하였으나 중심정맥관 관련 혈류감염과 인공호흡기 관련 폐렴은 전 년도와 유의한 차이가 없었다[5]. 유치도뇨관 관련 요로감 염 발생률의 세부분석에서 신경외과 중환자실(1.84/1,000 DD [95% CI, 1.61-2.12])에서 가장 높은 감염률을 보였 으며, 이는 전년도(1.35/1,000 DD [95% CI, 1.16-1.57]) 와 비교하여도 유의한 감염률의 증가를 보였다. 이에 비해 내과계열 중환자실과, 가장 작은 규모인 200-299병상의 병원에서 유의하게 낮은 감염률을 보였다. 유치도뇨관 사 용비의 세부분석에서는 외과 중환자실에서만 유의하게 증 가하였으며, 병상규모가 커질수록 높아지는 경향을 보였 Table 7. Continued
Organism No. of isolates
SUTI ABUTI UTI BSI PNEU3 PNEU2 PNEU1 PNEU All
Anaerobes (%) 1
(0.1) 1
(0.1) 25
(1.0) 1
(5.9) 1
(0.1) 27
(0.5)
Bacteroides species 1 1 6 1 1 8
Clostridium species 8 8
Fusobacterium sepcies 2 2
Others 9 9
Fungi (%) 1
(0.1) 1
(0.1) 398
(16.5) 3
(17.6) 1
(0.9) 2
(0.3) 6
(0.8) 405 (8.2)
Candida albicans 144 1 1 145
Candida tropicalis 91 1 1 92
Candida glabrata 69 69
Candida parapsilosis 50 1 1 52
Candida species 30 30
Aspergillus species 1 1 2 2
Others 1 1 14 1 1 16
Total 1,768 38 1,806 2,419 17 113 588 718 4,943
Abbreviations: UTI, urinary tract infection; SUTI, symptomatic UTI; ABUTI, asymptomatic bacteremic UTI; BSI, bloodstream infection; PNEU, pneumonia.
Table 8. Susceptibilities of major pathogens isolated from pa- tients with healthcare-associated infections
Organism No. of resistant/
total isolates (%) Methicillin-resistant Staphylococcus aureus 307/412 (74.5) Vancomycin-resistant Enterococcus faecalis 12/374 (3.2) Vancomycin-resistant Enterococcus faecium 443/793 (55.9) Cefotaxime-resistant Escherichia coli 251/427 (58.8) Cefotaxime-resistant Klebsiella pneumoniae 272/423 (64.3) Ciprofloxacin-resistant Escherichia coli 273/443 (61.6) Ciprofloxacin-resistant Klebsiella pneumoniae 242/415 (58.3) Imipenem-resistant Klebsiella pneumoniae 76/415 (18.3) Imipenem-resistant Pseudomonas aeruginosa 177/336 (52.7) Imipenem-resistant Acinetobacter baumannii 566/634 (89.3)