Automated Analysis Technique Developed for Detection of ODSCC on the Tubes of OPR1000 Steam Generator
In Chul Kim*✝ and Min Woo Nam*
Abstract A steam generator (SG) tube is an important component of a nuclear power plant (NPP). It works as a pressure boundary between the primary and secondary systems. The integrity of a SG tube can be assessed by an eddy current test every outage. The eddy current technique(adopting a bobbin probe) is currently the main technique used to assess the integrity of the tubing of a steam generator. An eddy current signal analyst for steam generator tubes continuously analyzes data over a given period of time. However, there are possibilities that the analyst conducting the test may get tired and cause mistakes, such as: missing indications or not being able to separate a true defect signal from one that is more complicated. This error could lead to confusion and an improper interpretation of the signal analysis. In order to avoid these possibilities, many countries of opted for automated analyses. Axial ODSCC (outside diameter stress corrosion cracking) defects on the tubes of OPR1000 steam generators have been found on the tube that are in contract with tube support plates. In this study, automated analysis software called CDS (computer data screening) made by Zetec was used. This paper will discuss the results of introducing an automated analysis system for an axial ODSCC on the tubes of an OPR1000 steam generator.
Keywords: Automated Data Analysis, Eddy Current Testing, Steam Generator, Bobbin Probe, POD
[Received: November 29, 2013, Revised: December 23, 2013, Accepted: December 23, 2013] *KHNP-Central Research Institute, Daejeon 305-343, Korea ✝Corresponding Author: [email protected]
ⓒ 2013, Korean Society for Nondestructive Testing
1. Introduction
The eddy current test is used to detect flaws on steam generator tubes during in-service inspection at nuclear power plants. Because an eddy current signal analyst for steam generator tubes continuously examines data over a given period of time, the analyst tends to go easily tired. Therefore, there are possibilities that the analyst could not discriminate the true defect signal from complicated whole signal or makes wrong decisions.
A missed or incorrectly reported defect indication can lead to a plant shutdown or a tube rupture event. In order to avoid these possibilities, the analysis system demand forcibly three analysis teams. These teams are consisted of the primary, secondary and resolution. To maintain independence, the primary and secondary
analyses should be done separately without knowledge of the other team's results. A resolution team should review and resolve discrepancies between the results of the primary and secondary analysis teams. Generally in foreign countries, automated analyses are adopted the secondary analysis(Fig. 1). Sometimes both a the primary and secondary analysis is performed by the automated analysis tool.
Fig. 1 SG ECT organization that includes automated analysis
A common problem that exists is when an axial ODSCC(outside diameter stress corrosion cracking) defects on the tubes of an OPR1000 steam generator have been found that came into contact with support plates. In this study, an automatic analysis technique for bobbin eddy current signal is introduced. This technique was devised to detect axial ODSCC on the OPR1000 steam generator tubes. Experiment results using practical data are provided and discussed in this paper.
2. Method and Results
2.1 Automated Analysis Software
Most foreign nuclear power plants utilize automated analysis software either from Westinghouse, Zetec, or AREVA. This software is qualified by EPRI (Electric Power Research Institute). The performance of the automated analysis software is verified through an EPRI AAPDD (automated analysis performance demon- ration database) test before practical application.
Even if the software has passed the AAPDD it cannot be used directly for inspection of steam generator tubes at nuclear power plants.
AAPDD qualification does not mean that the software is applicable to at nuclear site because the ECT signal appears differently depending on the characteristics of steam generator degradation
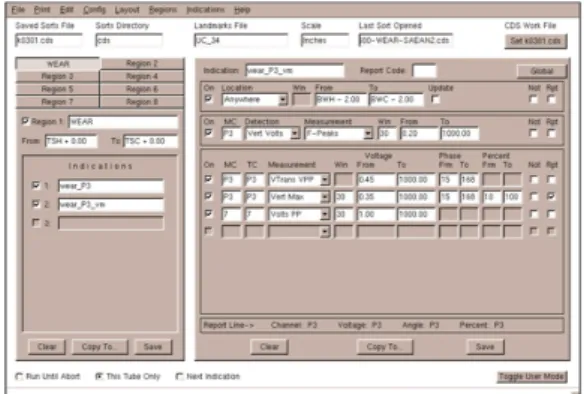
Fig. 2 CDS automated analysis software
mechanism. In order to use this during a nuclear site inspection, the automated analysis software should be adjusted to fit such variables as, for example: defect location, detection frequency, signal degree, and voltage that are characteristic of steam generator model and its defect. In this study automated analysis software called CDS (computer data screening) made by Zetec was used as shown in Fig. 2 [1].
2.2 Analysis of Axial Crack Signal Characteristics
Inputting accurate variables in the automated analysis software is the most important factor in the ECT automated analysis, because the detection results depend on how the variables were selected. In other words, the selected variables strongly affect the inspection results such as the detectability and the number of detections.
Adequate variables for the automated analysis software can be obtained by analyzing the exact ECT signal characterization. To reduce miscalls and minimize the detection of falsecalls, the eddy current signal characteristics should be understood when carrying out a signal analysis for each channel. After completing this process, accurate variables can be set. Therefore, the ECT signal of axial cracks should be analyzed before setting the variables.
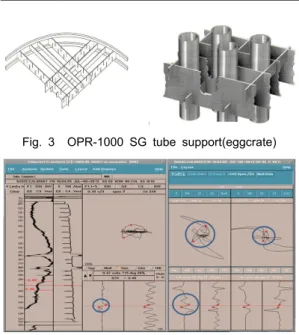
The axial cracks in an OPR1000 steam generator tube are mainly observed in the support area. The tube support structure of an OPR1000 steam generator consists of two and one inch height plates and has a lattice-like appearance, so it called the “eggcrate”. (see Fig. 3)
In the eddy current bobbin probe inspection,
axial crack signals are reported by the DSI
(distorted support indication). As illustrated in
Fig. 4, The combined signal of the axial crack
and the support plate is within the DSI because
axial crack exists in the support area.
Fig. 3 OPR-1000 SG tube support(eggcrate)
Fig. 4 Axial ODSCC ECT signal(OPR-1000 SG)
Generally, analysis channel at support plate region is selected process channel. Process channel minimize support plate signal so easily detect flaw signals in the support plate region.
The results of DSI signal analysis, process channel P1 (550-150 kHz) is easy to detect for support plate edge region but channel 3 (300 kHz) is better for the other region.
2.3 Detection Criteria
Automated analysis results depend on the variable setting values so detection criteria is needed. So detection criteria for DSI was decided by referring to AAPDD and EPRI QDA (qualified data analyst) qualification acceptance criteria [2,3].
≥ 40% TW(Through Wall) <40%
TW Remarks Detection POD of at least 80%
at a 90% CL ≥80%
RMSE ⪯ 10% sizing
Table 1 AAPDD acceptance criteria
POD : probability of detection CL : confidence level
RMSE : root mean square error
≥40% TW <40%
TW Remarks Detection POD of at least 80%
at a 90% CL ≥80%
Minimum number of
flaws
11 -
False Call ⪯ 10%
RMSE ⪯ 10% sizing
Table 2 QDA qualification acceptance criteria
The goal of automated analysis is to avoid missing the degraded signals of ECT data.
Therefore, the detection criteria of DSI was not considered a false call rate, as in the same as case as foreign nuclear power plants. DSI signals are do not perform sizing. Automated analysis detection is criteria determined based on the as follow Table 3.
Detection Criteria DSI POD of at least 80%, at a 90% CL Table 3 Automated analysis detection criteria for DSI
2.4 Calculation of POD
As shown in Fig. 5, POD was calculated applying EPRI program based on the following equation[3,4].
( ) px p
n x
x n x p n n x
P −
−= − ( 1 )
)!
(
!
, ! (1)
P : probability density function of binomial distribution
x : number of detection n : number of data p : probability of detection
Fig. 5 POD calculator program(EPRI)
2.5 Results
In this study, the results of automated analysis meet more than the detection criteria (80% POD at 90% CL). First, an analysis was performed using EPRI AAPDD axial ODSCC variables of crack signals. In this case, the result of POD at 90% CL is 56.8%. This value was below the required detection criteria 80%.
Set Total Detection Missing False call
AAPDD 109 69 40 271
Table 4 Number of detection on applying AAPDD variables
Set Detection rate(%)
Missing rate(%)
POD at 90% CL results
AAPDD 63.3 36.7 56.8% Fail
Table 5 Results of applying AAPDD variables
The analysis for detecting the cracks was performed by applying four sets of variables to decide variables satisfying the detection criteria.
The variables of Set-4 met the criteria. The adjustments or additions of key variables were made to improve the detectability and reduction of falsecalls. Since the axial cracks only appeared in the hot-leg side of the steam generator, the detection area in Set-1 was limited. As a result the falsecall rate was reduced. The detection rate increased in the Set-2 by lowering the value of the signal amplitude after reflecting the results reviewed in the set. In order to reduce false calls channel 7 (20 kHz) was added in Set-3. Channel 7 (20 kHz) was used to separate eggcrate support contact regions and free-span. Support contact region signals were detected by Channel P1 (550 kHz-150 kHz) and other region signals were detected by Channel 3 (150 kHz).
In the case of Set-4 set, bandpass filter process channel P15 (550 kHz-150 kHz, band- pass), was added in order to reduce falsecall rates caused by signal noise. From the results of
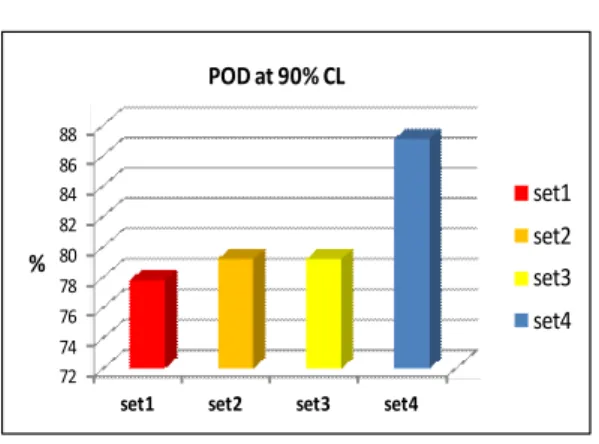
performing the automated analysis with Set-4 set, the POD of over 80% at a 90% CL was obtained.
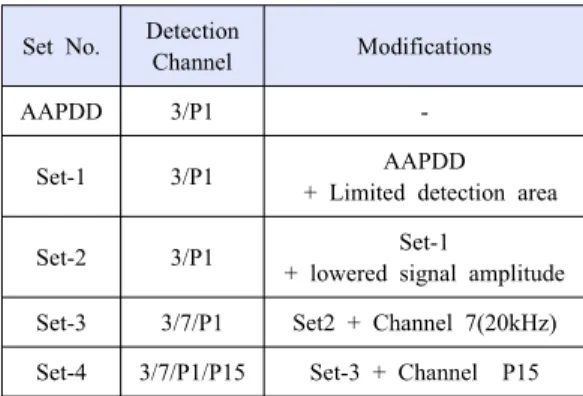
Set No. Detection
Channel Modifications
AAPDD 3/P1 -
Set-1 3/P1 AAPDD
+ Limited detection area
Set-2 3/P1 Set-1
+ lowered signal amplitude Set-3 3/7/P1 Set2 + Channel 7(20kHz) Set-4 3/7/P1/P15 Set-3 + Channel P15
Table 6 History of set modifications
Set No. Total Detection Missing False call
set1 222 181 41 1374
set2 222 184 38 1423
set3 222 184 38 680
set4 222 200 22 532
Table 7 Number of detection on applying each set
Set Detection rate(%)
Missing rate(%)
POD at 90% CL results
set1 81.5 18.5 77.8 Fail
set2 82.9 17.1 79.2 Fail
set3 82.9 17.1 79.2 Fail
set4 90.1 9.9 87.1 Pass
Table 8 Results of applying each set variables
Channel Variable range
Signal amplitude
⪯15 volts at ch.7
ch.3 15~160°
P1 0.05 volts at 10~170°
P15 0.03 volts
Signal amplitude
15 volts at ch.7
P1 0.16 volts at 20~170°
P15 0.07 volts at 25~160°
Detection area Hotleg side support plates Table 9 Set-4 variables
72 74 76 78 80 82 84 86 88
set1 set2 set3 set4
%
POD at 90% CL
set1 set2 set3 set4
Fig. 6 History of set POD