Abstract
This paper examines the effect of impulsiveness of euro on Indian stock market. In order to examine the problem, we select rupee-euro exchange rates and S&P CNX NIFTY and BSE30 SENSEX to represent stock price. We select euro as it consid- ered as second most widely used currency at the international level after dollar. The data are collected a daily basis over a period of 3-Apr-2007 to 30-Mar-2012. The statistical and time series properties of each and every variable have examined us- ing the conventional unit root such as ADF and PP test.
Adopting a generalized autoregressive conditional hetero- skedasticity (GARCH) and exponential GARCH (EGARCH) mod- el, the study suggests a negative relationship between exchange rate and stock prices in India. Even though India is a major trade partner of European Union, the study couldn’t find any significant statistical effect of fluctuations in Euro-rupee ex- change rates on stock prices. The study also reveals that shocks to exchange rate have symmetric effect on stock prices and exchange rate fluctuations have permanent effects on stock price volatility in India.
Keywords: Euro, Stock price, Unit root, GARCH, India.
JEL Classification Codes: E44, F31, F37, G01, G15.
1. Introduction
Foreign exchange market and stock market are the most im- portant constituents of a financial system. Foreign exchange market deals in foreign exchange and it is reflected in exchange rates, as stock market deals in shares of corporate and it is re- flected by share prices. In recent years, the intellectual curiosity of researchers and investors has much focused to examine the link between exchange rate and stock price. This is partly due to the advent of floating exchange rate regime, relaxation of
* Lecturer in Economics, PG Department of Economics, Calicut University Centre, Kadmat, Union Territory of Lakshadweep, India. [E-mail:
[email protected]]
Government control over international trade and adoption of lib- eral policy regarding import and removal of restriction on foreign investment. Many factors, such as enterprise performance, divi- dends, stock prices of other countries, gross domestic product, exchange rates, interest rates, current account, money supply, employment, their information etc. have an impact on daily stock prices (Kurihara, 2006). Kim (2003) has reported that the un- precedented increases in the volume of world trade and free capital movements across the nations have increased the role of exchange rate in profitability and equity prices.
Exchange rate is one of the important and most confusing risk elements in the stock market. There is a common belief that, stock prices are significantly affected by ups and downs in the exchange rate. The variation in exchange rate affects the firm value and the firm value is reflected in its share prices. A booming stock market will attract foreign investment, and it will lead to the inflow of foreign exchange and the resulting rise in the value of domestic currency. The opposite also may happen in case of falling stock prices. In an open economy, the expect- ations of relative currency values influence the level of domestic and foreign interest rates, which in turn affect the present value of a firm’s assets. Similarly the firms and corporations use the foreign exchange market for a variety of purposes related to their operations such as payment for imports, conversion of ex- port receipts, hedging of receivables and payables, payment of interest on foreign currency loans, placement of surplus funds and so forth. This suggests that exchange rates play a crucial role in the movement of stock prices.
2. Theoretical Explanations
The theoretical support for the impact of exchange rate on stock prices is very strong. The impact of exchange rates on stock prices can be explained with the help of two approaches, one is goods market approaches and another one is Portfolio balance approach.
Goods market approach by Dombusch and Fischer suggest that changes in exchange rates affect the competitiveness of a firm as fluctuations in exchange rate affects the value of the earnings and cost of its funds as many companies borrow in foreign currencies to fund their operations and hence its stock Print ISSN: 2288-4637 / Online ISSN 2288-4645
doi: 10.13106/jafeb.2015.vol2.no3.17
An Exponential GARCH Approach to the Effect of Impulsiveness of Euro on Indian Stock Market
2)
Sahadudheen I*
[Received: July 2, 2015 Revised: August 4, 2015 Accepted: August 10, 2015]
price. A depreciation of the local currency makes exporting goods attractive and leads to an increase in foreign demand and hence revenue for the firm and its value would appreciate and hence the stock prices. On the other hand, an appreciation of the local currency decreases profits for an exporting firm be- cause it leads to a decrease in foreign demand of its products.
We can conclude from the above premises that appreciation in exchange rate is negatively related to the stock prices of the exporting firm and positively related to stock price of importing firm.
Portfolio balanced approach stresses that exchange rate are determined by the fluctuation in the equity market and work un- der the demand and supply framework. An upward moving stock market of the country grabs the attention of the foreign in- vestors to invest in the stock and diversify their portfolios;
hence the upward movement brings more foreign currency to the country and increases the demand for the local currency, which leads to appreciation of the local currency. On the other side, when the stock market falls, the stocks lose its attraction to be added in the portfolio. And the investors then sell out their stocks to avoid further losses this leads to lower demand for local currency and the local currency depreciates. As a re- sult the upward (downward) movement of the stock market of country will lead to appreciate (depreciate) the exchange rate of the country.
3. Literature Review
While both goods market and portfolio theory suggests that changes in exchange rate can have an important impact on the stock price, there is no conclusive empirical results has established. Some studies support negative association, while some studies support positive relation. The early studies, which examined the stock price-exchange rate link shows no valid pat- tern of responses by stock prices to exchange rate (e.g., Ang &
Ghallab, 1976; Franck & Young, 1972). This result may be at- tributed to the fixed exchange rate regime of Bretton Woods era. After the advent of floating exchange rate regime, the role of exchange rate in influencing macroeconomic and financial variables has been heightened.
Aggarwal (1981) was the first to examine the link between stock price and exchange rate and found a positive significant correlation between the two variables in U.S. On the other hand the studies by Soenen and Hennigar (1988), Goodwin et al.
(1992), Ibrahim and Aziz (2003) and Kim (2003), suggested a negative link between the stock prices and the exchange rates.
As a contrary to the above said studies Solnik (1987) and Ong and Izan (1999) suggested that changes in exchange rates do not have any significant impact over stock prices.
Enormous number of studies has been examined the causal relationship between exchange rate and stock price using grang- er causality technique. Some studies support a unidirectional causality from exchange rate to stock price; some studies from stock price to exchange rate and some studies support bidirec-
tional causality. Most of the studies suggested a unidirectional causality from stock price to exchange rate. Bhmani et al.
(1992) examined both short run and long run relationship be- tween stock price and exchange rate and found one way causal relationships from stock prices to exchange rates in short run, and no causal relationship in the long run. Libly (1993) sug- gested a unidirectional causality which moves from stock prices to exchange rate.
The study by Ajayi et al. (1998) reported a one way causal relation from the stock market to the exchange rate in Indonesia and the Philippines, while in Korea it runs in the opposite direction. They couldn’t find any significant relation in Hong Kong, Singapore, Thailand, or Malaysia. However, in Taiwan, they detected a two-way relationship. Granger, Huang and Yang (2000) conducted a detailed study of the Philippine and South Korean market and concluded that in Philippine the unidirec- tional causality exists between stock market and exchange rate, and the direction of the causality is from stock price to ex- change rates. Mansoor (2000), found no long run relationship between stock prices and exchange rates, but found unidirec- tional causal relationship from stock prices to exchange rates in short run. Hatemi-J and Irandoust (2002) suggested a unidirec- tional causality running from stock prices to exchange rates. On the contrary to above study Yu (1997) detected a unidirectional causality from exchange rates to stock prices for Singapore, and bidirectional causality for Tokyo Market during the period from 1983 to 1994.
A detailed study made by Erbaykal and Okuyan (2007) for 13 developing countries suggested a unidirectional causality from stock price to exchange rates in the five countries, a bidirec- tional causality in the three economies and no relation found in remaining economies. Similarly Doong et al. (2005) studied the relationship between stock price and exchange rate for Asian countries and detected bidirectional causality in Indonesia, Korea, Malaysia, and Thailand.
A sizable number of studies have tried to examine the long run association using cointegration approach. Nieh and Lee (2001) examine the relationship between stock prices and ex- change rates for G-7 countries and find that there is no long-run equilibrium relationship between stock prices and ex- change rates for each G-7 countries. Similarly by taking 45 years of U.S quarterly data, Ozair (2006) investigated the link between stock prices and exchange rates and showed no caus- al linkage and no cointegration between these two financial variables.
The studies on the link between exchange rate and stock
market are relatively spheres in India and the existed studies
shows mixed results. One of the earliest studies conducted by
Abdalla and Murinde (1997) detected a unidirectional causality
from exchange rate to stock prices in India. Smyth and Nandha
(2003) also find a unidirectional causality running from exchange
rates to stock prices for India and Sri Lanka. On the contrary to
the above result, Muhammad and Rasheed’s (2002) study on
the exchange rates and stock price relationships for Pakistan,
India, Bangladesh and Sri Lanka shows no any significant rela-
tion between exchange rates and stock prices in India. Similarly
Bhattacharya and Mukherjee (2003) suggested that there is no significant relationship between stock prices and exchange rates in India.
Even though, there are enormous studies focusing on ex- change rate and stock price relationships, to the best of our knowledge, we find some drawbacks of existing works. Firstly, no studies examined the effect of impulsiveness of euro ex- change rate on Indian stock market. Second, the studies that examined the link between exchange rate and stock prices overwhelmingly applied the traditional econometric tool of Granger causality test and cointegration. The studies with the application of new financial econometrics model such as GARCH and EGARCH model are hard to find.
The main objective of the paper is to examine the effects of impulsiveness of Euro-rupee exchange rates on two major stock price indices in India such as S&P NIFTY and SENSEX.
4. Data and Methodology
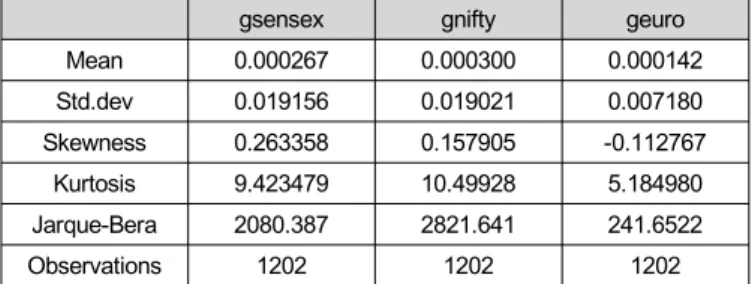
In order to examine the problem, the following secondary da- ta are used. We select rupee-euro exchange rates and S&P CNX NIFTY and BSE30 SENSEX to represent stock price. We select euro as it considered as second most widely used cur- rency at the international level after dollar. The data are col- lected a daily basis over a period of 3-Apr-2007 to 30-Mar-2012. The daily data on rupee-euro exchange rates are collected from Handbook of Statistics on Indian Economy (www.rbi.org.in), while the daily data on S&P CNX NIFTY and BSE30 SENSEX are collected from the official website of National Stock Exchange (NSE) and Bombay Stock Exchange (BSE) respectively. The statistical and time series properties of each and every variable have been examined using the conven- tional unit root such as ADF and PP test. In order to check for the effect of impulsiveness of euro on Indian stock market, re- turn on euro and stock price are used and employed GARCH and EGARCH models.
The conventional econometric models keep the variance of the disturbance term as constant over time, but exchange rate and stock price series exhibit volatility clustering, i.e.in some pe- riod a unusually high volatility followed by more tranquil periods of low volatility. There for in such cases it is clear that the as- sumption of constant variance is limiting and application of OLS method provides biased variance estimate; hence, inference based on OLS estimates will be misleading. So in such cases, it is better to examine not the unconditional variance but the conditional variance. For that we employ generalized autore- gressive conditional heteroskedasticity (GARCH) of Bollerslev and exponential GARCH (EGARCH) of Nelson for daily data to investigate the link between exchange rate and stock price.
The returns on exchange rate and stock price can be calcu- lated using the following formula,
) log(
−1
=
t t
t
y
r y
Where yt and yt 1 are exchange rate and stock prices for – the periods t and t-1. Let denotes greur, grnif and grsen be the daily returns on euro-rupee exchange rate, nifty and sensex respectively.
The general form of Mean and GARCH-M Equation can be written as
t t
t
x
gry = α + β + ε
We can also consider alternative mean equation, which can be written as gry
t= α + β x
t+ ξσ
t2+ ε
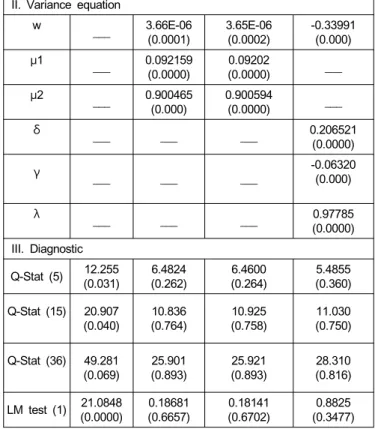
tThe variance equation for both GARCH and GARCH-M model can be written as
q t p t
t2
= ψ + μ
1ε
2 −+ μ
2ε
2−σ
The variance equation for the EGARCH model can be written as
) log(
2 ) (
)
log(
2 2t qq t
p t q
t p
t
t −−
−
−
−