• 검색 결과가 없습니다.

Influences of Product Attributes and Lifestyles on Consumer Behavior: A Case Study of Coffee Consumption in Indonesia

N/A
N/A
Protected

Academic year: 2021

Share "Influences of Product Attributes and Lifestyles on Consumer Behavior: A Case Study of Coffee Consumption in Indonesia"

Copied!
12
0
0

로드 중.... (전체 텍스트 보기)

전체 글

(1)

Print ISSN: 2288-4637 / Online ISSN 2288-4645 doi:10.13106/jafeb.2021.vol8.no5.0939

Influences of Product Attributes and Lifestyles on Consumer Behavior: A Case Study of Coffee Consumption in Indonesia

Adi Prasetya UTAMA

1

, Ujang SUMARWAN

2

, Arif Imam SUROSO

3

, Mukhamad NAJIB

4

Received: January 30, 2021 Revised: April 05, 2021 Accepted: April 15, 2021

Abstract

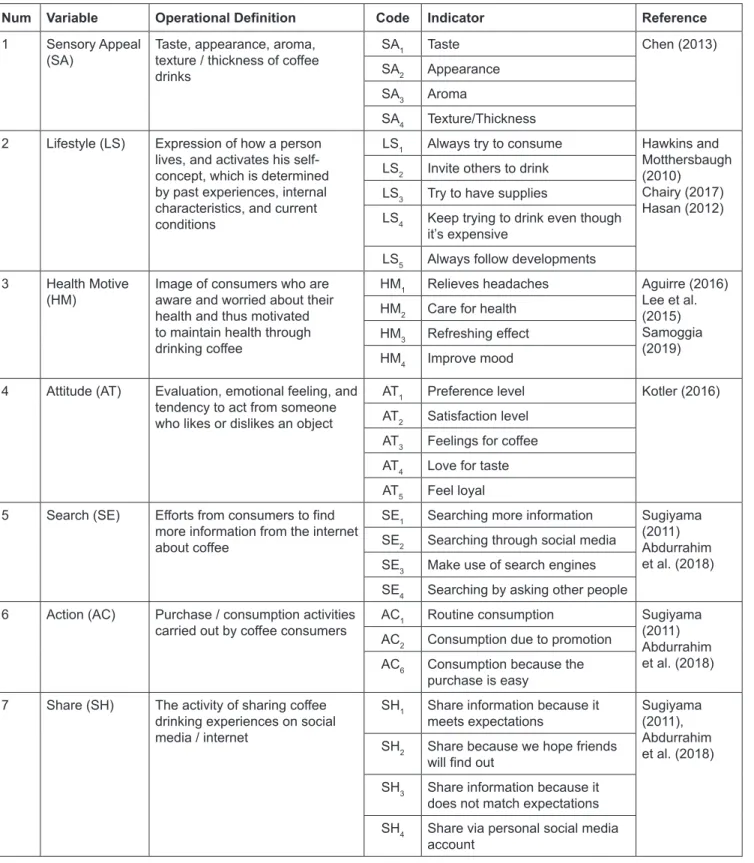
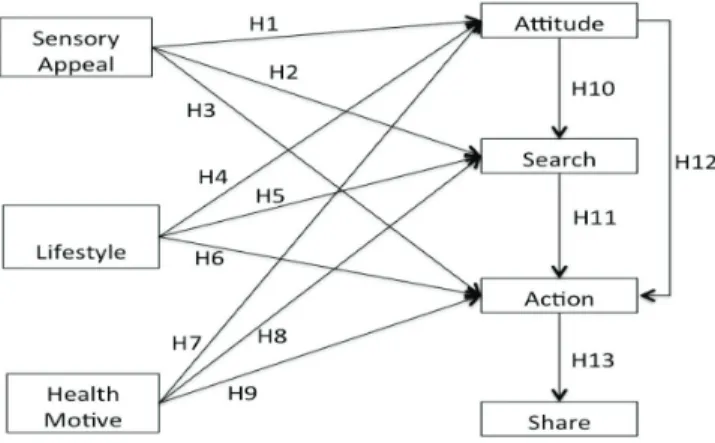
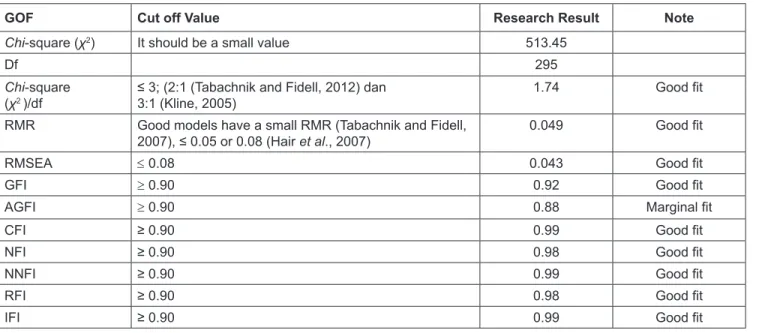
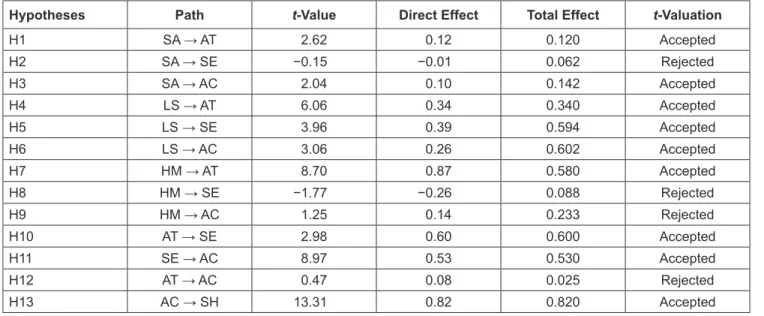
The purpose of this study was to measure the significance and contribution of sensory appeal, lifestyle, and health motive in determining coffee drink consumption. The theory adopted is the SOR (stimulus-organism-response) theory and the AISAS (attention-interest- search-action-share) model approach. Data was collected online in April–May 2020, and obtained 413 valid respondent data. The data were processed using SEM (Structural Equation Modeling) framework. The results showed that the variable sensory appeal of coffee drinks, lifestyle variables and health motive variables had a significant effect on coffee consumption. Of the 13 hypotheses proposed, nine hypotheses are accepted and four hypotheses are rejected. Sensory appeal has a positive effect on attitude and action of coffee consumption. Lifestyle has a positive effect on attitude, search, and action, whereas health motive has a positive effect on attitude of coffee consumption. Lifestyle variables have the greatest role in determining coffee consumption, followed by health motive variables and sensory appeal of coffee drinks. The SOR theory and the AISAS approach can both be used to analyze coffee drinking behavior.

The research suggests that, to increase coffee consumption, a marketing approach should touch the lifestyle of the community and increase the promotion of the health aspects of coffee drinks.

Keywords: Coffee Consumption, Lifestyle, Health Motive, Sensory Appeal, Product Attributes JEL Classification Code: M310, C520, I120, Z130

in 2018 to 10,109,460 tons, in 2019 to 9,871,800 tons, and in 2020 reaching 9,997,680 tons.

Although globally there has been a significant increase in consumption, the gap in coffee consumption per capita is still relatively high between developed and developing countries.

Coffee consumption per capita in developed countries in 2020 is relatively high, including Norway 10.3kg/year, Switzerland 7.4 kg/year, European Union 5.9 kg/year, USA 4.9 kg/year, Brazil 5.0 kg/year, while consumption of coffee drinks in many developing countries is relatively low, namely, Indonesia only 1.4 kg/year, Vietnam 1.7 kg/

year, the Philippines 1.8 kg/year, Thailand 1.3 kg/year (ICO, 2021). Given this large gap, it is possible to increase coffee consumption in developing countries.

The level of coffee consumption is determined by many factors. Samoggia and Riedel (2018) in their literature review grouped several determinants of coffee consumption, including (1) personal preferences, (2) economic attributes, (3) product attributes, (4) context of consumption, and (5) socio-demographics. However, they also noted that scientific knowledge of the motives and characteristics of coffee consumption is actually

1

First Author and Corresponding Author. Ph.D. Student, School of Business, IPB University, Bogor, Indonesia [Postal Address: Jl. Raya Pajajaran, Babakan, Bogor Tengah, Bogor 16151, Bogor, Indonesia]

Email: prasetya_dmb12@apps.ipb.ac.id; adi_utama@yahoo.com

2

Professor, Department of Family and Consumer Sciences, Faculty of Human Ecology, IPB University, Bogor, Indonesia.

Email: sumarwan@apps.ipb.ac.id

3

Associate Professor, School of Business, IPB University, Bogor, Indonesia. Email: arifimamsuroso@apps.ipb.ac.id

4

Associate Professor, Department of Management, IPB University, Bogor, Indonesia. Email: najib@apps.ipb.ac.id

© Copyright: The Author(s)

This is an Open Access article distributed under the terms of the Creative Commons Attribution Non-Commercial License (https://creativecommons.org/licenses/by-nc/4.0/) which permits unrestricted non-commercial use, distribution, and reproduction in any medium, provided the original work is properly cited.

1. Introduction

World coffee consumption has increased significantly

from year to year. International Coffee Organization (2021),

states that world coffee consumption is increasing with an

average growth of 1.1% per year. The same source states that

coffee consumption in 2017 was 9,682,620 tons, increasing

(2)

incomplete due to research that often focused on a limited number of issues.

Several studies specifically reveal that there are several factors that influence a person’s preference and intention to drink coffee, including lifestyle factors and health concerns (Najib et al., 2020). Chairy (2017) examines the effect of several independent variables (namely, spirituality, environmental care, health care, and lifestyle) on the intention to consume coffee drinks. The results of his research indicated that spirituality and lifestyle influenced the intention to consume organic coffee positively and significantly. On the other hand, the effect of caring for the environment and caring for health on the intention to consume organic coffee is not significant. Several other studies, however, have shown that there is a positive relationship between consumption of coffee drinks with the attractiveness of coffee taste (Hashim et al., 2017; Li et al., 2019) and concern for health with coffee consumption (Aguirre, 2016; Lee et al., 2018).

Some inconsistencies were found in how these factors influenced the level of coffee drink consumption. Health considerations, for example, on the one hand encourage people to drink coffee because of its refreshing and improves mood, but at the same time for others, worrying about the negative effects of drinking coffee (Samoggia &

Riedel, 2018).

Several theories and approaches have been considered by researchers to analyze coffee drinking behavior. This study tries to adopt the theory of SOR (Stimulus, Organism, Response) (Belk, 1975; Hovland & Weiss, 1953) with further development in the form of adopting the AISAS Model (Awareness, Interest, Search, Action and Share) approach, which was first proposed by Dentsu (Sugiyama

& Andree, 2011).

The purpose of this study is to measure and compare the significance and contribution of sensory appeal, lifestyle, and health concerns together in determining the level of coffee drink consumption. Furthermore, based on the findings of the research, the implications of the appropriate coffee beverage marketing strategy could be compiled.

2. Literature Review

2.1. Consumption of Coffee Drinks Measure of coffee drinking behavior

Several previous studies on coffee drinking behavior tried to measure the influence of various factors on coffee drinking behavior. What is meant by behavior in research on coffee includes the habit of drinking coffee (Hewlett &

Wadsworth 2010), intention (interest) to drink coffee (Ave et al., 2015; Chairy, 2017; Chen & Lee, 2015; Lee et al., 2015; Li et al., 2019), interest in re-consuming/buying coffee (revisit/repurchase intention) (Hashim et al., 2017; Ting &

Thurasamy, 2016; Wang & Yu, 2016;), frequency of drinking coffee (Aguirre, 2016), coffee drinking culture (Aguirre, 2017), coffee drinking satisfaction (Chen & Lee, 2015; Kim

& Lee, 2017; Li et al., 2019), coffee drinking loyalty (Suhud et al., 2017), and the quality of the drinking experience coffee (experiential quality) (Sinniah et al., 2018).

Health Concerns

Several studies have included the consideration of health factors as one of the variables of coffee drinking behavior, including Aguirre (2016), Hewlett and Wadsworth (2012), and Lee et al. (2015), who generally conclude that health considerations are a significant predictor of coffee drinking behavior. Regarding different items, Tran et al. (2020) reveal that fresh fruit consumers purchase decision is influenced very much by health consciousness, rather than influenced by marketing mix factors. Moreover Nguyen et al. (2020) show that health consciousness affects attitude and intention towards purchasing green products.

Hewlett and Wadsworth (2012) state that coffee and tea drinking patterns are largely determined by demographic factors, health and lifestyle considerations. There is an association between drinking coffee and drinking alcohol and smoking. Furthermore, consumption of caffeinated coffee drinks is associated with a greater likelihood of consumers under 40 years of age, female gender, have lower anxiety but higher depression and are more likely to smoke. Consumption of decaf coffee shows an age link where the highest proportion of consumers and consumption levels appear to be around the 50s age group.

Consumers of non-caffeinated beverages were more likely to be over 30 years of age and to take prescription drugs, while groups of consumers who drank no tea/coffee were more likely to be under 30 years of age and not use prescription drugs.

Hewlett and Wadsworth (2012) further show that consuming decaffeinated beverages (compared to drinks containing caffeine) is associated with the likelihood of using vitamin or herbal supplements, not smoking, drinking moderate amounts of alcohol, and taking prescribed medications. This is consistent with the finding that consumers avoid caffeine for health reasons. Although there is a lot of recent evidence to suggest that caffeine is beneficial for an aging brain.

Lee et al. (2015), in a study in South Korea, found

that there are health considerations, levels of trust, and

protection in the environment that affect the intention to

buy/consume organic coffee drinks. His research confirms

the role of health considerations, level of trust, and ethics in

consumer behavior, especially organic coffee. Furthermore,

Lee et al. (2015) stated that when consumers have a high

level of ethical concern, health motives have a significant

positive impact, but sensory appeal has a negative impact on

(3)

perceived behavior control. In contrast, among consumers with a low level of ethical concern, health motives did not have a significant effect on perceived behavioral control.

However, sense attraction has a significant positive effect.

This means that, among those who have a high level of ethical concern, control of consumer behavior to buy organic coffee is influenced by considerations of the social impact on their health, while among those with low ethical awareness, behavioral control will be more influenced by sensory attributes as a personal value.

Aguirre (2016) in his research in the context of Costa Rica, found that the most important factors determining the consumption of coffee drinks, in order of the most important are gender, family as a source of information, health, amount spent, aroma, anti-migraine effect, family traditions, taste, and energy effects. In his research, coffee drink consumption behavior was measured by the frequency of drinking coffee in one day, namely, by the category of 1–2 cups a day, 3–4 cups a day, 5–6 cups a day, and over 6 cups a day. The results showed that the average Costa Rican 23% drank 1–2 cups, 41% drank 3–4 cups and 36% drank 5–6 cups, and none of them drank more than 6 cups.

His research confirms that gender, health, and cultural factors are significant predictors of consumption levels in Costa Rica. This study also revealed that the people of Costa Rica generally think that coffee has a positive effect on their health, including in the form of fitness levels, reducing migraines and its effect as a refresher. In addition, cultural factors in the form of family and family traditions as sources of information related to coffee indicate that cultural factors are very important and significant as predictors of the level of coffee drinking frequency for Costa Rican residents.

However, Chairy (2017) presents different results in his research on health factors in the consumption of organic coffee drinks among young people in Indonesia. Aguirre (2016), Hewlett and Wadsworth (2012), and Lee et al.

(2015), in general conclude that health considerations are a significant predictor of coffee drinking behavior. However, Chairy (2017) actually reveals the effect of health care on the intention to consume organic coffee among young people, which turns out to be insignificant. This means that young people in Indonesia relatively do not consider health factors in consuming organic, but pay more attention to other factors. This is different from the context of Costa Rica, where people generally consider drinking coffee to be healthy. These differences suggest that while there is ample evidence that drinking coffee can have beneficial health effects, consumer confidence in the health benefits of coffee may not always be clear (Samoggia & Riedel, 2019).

Samoggia & Riedel (2018) question consumer research that has not systematically explored the issue of what consumers think about the effects of coffee on their health, and how this affects their consumption.

Sensory Appeal

Another variable that has been widely studied regarding coffee drinking behavior is the one related to sensory appeal, among others by Ave et al. (2015), Hashim et al. (2017) Lee et al. (2015), Li et al. (2019), Ting and Thurasamy (2016), and Wang and Yu (2016). Ave et al.

(2015) found that sensory appeal, namely scent (aroma) and sight (appearance) had a significant effect on the consumption behavior of coffee drinks in coffee shops.

Wang and Yu (2016) state that the sensory variable has a significant effect on hedonic value and subsequently has a significant effect on repurchase interest. Hashim et al. (2017) also indicated that product quality and price of coffee drinks were the most influential factors on the frequency of visits to coffee shops. These qualities include the taste, color and aroma of coffee. Meanwhile, the location and atmosphere of the cafe do not really matter, because consumers are repeat visitors.

Li et al. (2019) showed that compared to objective sensory information (origin, variety, and production practice) and without information, subjective sensory information (aroma, taste, product condition) resulted in a higher taste rating and a higher level of preference for coffee.

This subjective information further positively influences the likelihood of purchasing coffee.

However Lee et al. (2015) in their research on the consumption of organic coffee drinks in South Korea found that the sensory appeal factor was not significant in determining the attitude of coffee drink consumption.

Or in other words, in relation to the consumption of organic coffee drinks in South Korea, there are things that are considered more important than the quality of the senses (taste, color and aroma) of coffee, namely, health considerations, trust in coffee product labels and environmental considerations, as indicated by the significance in statistical analysis.

Lifestyle

In addition to health factors and sensory appeal, many researchers show that lifestyle factors influence or are associated with certain food/beverage consumer behavior (Basha et al., 2015; Kouy et al., 2016; Tremblay &

Panahi, 2017). Basha et al. (2015) and Najib et al. (2021) show that lifestyle is one of one’s motives for consuming organic products. An environmentally friendly lifestyle significantly influences the intention to buy organic products.

Lifestyle variables of coffee consumers have been

studied by, among others, Chairy (2017), and Hewlett and

Wadsworth (2010), whose results are in line with researchers

regarding food consumption, that lifestyle variables have

a significant effect on coffee drinking behavior. Chairy

(2017) shows that a lifestyle with spirituality affects a

(4)

person’s intention to drink coffee. What is meant by lifestyle here is related to how a person lives, namely his activities, interests, likes, attitudes, consumption, expectations and feelings. A person’s lifestyle affects all aspects of his consumption behavior.

Wang et al (2005), in a study to verify the relationship and influence between consumption behavior (such as consumer lifestyle and consumption motives) and purchasing decision-making behavior for canned coffee, revealed that (a) different lifestyles have a significant effect on the amount of consumption and purchasing decision making; (b) different consumption motives have a significant effect on the amount of consumption and the level of preference for usage behavior and purchasing decision making. Moreover, Zahra and Anoraga (2021) also show that there is a positive relationship between lifestyle and consumptive behavior patterns of students towards goods that are less needed.

2.2. Theory of Stimulus Organism Response (SOR)

The theory of S-O-R (Stimulus Organism Response) proposed by Hovland et al. (1953) was born because of the influence of psychology in communication science. This can happen because psychology and communication have the same object of study, namely the human soul; which includes attitudes, opinions, behavior, cognition, affection and conation. The basic assumption of S-O-R theory is that the causes of behavior change depend on the quality of the stimuli that communicate with the organism.

The SOR model consists of the stimulus as the independent variable, the organism as the mediator, and the response as the dependent variable (Maclnnis et al., 1998;

Turley & Milliman, 2000; Vieira, 2013). Most research in retail has adopted the Mehrabian and Russell (1974) model and introduced the Stimulus-Organism-Response (SOR) model, which requires a stimulus, a series of mediating variables, and a behavioral response (Maclnnis et al., 1998;

Turley & Milliman, 2000; Vieira, 2013). The model indicates that the created environment (S-Stimulus) can influence the customer’s mood (O-Organism), which generates a behavioral response (R-Response).

Most of the past literature has reviewed the complete SOR model as a conceptual paper, but empirical studies are still rare (Walsh et al., 2011). In his writings on Situational Variables and Consumer Behavior, Belk (1975) describes the relationship between Organism Stimulus and Response.

In his description, the situational stimulus and product (object) stimulus will directly influence the emotional side of consumers, and will further influence consumer behavior.

2.3. AISAS Model

The AISAS (attention-interest-search-action-share) model was developed by the Japanese advertising agency Dentsu, who was once the world’s largest advertising agency in 1974. When in need of high-involvement goods, customers will do a deeper search than when need of low-involvement stuff. Therefore, Dentsu proposes a marketing communication model obtained from technological developments, which is named the AISAS model (Sugiyama & Andree, 2011).

The AISAS model is considered to be more relevant to significant changes in consumer behavior in the times where technology has led to the Internet and digital era when compared to previous consumer behavior patterns.

Sugiyama and Andree (2011) explain that this change in behavior patterns is driven by the rapid development of Internet technology so as to create a digital or online era.

The communication strategy is directed at creating scenarios that direct consumers to voluntarily seek information about products, buy products, and then spread positive word- of-mouth to other consumers. Abdurrahim et al. (2019) confirm that the AISAS model can be used to analyze the effect of tourism destination in social media. Moreover, in the context digital consumers, research conducted by Najib and Fahma (2020) noted that attitude positively influences consumer’s action.

As described by Sugiyama and Andree (2011), it can be seen that the Attention and Interest (AI) variable is a single psychological process. This is different from the Search, Action and Share (SAS) variables, which are more of a behavioral process as a result of the AI process.

In accordance with Sugiyama and Andree’s opinion, the psychological process of attention and interest is at the Organism stage in SOR Theory. Moreover the AISAS model does not have to run sequentially; attention, interest, search, action, share. One or two parts of the stages could be skipped. So, it can be said that the AISAS model is not a linear process, but a cycle, where after the sharing process, it can return to the attention or search process.

2.4. Variables and Indicators

There are seven latent variables used in this study, namely, Sensory Appeal (SA), Lifestyle (LS), Health Motive (HM), Attitude (AT), Search (SE), Action (AC) and Share (SH). Sensory Appeal, Lifestyle and Health Motive variables are exogenous variables, while the variables of Attitude, Interest, Search, Action and Share are endogenous variables.

The description of the variables and indicators can be seen

in Table 1.

(5)

Table 1: Variables and Indicators of the Model

Num Variable Operational Definition Code Indicator Reference

1 Sensory Appeal

(SA) Taste, appearance, aroma, texture / thickness of coffee drinks

SA

1

Taste Chen (2013)

SA

2

Appearance SA

3

Aroma

SA

4

Texture/Thickness 2 Lifestyle (LS) Expression of how a person

lives, and activates his self- concept, which is determined by past experiences, internal characteristics, and current conditions

LS

1

Always try to consume Hawkins and Motthersbaugh (2010)

Chairy (2017) Hasan (2012) LS

2

Invite others to drink

LS

3

Try to have supplies

LS

4

Keep trying to drink even though it’s expensive

LS

5

Always follow developments 3 Health Motive

(HM) Image of consumers who are aware and worried about their health and thus motivated to maintain health through drinking coffee

HM

1

Relieves headaches Aguirre (2016) Lee et al.

(2015) Samoggia (2019) HM

2

Care for health

HM

3

Refreshing effect HM

4

Improve mood 4 Attitude (AT) Evaluation, emotional feeling, and

tendency to act from someone who likes or dislikes an object

AT

1

Preference level Kotler (2016)

AT

2

Satisfaction level AT

3

Feelings for coffee AT

4

Love for taste AT

5

Feel loyal 5 Search (SE) Efforts from consumers to find

more information from the internet about coffee

SE

1

Searching more information Sugiyama (2011) Abdurrahim et al. (2018) SE

2

Searching through social media

SE

3

Make use of search engines SE

4

Searching by asking other people 6 Action (AC) Purchase / consumption activities

carried out by coffee consumers AC

1

Routine consumption Sugiyama (2011) Abdurrahim et al. (2018) AC

2

Consumption due to promotion

AC

6

Consumption because the purchase is easy

7 Share (SH) The activity of sharing coffee drinking experiences on social media / internet

SH

1

Share information because it

meets expectations Sugiyama

(2011), Abdurrahim et al. (2018) SH

2

Share because we hope friends

will find out

SH

3

Share information because it does not match expectations SH

4

Share via personal social media

account

(6)

2.5. Research Model

In this study, the variables sensory appeal, lifestyles, and health motive were included as stimuli, attitude was included in the organism, and response consisted of search, action and share. The research design is described in Figure 1 as follows:

2.6. Hypotheses

The hypotheses in this study are as follows:

H1: Sensory Appeal has a positive effect on Attitude.

H2: Sensory Appeal has a positive effect on Search.

H3: Sensory Appeal has a positive effect on Action.

H4: Lifestyles has a positive effect on Attitude.

H5: Lifestyles has a positive effect on Search.

H6: Lifestyles has a positive effect on Action.

H7: Health Motive has a positive effect on Attitude.

H8: Health Motive has a positive effect on Search.

H9: Health Motive has a positive effect on Action.

H10: Attitude has a positive effect on Search.

H11: Search has a positive effect on Action.

H12: Attitude has a positive effect on Action.

H13: Action has a positive effect on Share.

3. Research Method

3.1. Location and Time of Research

The research location is in the territory of Indonesia, especially on the island of Java, which is the most populous area in Indonesia. Data collection was carried out through an online survey which was conducted in April–May 2020.

Questionnaires were distributed online in person and through social media that could be accessed by the public, including Facebook, Instagram, WhatsApp, and Telegram.

3.2. Sampling Method

The sampling method applied in this study is convenience sampling, which is part of the non-probability sampling. With the non-probability sampling method, every consumer who meets the population criteria does not have the same opportunity to be selected as a sample because the sample selection is based on the researcher’s decision (Malhotra, 2010). Convenience sampling is a data collection technique based on certain research criteria.

Convenience sampling is also used because the exact population size is unknown (Nurlaela et al., 2019). The criteria for respondents in this study are consumers who are used to drinking coffee at least once a week. Number of sample collected in this study are 420. However, after cleaning process, there are 413 samples can be continued to the analysis process.

3.3. Data processing

Data were processed using SEM (Structural Equation Modeling) framework and LISREL 8.80 applications.

4. Results and Discussion 4.1. Results

Based on the respondent profile data (Table 2), from a total of 413 respondents, 299 people (72%) were men, while 114 others (28%) were women. In addition, it is important to convey the age composition of respondents consisting of young respondents, namely, the Generation Z (born between 1995–2010), as many as 104 people (25%), and the Millennial Generation Y (born between 1980–1994), as many as 102 people (25%). While the older/mature generation consists of the Baby Boomers generation born between 1946–1964, as many as 27 people (6%), and the Generation X born between 1965–1979, as many as 180 people (44% of the respondents). With a composition of 50–50 between the younger generation and the mature generation, it can be said that this research reaches proportionally in all generations. It is also useful to mention that all respondents are coffee drinkers, as shown in Table 2.

The Goodness of Fit (GOF) test of the model (Table 3) shows that in general the model is good and acceptable in describing the interactions between variables in the model. Furthermore, the calculation of the reliability of the model, as can be seen in Appendix 1, results in Construct Reliability of 0.97 and Variance Extracted of 0.55.

According to Hair et al (2010), the minimum standard of CR is 0.7 and VE is 0.5. Although for the exploratory test the minimum standard of 0.6 and VE of at least 0.4 is still acceptable (Adawiyah et al., 2021).

Figure 1: Coffee Consumption Research Model

(7)

Table 2: Profile of Respondents

No Dimension Class Sum Percentage

1. Gender Men 299 72

Women 114 28

2. Generation Baby boomers 27 6

Generation X 180 44

Generation Y − Millennial 102 25

Generation Z 104 25

3. Education High School 74 18

Diploma 29 7

Bachelor 205 50

Post Graduate (master/doctor) 105 25

4. Job Private Employee/

Professional 78 19

Entrepreneur 32 8

Civil Servant/State’s company

employee 187 45

Student 72 17

Other 44 11

5. Drinking frequency Uncertain 75 18

1−3 times a week 72 17

Once a day 102 25

Twice a day 105 25

Three times a day 27 7

More than 3 times a day 32 8

Table 3: Analysis of the Suitability (Goodness of Fit Test) of the Overall Model

GOF Cut off Value Research Result Note

Chi-square (χ

2

) It should be a small value 513.45

Df 295

Chi-square

2

)/df ≤ 3; (2:1 (Tabachnik and Fidell, 2012) dan

3:1 (Kline, 2005) 1.74 Good fit

RMR Good models have a small RMR (Tabachnik and Fidell,

2007), ≤ 0.05 or 0.08 (Hair et al., 2007) 0.049 Good fit

RMSEA ≤ 0.08 0.043 Good fit

GFI ≥ 0.90 0.92 Good fit

AGFI ≥ 0.90 0.88 Marginal fit

CFI ≥ 0.90 0.99 Good fit

NFI ≥ 0.90 0.98 Good fit

NNFI ≥ 0.90 0.99 Good fit

RFI ≥ 0.90 0.98 Good fit

IFI ≥ 0.90 0.99 Good fit

(8)

Table 4 shows the outputs of the LISREL8.8 application, which shows the t-value of each variable in the model and its interaction with other variables. Based on the t-count test, it was found that of the 13 proposed hypotheses, nine hypotheses could be accepted and four hypotheses were rejected. The first six accepted hypotheses are H1 (Sensory Appeal has a positive effect on Attitude), H3 (Sensory Appeal has a positive effect on Action), H4 (Lifestyle has a positive effect on Attitude), H5 (Lifestyle has a positive effect on Search), H6 (Lifestyle has a positive effect on Action), and H7 (Health motive has a positive effect on Attitude). These results confirm several previous studies that there is a relationship between coffee taste, lifestyle, and health motives with coffee drinking behavior (Chairy, 2017).

Apart from these six hypotheses, three other acceptable hypotheses are related to the application of the AISAS model in the consumption of coffee drinks. The three hypotheses are H10 (Attitude has a positive effect on Search), H11 (Search has a positive effect on Action), and H13 (Action has a positive effect on Share). This is in line with what has been formulated by Sugiyama and Andree (2011), which states that there is a relationship between Attention, Interest, Search, Action and Share in relation to consideration of product purchases that require high involvement.

In this study, four hypotheses were rejected, namely, H2 (Sensory appeal has a positive effect on Search), H8 (Health motive has a positive effect on Search), H9 (Health motive has a positive effect on Action), and H11 (Attitude has a positive effect on Action). Or in other words, Sensory Appeal has no significant effect on Search. Health motive

has no positive effect on Search. Health motive has no positive effect on action. And Attitude has no significant direct effect on Action.

The rejected H2 indicates that, although for coffee drinkers, the sensory appeal of coffee drinks directly leads to a liking for coffee and coffee drinking behavior, the appeal is not big enough so that it is less able to make someone directly seek further information. The behavior of seeking information about coffee drinks is indirect, in that the coffee drinkers search the coffee information after going through the process of liking the coffee drink.

Health Motive significantly affects a person’s attitude towards coffee drinks (H7). However, this does not directly affect information seeking activities (Search) and coffee drinking activities (Action). In fact, to a certain extent coffee drinkers like coffee, the less they try to find information and the less direct they are to do coffee drinking activities.

This means that for health-conscious coffee drinkers, there is a kind of ambiguous attitude toward coffee drinking.

This may be because drinking coffee is not only fun as a refreshing drink that makes them more awake, but also on the other hand there are several notes regarding the risks to health, for example the adverse effects for people with hypertension.

An examination of the level of influence of the exogenous variables Sensory Appeal, Lifestyle, and Health Motive on the Action variable (coffee drinking activity) as one of the most important responses can be seen through the amount of loading factor. As can be seen in Table 4, the direct effect of the Sensory Appeal on coffee drinking activities is 0.1, while the indirect effect is 0.042; so that the total effect of the Sensory Appeal variable is 0.142.

Table 4: Hypothesis Testing Results

Hypotheses Path t-Value Direct Effect Total Effect t-Valuation

H1 SA → AT 2.62 0.12 0.120 Accepted

H2 SA → SE −0.15 −0.01 0.062 Rejected

H3 SA → AC 2.04 0.10 0.142 Accepted

H4 LS → AT 6.06 0.34 0.340 Accepted

H5 LS → SE 3.96 0.39 0.594 Accepted

H6 LS → AC 3.06 0.26 0.602 Accepted

H7 HM → AT 8.70 0.87 0.580 Accepted

H8 HM → SE −1.77 −0.26 0.088 Rejected

H9 HM → AC 1.25 0.14 0.233 Rejected

H10 AT → SE 2.98 0.60 0.600 Accepted

H11 SE → AC 8.97 0.53 0.530 Accepted

H12 AT → AC 0.47 0.08 0.025 Rejected

H13 AC → SH 13.31 0.82 0.820 Accepted

(9)

The Lifestyle variable has a direct influence on the Action variable of 0.26 and has an indirect effect of 0.342, so that the total effect of the Lifestyle variable on coffee drinking activity is 0.602. Health Motive has a significant influence in influencing attitude, as shown by the loading factor of 0.58. The Health Motive variable has a direct effect on the Action variable of 0.14 and an indirect effect of 0.093, so that the total effect of the Health Motive variable is 0.233.

Furthermore, health considerations in the end indirectly lead a person to keep drinking coffee, through a process of attitude, search and action. Thus, the order of the influence level of the exogenous variables on the Action variable is Lifestyle with a total effect of 0.602; then the Health Motive variable with a total effect of 0.233 and lastly the Sensory Appeal variable with a total effect of 0.142.

4.2. Managerial Implication

The strategy that needs to be developed to increase coffee drink consumption can be considered from the largest loading factor among several indicators of exogenous variables. Based on the confirmatory factor analysis data (Appendix 1), it can be seen that the indicators LS1, LS2 and LS4 have relatively better loading factors – indicators LS1 (I always try to drink coffee regularly), LS2 (I invite other people to join in drinking coffee) and LS4 (I always try to have coffee supplies at home). In addition to lifestyle variables, the HM3 variable can also be considered (for me, coffee drinks are very important for my health because of their refreshing effect) with a loading factor of 0.86 and SA1 (coffee drinks have a very special taste that suits my taste) with loading a factor of 0.82.

Thus, the strategy to increase coffee consumption must consider the lifestyle of the community, in addition to health factors and the sensory appeal of coffee drinks. Therefore the strategies that can be developed include providing a comfortable coffee place to socialize, providing coffee that is easy to serve and facilities that make it easy to brew coffee, and increasing the promotion of coffee that is safe for health.

5. Conclusion

The application of the SOR (Stimulus Organism Response) Framework with the AISAS model approach was proven to significantly show a positive interaction among the variables of sensory appeal, lifestyle factors, and health motives on coffee drinking behavior. Variables of sensory appeal, lifestyle and health motive have a significant influence on consumption of coffee drinks.

The order of influence level of the biggest is the lifestyle variable, health motive variable and lastly sensory appeal.

Therefore, to increase consumption include: providing a comfortable coffee place to socialize, providing coffee that is easy to serve and facilities that make it easy to

brew coffee, and increasing the promotion of coffee that is safe for health.

Even though this study succeeds in answering the research question, there is still room for improvement in the future. Further suggestions that can be considered include:

more in-depth research to reveal the consumption patterns of coffee drinks that are related to health. A special research interest is needed with young respondents as an object, given there is a possibility for different coffee consumption patterns for different generations.

References

Abdurrahim, M. S., Najib, M., & Djohar, S. (2019).

Development of AISAS model to see the effect of tourism destination in social media. Journal of Applied Management (JAM), 17(1), 133–143. http://dx.doi.org/10.21776/ub.jam.

2019.017.01.15

Adawiyah, R., Najib, M., & Ali, M. M. (2021). Information effect on organic vegetable purchase interest through consumer preferences and awareness. Journal of Asian Finance, Economics and Business, 8(2), 1055–1062. http://doi.

org/10.13106/jafeb.2021.vol8.no2.1055

Aguirre, J. (2016). Culture, health, gender and coffee drinking:

a Costa Rican perspective. British Food Journal, 118(1), 150–163. http://doi.org/10.1108/BFJ-08-2015-0298

Ave, S. D., Venter, M., & Mhlophe. B. (2015). Sensory branding and buying behavior in coffee shops: A study on Generation Y.

The Retail and Marketing Review, 11(2), 93–110. https://www.

academia.edu/32903562/Sensory_branding_and_buying_

behavior_in_coffee_shops_A_study_on_Generation_Y.

Retrieved on 20 February 2021

Basha, M. B., Mason, C., Shamsudin, M. F., Hussain, H. I., &

Salem, M. A. (2015). Consumers attitude towards organic food. Procedia Economics and Finance, 31, 444–452. http://

doi.org/10.1016/S2212-5671(15)01219-8

Belk, R. W. (1975). Situational variables and consumer behavior.

Journal of Consumer Research, 2(3), 157–164.

Chairy, C. (2017). Factors affecting the intention to consume organic coffee among young people. Jurnal Manajemen, 21(02), 241–254.

Chen, M. F., & Lee, C. L. (2015). The impacts of green claims on coffee consumers’ purchase intention. British Food Journal, 117(1), 195–209. http://doi.org/10.1108/bfj-07-2013-0196 Hair, J. F., Black, W. C., Babin, B. J., & Anderson, R. E. (2014).

Multivariate data analysis (7

th

ed.). London: Pearson Education Limited.

Hashim, N. H., Mamat, N. A., Nasarudin, N., & Halim N. A. A.

(2017). Coffee culture among generation Y. Pertanika Journals of Social Science & Humanities, 25(S), 39–48.

Hasan, J. (2012). Development of models for increasing interest

in buying environmentally friendly products: a perspective

of innovation diffusion theory. Bogor, Indonesia: Doctoral

dissertation, Postgraduate School. Bogor Agricultural University.

(10)

Hawkins, D. I., & Mothersbaugh, D. L. (2010). Consumer Behavior: Building Marketing Strategy (11

th

ed.). New York:

McGraw-Hill Irwin.

Hewlett, P., & Wadsworth, E. (2012). Tea, coffee and associated lifestyle factors. British Food Journal, 114(3), 416–427. http://

doi.org/10.1108/00070701211213500

Hovland, C. I. & Weiss, W. (1953). Transmission of information concerning concepts through positive and negative instances.

Journal of Experimental Psychology, 45(3), 175–182.

International Coffee Organization. (2021). World Coffee Consumption. http://www.ico.org/prices/new-consumption- table.pdf. Retrieved on 7 February 2021

Kim, S.-H., & Lee, S. (Ally). (2017). Promoting customers’

involvement with service brands: evidence from coffee shop customers. Journal of Services Marketing, 31(7), 733–744.

http://doi.org/10.1108/jsm-03-2016-0133

Kline, R. B. (2016). Principles and Practice of Structural Equation Modeling (4

th

ed.). New York: The Guilford Press.

Kotler, P. & Keller, K. L. (2016). Marketing Management (15

th

ed).

London: Pearson Education Limited.

Kouy, S., Sangkumchaliang, P., & Aditto, S. (2016). Consumers’

attitude and intention to purchase organic goods in Cambodia.

International Journal of Business, 21(4), 328–341.

Lee, K. H., Bonn, M.A., & Cho, M. (2015). Consumer motives for purchasing organic coffee: the moderating effects of ethical concern and price sensitivity. International Journal of Contemporary Hospitality Management, 27(6), 1157–1180.

http://doi.org/10.1108/IJCHM-02-2014-0060

Lee, G. W. M., Rajaratnam. S.D., & Konar, R. (2018). Key attributes of Malaysian specialty coffee shops: an exploratory investigation. Asia-Pacific Journal of Innovation in Hospitality and Tourism (APJIHT), 7(2), 69–83.

Li, J., Streletskaya, N. A., & Gomez, M. I. (2019). Does taste sensitivity matter? The effect of coffee sensory tasting information and taste sensitivity on consumer preferences. Food Quality and Preference, 71, 447–451. https://doi.org/10.1016/

j.foodqual.2018.08.006

Malhotra, N. K. (2010). Marketing Research, An Applied Orientation (6

th

ed.). London: Pearson Education, Inc.

Maclnnis, D. J., Yoo, C., & Park, J. (1998). Effects of Store Characteristics and In-Store Emotional Experiences on Store Attitude. Journal of Business Research, 42, 253–263.

Najib, M., Sumarwan, U., Septiani, S., & Fahma, F. (2021).

Application of SWOT-AHP to develop organic food marketing strategy. Academy of Strategic Management Journal, 20(1), 1–8.

Najib, M., Widyastuti, H., Andrianto, M. S., Septiani, S., &

Fahma, F. (2020). Market orientation and service quality as driving forces of business sustainability: Evidence from small coffee shop. Academy of Strategic Management Journal, 19(6), 1–8.

Najib, M., & Fahma, F. (2020). Investigating the adoption of digital payment system through an extended technology acceptance

model: An insight from the Indonesian small and medium enterprises. International Journal on Advanced Science, Engineering and Information Technology, 10(4), 1702–1708.

https://doi.org/10.18517/ijaseit.10.4.11616

Nurlaela, S., Sumarwan, U., & Najib, M. (2019). Determinants of online journey and its influence on online customer satisfaction associated with online customer loyalty. International Journal of Electronic Marketing and Retailing, 10(3), 230–243. http://

doi.org/10.1504/IJEMR.2019.100699

Nguyen, T. K. C., Nguyen, D. M., Trinh, V. T., Tran, T. P. D., &

Cao, T. P., (2020). Factors affecting intention to purchase green products in Vietnam. Journal of Asian Finance, Economics and Business, 7(4), 205–211. http://doi.org/10.13106/jafeb.2020.

vol7.no4.205

Russel, J. A., Mehrabian, A. (1977). Evidence for a three-factor theory of emotions. Journal of Research in Personality, 11, 273–294.

Samoggia, A. & Riedel, B. (2018). Coffee consumption and purchasing behavior review: Insights for further research. Appetite, 129, 70–81. http://doi.org/10.1016/j.

appet.2018.07.002

Samoggia, A., & Riedel, B. (2019). Consumers’ perceptions of coffee health benefits and motives for coffee consumption and purchasing. Nutrients, 11(3), 653. http://doi.org/10.3390/

nu11030653

Sinniah, S., Perumal, G., Seniasamy, R., Das, P. A. M., Mohamed, R. K. M. H., & Dhananjaya, O. S. (2018). Experiential quality among coffee lovers: an empirical study in the Malaysian coffee outlets industry. Journal of Social Sciences and Humanities, 15(4), 104–116.

Sugiyama, K., & Andree, T. (2011). The Dentsu Way:

Secret of Cross Swich Marketing from the World’s Most Innovative Advertising Agency. New York: McGraw-Hill Companies. Inc.

Tabachnik, B. G., & Fidell, L. S. (2013). Using Multivariate Statistics. Sixth Edition. London: Pearson Education Inc.

Ting, H., & Thurasamy, R. (2016). What matters to infrequent customers: a pragmatic approach to understanding perceived value and intention to revisit trendy coffee café.

SpringerPlus 5(1), 1–11. http://doi.org/10.1186/s40064-016- 2259-5

Tran, T. A., Pham, N. T., Pham, K. V., & Nguyen, L. C. T.

(2020). The roles of health consciousness and service quality toward customer purchase decision. Journal of Asian Finance, Economics and Business, 7(8), 345–351. http://doi.

org/10.13106/jafeb.2020.vol7.no8.345

Tremblay, A., & Panahi, S. (2017). Yogurt consumption as a signature of a healthy diet and lifestyle. The Journal of Nutrition, 147(Suppl), 1476S–1480S. https://doi.org/10.3945/

jn.116.245522

Turley, L. W., & Milliman, R. E. (2000). Atmospheric effects on

shopping behavior: a review of experimental evidence. Journal

of Business Research, 49, 193–211.

(11)

Vieira, V. A. (2013). Stimuli-organism-response framework:

A meta-analytic review in the store environment. Journal of Business Research, 66(9), 1420–1426. http://doi.org/10.1016/j.

jbusres.2012.05.009

Walsh, G., Shiu, E., Hassan, L. M., Michaelidou. N., & Beatty, S. E. (2011). Emotions, store-environmental cues, store- choice criteria, and marketing outcomes. Journal of Business Research, 64, 737–744. http://doi.org/10.1016/j.

jbusres.2010.07.008

Wang, I.-M., Hsiao, J., & Shieh, C.-J. (2005). Study of consumers’

purchase behaviors for canned coffee. Journal of Information

and Optimization Sciences, 26(2), 385–400. http://doi.org/

10.1080/02522667.2005.10699656

Wang, E. S. -T., & Yu, J.-R. (2016). Effect of product attribute beliefs of ready-to-drink coffee beverages on consumer-perceived value and repurchase intention. British Food Journal, 118(12), 2963–2980. http://doi.org/10.1108/BFJ-03-2016-0128

Zahra, D. R., & Anoraga, P. (2021). The influence of lifestyle, financial literacy, and social demographics on consumptive behavior. Journal of Asian Finance, Economics and Business, 8(2), 1033–1041. http://doi.org/10.13106/jafeb.2021.vol8.

no2.1033

Appendix 1: Calculation of Model Validity and Reliability Latent

Variable Indicator Standard Loading Factor (λ)

T-value

(≥1.96) Error Var λ

2

Reliability

Description CR ≥ 0.7 VE ≥ 0.5

Sensory

Appeal SA1 0.82 19.34 0.3276 0.6724 Valid

SA2 0.60 12.82 0.6400 0.3600 Valid

SA3 0.78 18.11 0.3916 0.6084 Valid

SA4 0.75 17.03 0.4375 0.5625 Valid

2.95 1.3592 1.6408 0.86 0.55 Reliable

Lifestyle LS1 0.77 18.04 0.4071 0.5929 Valid

LS2 0.73 16.58 0.4671 0.5329 Valid

LS3 0.71 15.64 0.4959 0.5041 Valid

LS4 0.74 17.06 0.4524 0.5476 Valid

LS5 0.70 15.66 0.5100 0.4900 Valid

3.65 2.333 2.6675 0.85 0.53 Reliable

Health

Motive HM1 0.73 15.59 0.4671 0.5329 Valid

HM2 0.58 12.56 0.6636 0.3364 Valid

HM3 0.86 20.6 0.2604 0.7396 Valid

HM4 0.80 18.84 0.3600 0.6400 Valid

2.97 1.3911 1.6089 0.86 0.54 Reliable

Attitude AT1 0.75 0.4375 0.5625 Valid

AT2 0.55 11.22 0.6975 0.3025 Valid

AT3 0.76 15.25 0.4224 0.5776 Valid

AT4 0.79 16.59 0.3759 0.6241 Valid

AT5 0.81 16.64 0.3439 0.6561 Valid

3.66 2.2772 2.7228 0.85 0.54 Reliable

Search SE1 0.89 0.2079 0.7921 Valid

SE2 0.82 18.72 0.3276 0.6724 Valid

SE3 0.80 17.29 0.3600 0.6400 Valid

SE4 0.85 18.64 0.2775 0.7225 Valid

3.36 1.1730 2.8270 0.91 0.71 Reliable

(12)

Latent

Variable Indicator Standard Loading Factor (λ)

T-value

(≥1.96) Error Var λ

2

Reliability

Description CR ≥ 0.7 VE ≥ 0.5

Action AC1 0.68 0.5376 0.4624 Valid

AC2 0.55 10.61 0.6975 0.3025 Valid

AC6 0.67 12.09 0.5511 0.4489 Valid

1.90 1.7862 1.2138 0.67 0.40 Reliable*

Share SH1 0.85 0.2775 0.7225 Valid

SH2 0.74 16.35 0.4524 0.5476 Valid

SH3 0.71 15.56 0.4959 0.5041 Valid

SH4 0.59 11.04 0.6519 0.3481 Valid

2.89 1.8777 2.1223 0.82 0.53 Reliable

Overall 21.380 12.1969 14.8031 0.97 0.55

CR of overall model 97% Reliable

VE of overall model 55%

Appendix 1: (Continued)

수치

Table 1: Variables and Indicators of the Model
Figure 1: Coffee Consumption Research Model
Table 3: Analysis of the Suitability (Goodness of Fit Test) of the Overall Model
Table 4 shows the outputs of the LISREL8.8 application,  which shows the t-value of each variable in the model and  its interaction with other variables

참조

관련 문서

Optimizing Arabica coffee production systems in Rwanda: a multiple-scale analysis.. In-depth Study on Analysis of Value Chain for Intensified Crops and

1 John Owen, Justification by Faith Alone, in The Works of John Owen, ed. John Bolt, trans. Scott Clark, "Do This and Live: Christ's Active Obedience as the

The results of the repeated measures ANOVA of health-related physical fitness suggested that the main effect based on test time had a significant difference

As a result of the study, it was confirmed that only human resource competency had a positive(+) effect on the intercompany cooperation method of IT SMEs,

Thirdly, it appeared that social support had meaningful effect on self-efficacy and the quality of life, and in the case of the difference analysis by

At Wolmi Observatory on the top of Wolmisan Mountain, you can enjoy the view of Incheon Port, the West Sea, and Incheon International Airport. Take a break with a cup of

Purpose: The purpose of this research was to study the influences of a floortime-based sensory integration program on both initial and reaction behaviors

Common fruits that are sometimes classified as epigynous berries include bananas, coffee, members of the genus Vaccinium (e.g., cranberries and blueberries), and members