논 문
* 경상대학교 지역환경기반공학과교수 (경상대 농업생명과학연구원) ([email protected])
** 경상대학교 농업생명과학대학 교수([email protected])
키워드 : TDR, 함수비, 토양염도, 세립분함량, 포화도
토양의 세립분 함량과 염분농도가 TDR 측정값에 미치는 영향 고찰
A Consideration on the Effect of the Fine Content and Salinity of Soils on the TDR Measurement
Abstract
Experimental laboratory tests were carried out to assess the effect of fine content and salinity of soils on the measurement of TDR(Time Domain Reflectometry). In the test, using soil column which was made by PVC pipe with the dimension of 25cm height and 20cm diameter, the salinity variation of soil was controlled by the solution which was dissolved NaCl to destilled water in the range of 0~40g L
-1. The fine content of soil was controlled by kaolinite which was mixed with Jumunjin sand in the range of 0~50% to the total dry weight. The water contents of soil tested were measured with the conventional oven dry method beside TDR and compared the these values to figure out the extent of effect. As the results of tests, it was appeared that the water content measurement by TDR can be affected by the salinity level, fine contents, and the degree of saturation of the soil.
Ⅰ. 서 론
Lee, Haeng Woo ∙ Yu, Chan ∙ Lee, Keun-Hoo∙ Park, Kwang Soo 이 근 후** 박 광 수****
유 찬*
이 행 우*
한국관개배수 제13권 제2호
KCID J. VOL. 13, No.2 (2006. 12) pp.58-65
Ⅱ. 재료 및 실험
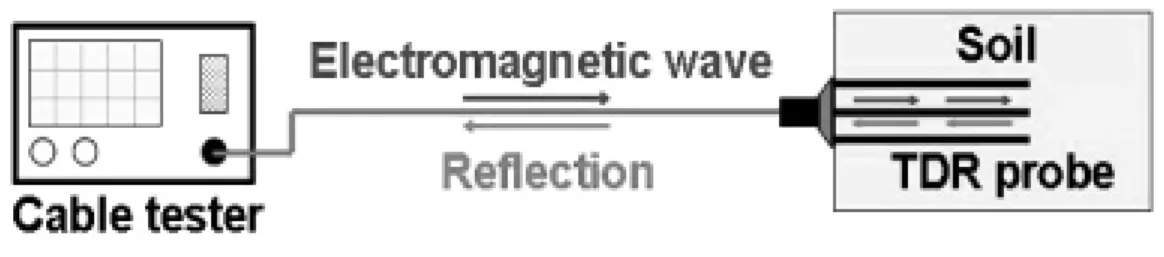
Fig. 1. Schematic diagram of soil water content measurement using TDR
Fig. 2. Reflection wave from TDR
EFFECTIVE VOLTAGE
REFLECTION OFF OF END OF WAVEGUIDE VOLTAGE LEVEL AT CONNECTOR CABLE
VOLTAGE LEVEL OF DRY SOIL START OF WAVEGUIDES TRANSIT TIME IN WAVEGUIDES TIME IN NANOSECONDS
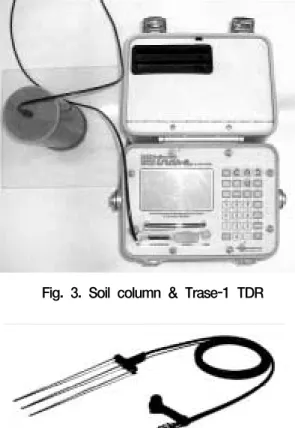
Fig. 3. Soil column & Trase-1 TDR
Fig. 4. TDR waveguide (3-wire buried type)
Ⅲ. 결과 및 고찰
30
20
10
0
0 10 20 30
Water content by oven dry (%)
Water content by oven dry (%)
Water content b y T DR (%)
30
20
10
0
0 10 20 30
Water content by TDR (%)
Water content by oven dry (%)
30
20
10
0
0 10 20 30
Water content by TDR (%)
30
20
10
0
0 10 20 30
Water content by oven dry (%)
Water content b y T DR (%)
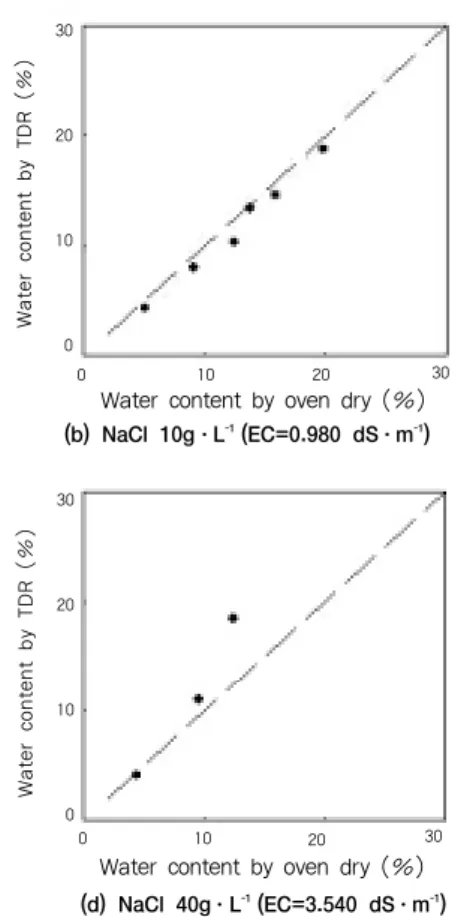
(a) NaCl 0g∙L-1 (EC=0.001 dS∙m-1) (b) NaCl 10g∙L-1 (EC=0.980 dS∙m-1)
(d) NaCl 40g∙L-1 (EC=3.540 dS∙m-1)
Fig. 5. Relationship between water content and salinity of soils
(c) NaCl 20g∙L-1 (EC=1.894 dS∙m-1)
30
20
10
0 0
Water content by oven dry (%)
Water content b y T DR (%)
30
20
10
0
0 10 20 30
Water content by oven dry (%)
Water content b y T DR (%)
(a) NaCl 0g∙L-1 (b) NaCl 10g∙L-1
(c) NaCl 20g∙L-1 (d) NaCl 40g∙L-1
Fig. 6. Influence of the fine content with the soil salinity variation on the TDR measurement [S: Sand content (%), F: Fine content (%)]
Water content by oven dry (%)
30
20
10
0
0 10 20 30
Water content b y T DR (%)
Water content by oven dry (%)
30
20
10
0
0 10 20 30
Water content b y T DR (%)
10 20 30
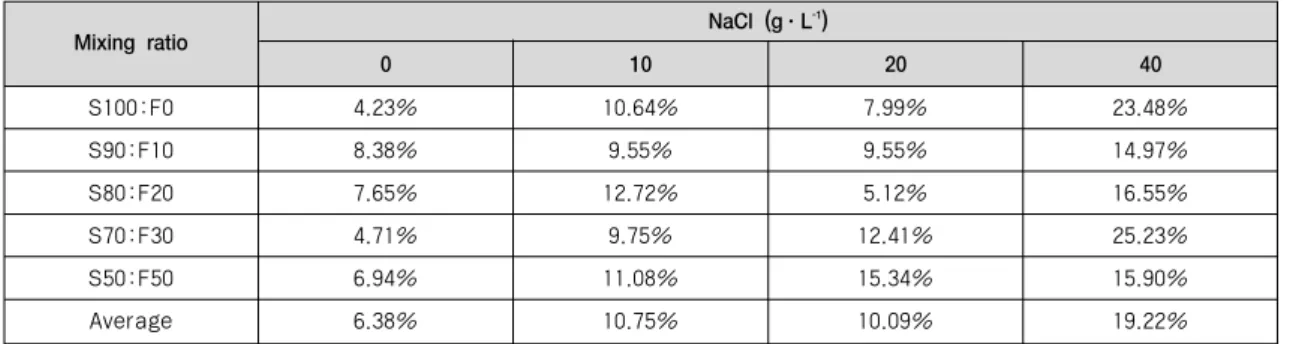
Table 1. Summary of the average error with test conditions
Mixing ratio NaCl (g∙L-1)
0
S100:F0 4.23% 10.64% 7.99% 23.48%
S90:F10 8.38% 9.55% 9.55% 14.97%
S80:F20 7.65% 12.72% 5.12% 16.55%
S70:F30 4.71% 9.75% 12.41% 25.23%
S50:F50 6.94% 11.08% 15.34% 15.90%
Average 6.38% 10.75% 10.09% 19.22%
10 20 40
8.0 6.0 4.0 2.0 0.0
0Degree of saturation (%)
Deviation
(a) NaCl 0g∙L-1 (b) NaCl 10g∙L-1
(c) NaCl 20g∙L-1 (d) NaCl 40g∙L-1
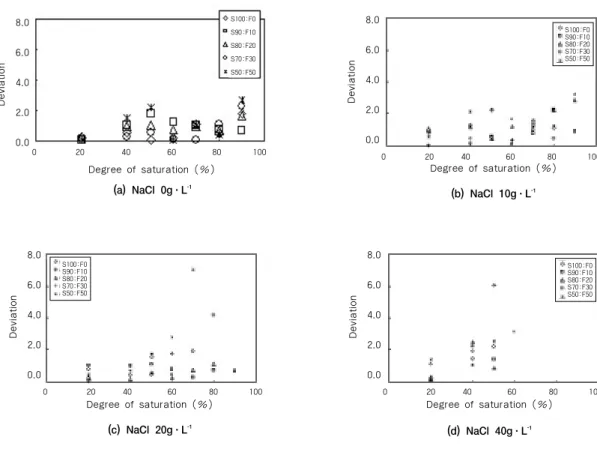
Fig. 7. Comparision of the effect of the fine content and salinity on the TDR measurement with the degree of saturation of soil
20 40 60 80 100
8.0 6.0 4.0 2.0
0.0
0Degree of saturation (%)
Deviation
20 40 60 80 100
8.0 6.0 4.0 2.0
0.0
0Degree of saturation (%)
Deviation
20 40 60 80 100
8.0 6.0 4.0 2.0
0.0
0Degree of saturation (%)
Deviation
20 40 60 80 100
S100:F0 S90:F10 S80:F20 S70:F30 S50:F50
S100:F0 S90:F10 S80:F20 S70:F30 S50:F50
S100:F0 S90:F10 S80:F20 S70:F30 S50:F50
S100:F0 S90:F10 S80:F20 S70:F30 S50:F50
Ⅳ. 결 론
1. 박재현, 1998, 비포화 영역에서 용존 오염물질 거동에 관한 실험적 연구, 서울대학교 박사학위논문, p235.
2. Dalton, F. N., 1992, Development of time-domain reflectometry for measuring soil water content and bulk density. In Topp, G. C. et al., Eds. Advances in measurement of soil physical properties: bringing theory into practice. Sepc. Publ. No. 30, SSSA, pp.143-167.
3. Hamed, Y., M. Persson, & R. berndtsson, 2005, Using Time Domain Reflectometry for Tracking Water and Salinity Movements in a Contour Ridge Managed Catchment in Tunisia, pp.10, from M.
Persson's internet site.
4. Herkelrath, W. N., 1991, Automatic, real time monitoring of soil moisture in a remote field area with TDR, Water resource research, 27, pp.857-864.
5. Persson M., 2001, Using Time Domain Reflectometry for Non-Aqueous Phase Liquid Saturation Measurements, TDR-2001, 2nd Intl' symposium & workshop on T.D.R. innovative geotechnical application, IL, USA, pp.362-371.
6. Roberto, A., 2002, A simple emperical method to evaluate the electrical conductivity of soils and waters by TDR, 17th WCSS, pp.821-1-8.
7. Soilmoisture Equipment Corp., 1996, Operating instruction, version 2000.
8. Topp, G.C., J.L. Davis, and A.P. Annan. 1980.
Electromagnetic determination of soil water content: Measurements in coaxial transmission lines. Water Resour. Res. 16, pp.574-582.
9. White, I. & S.J. Zegelin, 1995, Electric and dielectric methods for monitoring soil-water content, Handbook of vadose zone characterization &
monitoring(Wilson, Everett & Cullen ed.), pp.343- 385, Lewis.
10. Zegelin, S. J., White, I. & Russell, G. F., 1992, A critique of the time domain reflectometry technique for determining field soil water content, In Topp, G. C. et al., Eds. Advances in measurement of soil physical properties: bringing theory into practice. Sepc. Publ. No. 30, SSSA, pp.187-208.
![Fig. 6. Influence of the fine content with the soil salinity variation on the TDR measurement [S: Sand content (%), F: Fine content (%)]](https://thumb-ap.123doks.com/thumbv2/123dokinfo/5169190.593064/5.892.165.712.483.947/influence-content-salinity-variation-measurement-sand-content-content.webp)