• 검색 결과가 없습니다.

Phenolic Compounds from Japanese Anise (Illicium anisatum L.) Leaves

N/A
N/A
Protected

Academic year: 2021

Share "Phenolic Compounds from Japanese Anise (Illicium anisatum L.) Leaves"

Copied!
7
0
0

로드 중.... (전체 텍스트 보기)

전체 글

(1)

Phenolic Compounds from Japanese Anise (Illicium anisatum L.) Leaves 1

Seong-whan Shinn

2

⋅Hee-Jeong Min

3

⋅Young-Soo Bae

3,†

ABSTRACT

1)

Japanese anise (Illicium anisatum L.) leaves were collected and ground after drying, then immersed with 50 % aqueous acetone for 3 days. After filtration, the extracts were fractionated with n-hexane, chloroform (CHCl3), ethylacetate (EtOAc) and H2O, and then freeze dried after concentration. A portion of EtOAc (3.12 g) and H2O (6.08 g) soluble fractions were chromatographed on a Sephadex LH-20 column with various aqueous MeOH solution to isolate the compounds.

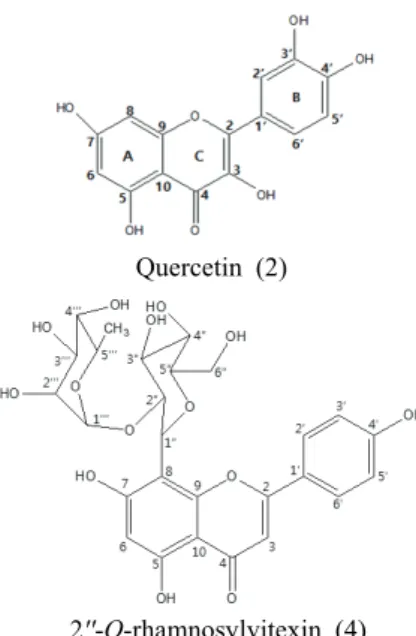
Compound 1 ((+)-catechin) was isolated from EtOAc soluble fraction. Compounds 2 (quercetin), 3 (quercitrin) and 4 (2''-O-rhamnosylvitexin) were isolated from H2O soluble fraction.

For the first time, quercitrin (3) and 2''-O-rhamnosylvitexin (4) of the isolated compounds were obtained from the extracts of japanese anise leaves.

Keywords: Japanese anise (llicium anisatum L), leaves extracts, column chromatography, EtOAc soluble, H2

O soluble

1. INTRODUCTION

About 70 % of Illicium species are distributed in China, especially in Southwestern and Eastern area.

Chinese star anise of the species is included in the chinese pharmacopoeia.

Illicium anisatum L. is an evergreen tree belonging to the family Illiciacease and a species of the same genus as the star anise (Illicium verum Hook. f.) that was used as a raw material for the “Tamiflu”, a new influenza treatment.

The species is a toxic plant, distributes throughout eastern Asia where it is used as an ornamental plant,

and also found in Jeju Island and southern part of Korean peninsula. The tree contains various kinds of chemical constituents such as sesquiterpene, anisatin and shikimic acid (Yamada et al., 1968).

The bark of Japanese anise is used as a blood coagulant, and the leaves and twigs is used as medicinal herb and fragrance, but the fruit is not used due to toxicty (Yamada et al., 1965).

Recent domestic studies have reported that the tree has the potentials on the aldose reductase inhibition, fat degradation, glycation, anti-elastase activity and anti-inflammation as well as antioxidant activity (Kim and Oh, 1999; Kim and Kim, 2003; Kim and Kang,

1Date Received August 16, 2018, Date Accepted November 19, 2018

2Department of Advanced Materials and Chmemical Engineering, Halla university, Wonju 26404, Republic of Korea

3Department of Forest Biomaterials Engineering, College of Forest and Environmental Sciences, Kangwon National University, Chuncheon 24341, Republic of Korea

Corresponding author: Young-Soo Bae (e-mail: [email protected], ORCID: 0000-0003-1108-9269) Original Article

(2)

2005; Kim et al., 2009; Jeong et al., 2017; Lee et al., 2015; Kim et al., 2015; Jung et al., 2017). However, there is a little studies on the chemical constituents of the tree in domestic because it has toxic although some studies had already done about the biological activities and the analysis of GC-MS on volatile components (Shibuya et al., 1978).

In this study, we investigated the chemical constituents of Japanese anise leaves for future functional use, and elucidated the structures of isolated phenolic compounds.

2. MATERIALS and METHODS 2.1. Plant materials

Fresh Japanese anise leaves were collected at Seogwipo, Jeju-do in January 2017, air dried for two weeks and then ground to fine particles to be extracted.

The origin of this plant was confirmed by Warm and Subtropical Forest Research Center, National Institute of Forest Service.

2.2. Sample preparation

The ground leaves (4.37 kg) were immersed in 50

% aqueous acetone at room temperature for 3 days.

After three times extraction and filtration, the filtrates were combined together and evaporated on a rotary evaporator under the reduced pressure at 40 ℃. The aqueous crude residue was successively fractionated on a separatory funnel and freeze dried after concentration to give n-hexane (0.7107 g), CHCl

3

(0.8681 g), EtOAc (3.1115 g), and H

2

O (16.3765 g) soluble fractions.

2.3. Structure analysis

1

H and

13

C NMR spectra, including 2D-NMR such as HSQC (Heteronuclear Single Quantum Coherence)

and HMBC (Heteronuclear Multiple Bond Correlation), were recorded on a Bruker (USA) Avance DPX 400 and 700 MHz spectrometers using TMS (tetramethylsilane) as an internal standard and chemical shift was given in δ (ppm).

Thin layer chromatography (TLC) was done on DC-Plastikfolien Cellulose F (Merck) plates and developed with TBAW (t-BuOH-HOAc-H

2

O (3:1:1, v/v/v)) and 6 % aqueous HOAc. The spot was detected by illuminating ultraviolet light (UV, 254 and 365 nm) and by spraying vanillin reagents (Vanillin- EtOH-H

2

SO

4

(15:250:2.5, w/v/v)), then heating.

2.4. Column chromatography

A portion of EtOAc (3.12 g) and H

2

O (6.08 g) soluble fractions were chromatographed on a Sephadex LH-20 column, successively eluting with MeOH-H

2

O (1:9 → 3:7 → 5:5 → 7:3 → 9:1, v/v) to divide 5 fractions, respectively.

Compound 1, (+)-catechin, (224.5 mg) was isolated by rechrmatography of farction 2 of EtoAc soluble with MeOH-H

2

O (4:1, v/v). Compound 2, quercetin (79.4 mg), was isolated from fraction 4 of H

2

O soluble.

Fraction 2 of H

2

O soluble was rechromatographed with MeOH-H

2

O (4:1, v/v) to isolated the compound 3 (9.2 mg), quercetin-3-O-α-L-(+)-rhamnose which is called quercitrin. Fraction 1 of H

2

O soluble was retreated with 100 % MeOH, MeOH-H
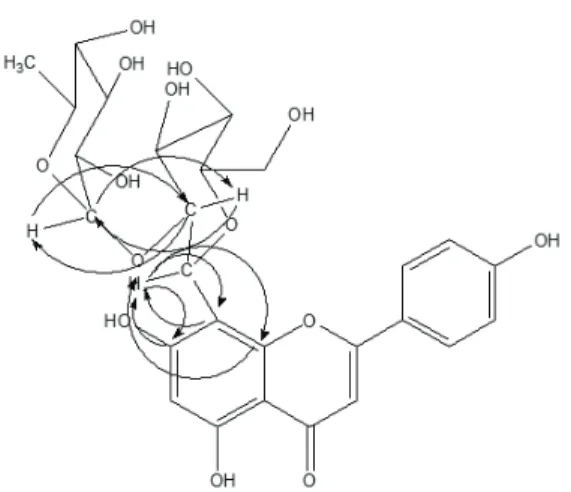
2

O (1:1, v/v) and EtOH-hexane (3:1, v/v) to isolated the compound (4) (33.6 mg), apigenin-8-C-rhamnosyl-(1'''→2'')-glucoside which is called 2''-O-rhamnosylvitexin.

The isolated compounds were elucidated as (+)- catechin (1), quercetin (2), quercitrin (3) and 2''-O- rhamnosylvitexin (4) by spectral and literature data, and by comparison with the authentic sample.

2.4.1. Compound 1

Yellowish amorphous powder, R

f

: 0.53 (TBAW)

(3)

and 0.41 (6 % HOAc).

MALDI-TOF-MS : Calculated for C

15

H

14

O

6

290, Found m/z 313 [M+Na]

+

, 291 [M+H]

+

1

H NMR (400 MHz, δ, CD

3

OD) : 2.51 (1H, dd,

J = 8.2 and 16.1 Hz, H-4), 2.85 (1H, dd, J = 5.4 and 16.1 Hz, H-4), 3.98 (1H, m, H-3), 4.57 (1H, d, J = 8.2 Hz, H-2), 5.86 (1H, d, J = 2.3 Hz, H-6), 5.93 (1H, d, J = 1.9 Hz, H-8), 6.75 (1H, dd, J = 1.9 and 8.1 Hz, H-6), 6.76 (1H, d, J = 8.1 Hz, H-5), 6.97 (1H, d, J = 1.9 Hz, H-2).

13

C NMR (100 MHz, δ, CD

3

OD) : 28.55 (C-4),

68.84 (C-3), 82.88 (C-2), 95.53 (C-8), 96.32 (C-6), 100.85 (C-10), 115.28 (C-2'), 116.12 (C-5'), 120.08 (C-6'), 132.24 (C-1'), 146.26 (C-3'), 146.28 (C-4'), 157.86 (C-7), 157.61 (C-5), 156.95 (C-9).

2.4.2. Compound 2

Yellowish amorphous powder, Rf : 0.58 (TBAW) and 0.00 (6 % HOAc).

EI-MS : Calculated for C

15

H

10

O

7

302, Found m/z 302 [M]

+

1

H-NMR (400 MHz, δ, CD

3

OD) : 6.27 (1H, d, J

= 2.0 Hz, H-6), 6.53 (1H, d, J = 2.0 Hz, H-8), 7.00 (1H, d, J = 8.5 Hz, H-5'), 7.70 (1H, dd, J = 2.3 and 8.5 Hz, H-6'), 7.82 (1H, d, J = 2.3 Hz, H-2'),

13

C-NMR (100 MHz, δ, CD

3

OD) : 94.45 (C-8), 99.17

(C-6), 104.08 (C-10), 115.71 (C-2'), 116.18 (C-5'), 121.44 (C-6'), 123.71 (C-1'), 136.77 (C-3), 145.93 (C-3'), 147.02 (C-2), 148.43 (C-4'), 157.75 (C-9), 162.28 (C-5), 165.13 (C-7), 176.60 (C-4).

2.4.3. Compound 3

Yellowish amorphous powder, R

f

: 0.58 (TBAW) and 0.25 (6 % HOAc).

MALDI-TOF-MS : Calculated for C

21

H

20

O

11

448, Found m/z 471 [M+Na]

+

, 449 [M+H]

+

1

H NMR (400 MHz, δ, CD

3

OD) : 0.95 (3H, d, J

= 6.14 Hz, H-6''), 3.42 (1H, m, H-5''), 3.66 (1H, m, H-4''), 3.76 (1H, dd, J = 3.40 and 3.23 Hz, H-3''), 4.23 (1H, dd, J = 1.63 and 1.66 Hz, H-2''), 5.36 (1H, d, J = 1.5 Hz, H-1''), 6.20 (1H, d, J = 2.0 Hz, H-6), 6.36 (1H, d, J = 2.0 Hz, H-8), 6.91 (1H, d, J = 8.5

(+)-catechin (1) Quercetin (2)

Quercitrin (3) 2''-O-rhamnosylvitexin (4)

Fig. 1. Chemical structures of isolated compounds.

(4)

Hz, H-5'), 7.31 (1H, dd, J = 2.2 and 8.5 Hz, H-6'), 7.34 (1H, d, J = 2.2 Hz, H-2').

13

C NMR (100 MHz, δ, CD

3

OD) : 17.69 (C-6''),

71.93 (C-5''), 72.06 (C-3''), 72.13 (C-2''), 73.28 (C-4''), 94.74 (C-8), 99.83 (C-6), 103.56 (C-1''), 105.92 (C-10), 116.39 (C-2'), 116.96 (C-5'), 122.92 (C-6'), 122.99 (C-1'), 136.26 (C-3), 146.42 (C-3'), 149.80 (C-4'), 158.52 (C-9), 159.32 (C-2), 163.21 (C-5), 165.87 (C-7), 179.65 (C-4).

2.4.4. Compound 4

Yellowish amorphous powder, R

f

: 0.81 (TBAW) and 0.53 (6 % HOAc).

FAB-MS : Calculated for C

27

H

30

O

14

578, Found m/z 579 [M+H]

+

.

1

H-NMR (700 MHz, δ, CD

3

OD) : 0.64 (3H, d, J

= 6.3 Hz, H-6'''(CH

3

)), 2.43 (1H, m, H-5'''), 3.12 (1H, t, H-3'''), 3.39 (1H, dd, J = 2.8 and 9.1 Hz, H-4'''), 3.45 (1H, m, H-5''), 3.63 (2H, m, H-3'',4''), 3.79 (1H, m, H-6''), 3.84 (1H, s, H-2'''), 3.96 (1H, d, J = 11.2 Hz, H-6''), 4.25 (1H, m, H-2''), 5.02 (1H, d, J = 9.9 Hz, H-1''(glc)), 5.09 (1H, d, J = 1.2 Hz, H-1'''(rham)), 6.28 (1H, s, H-6), 6.61 (1H, s, H-3), 6.94 (2H, d, J

= 9.1 Hz, H-3’,5’), 7.99 (2H, d, J = 8.4 Hz, H-2’,6’).

13

C-NMR (100 MHz, δ, CD

3

OD) : 16.66 (C-6'''),

61.66 (C-6''), 68.56 (C-5'''), 70.55 (C-4'''), 70.84 (C-2'''), 71.06 (C-4''), 72.14 (C-3'''), 72.32 (C-1''), 76.74 (C-2''), 80.23 (C-3''), 81.53 (C-5''), 98.42 (C-6), 101.14 (C-1'''), 102.25 (C-3), 104.30 (C-10), 104.62 (C-8), 115.60 (C-3',5'), 122.19 (C-1'), 128.74 (C-2',6'), 156.55 (C-9), 161.37 (C-5), 141.40 (C-4'), 162.80 (C-7), 165.34 (C-2), 182.79 (C-4).

3. RESULTS and DISCUSSION

The compounds were isolated from the EtOAc soluble and H

2

O soluble fractions of the extracts of Japanese anise (Illicium ansisatum L) leaves by column chromatography using Sephadex LH-20, and then the

structures were elucidated by NMR analysis and by comparison with the authentic literature data.

3.1. Compound 1

Compound 1 was obtained as a yellowish amorphous powder from EtOAc soluble fraction.

On the basis of the spectral data, it was identified as (+)-catechin (Foo et al., 1983; Min et al., 2017).

3.2. Compound 2

Compound 2 was obtained as a yellowish amorphous powder from EtOAc soluble fraction.

Based on the previous spectral data, the structure was identified as quercetin (3,5,7,3',4'-pentahydroxyflavone) (Kwon et al., 2007; Luo et al., 2009).

3.3. Compound 3

Compound 3 was obtained as a yellowish amorphous powder from H

2

O soluble fraction.

On the basis of the authentic spectral data and by comparison of the literature (pyo et al., 2002; Lee et al., 2004; Min et al., 2017, Lee et al., 2015), it was elucidated as quercetin-3-O- α -L-rhamnopyranose, quercitrin which was first time isolated in this species.

3.4. Compound 4

Compound 4 was obtained as a yellowish amorphous powder from H

2

O soluble fraction.

The

1

H NMR spectrum showed that the signals of H-3 and H-6 were singlet at δ 6.61 and δ 6.28, respectively and indicated that there was no adjacent hydrogen. The doublet signals at δ 7.99 were identical to one symmetrical two hydrogen atoms of H-2' and H-6' and the coupling constant was 8.4 Hz indicating the ortho-coupled hydrogens in the phenolic B-ring.

H-3' and H-5' signals of B-ring also showed another

(5)

symmetrical doublet signals at δ 6.94 with 9.1 Hz of coupling constant.

In the sugar moieties, one signal at δ 5.02 corresponds to H-1'' of glucose bonded to C-8 of A-ring, which was more downfield shifted than the other hydrogen signals of glucose unit, and the coupling constant was 9.9 Hz indicating a β structure The H-1''' of rhamnose gave one doublet signal at δ 5.09 with 1.2 Hz of J value, indicating α-L-rhamnose. The characteristic methyl signal of rhamnose indicated at δ 0.64. The remaining glucose and rhamnose protons gave complicated typical signals between δ 3.0 and δ 4.26.

In the

13

C-NMR spectrum, C-2 and C-3 of heterocyclic C-ring appeared at 165.34 ppm and 102.25 ppm, respectively. C-4 carbonyl carbon gave a peak at 182.79 ppm, indicating a distinctive form of flavone C-ring (Roh et al., 2007). C-6 and C-8 of A-ring appeared at 98.42 and 104.62 ppm, respectively, indicating the typical C-8 of 2''-O-rhamnosylvitexin, about 10 ppm more downshifted than C-8 of apigenin reported by Owen et al. (2003). Therefore, this fact can suggest that glucose C-1'' and C-8 of A-ring may be linked together. C-10 gave a signal at 104.30 ppm and the hydroxyl containing C-5, C-7 and C-9 indicated at 161.37, 162.80 and 156.55 ppm, respectively.

In the B-ring of the aglycon, C-1' showed a signal at 122.19 ppm and two pairs of symmetrical carbons, C-2'/C-6' and C-3'/C-5' gave two strong peaks at 128.74 ppm and 115.60 ppm, respectively. The hydroxyl containing C-4' was observed at 182.79 ppm and indicated that B ring is symmetrical.

In the sugar moieties, the glucosyl C-1'' was indicated at 72.32 ppm. Also C-2'' shown a signal at 76.74 ppm that was about 8 ppm more downshifted than the C-2'' of vitexin isolated by Lew et al. (1998). The rest of glucosyl carbons appeared at 80.23, 71.06, 81.53 and 61.66 ppm for C-3'', C-4'', C-5'' and C-6'', respectively.

The C-1''' of rhamnose gave a signal at 101.14 ppm

and C-6''' gave a typical methyl signal at 16.66 ppm.

The remaining rhamnosyl carbons resonated at 70.84, 72.14, 70.55 and 68.56 ppm for C-2''', C-3''', C-4''' and C-5''', respectively.

In the glucosyl HSQC spectrum, H-1'' (δ5.02) and H-2'' (δ4.25) were resonated with C-1'' (72.37 ppm) and C-2'' (76.16 ppm). H-3'' and H-4'' (δ3.63) were correlated with C-4'' (71.06 ppm) and C-3'' (80.23 ppm).

Also H-5'' (δ7.45) and C-5'' (81.53 ppm), H-6'' (δ3.79 and δ3.96) and C-6'' (61.66 ppm), had relationship each other, respectively.

In the rhamnose, H-1''' (δ5.09) was resonated with C-1''' (101.14 ppm). H-2''' (δ3.84), H-3''' (δ3.12), H-4''' (δ3.39), H-5''' (δ2.43) and H-6''' (δ0.64) showed correlations with C-2''' (70.94 ppm), C-3''' (72.14 ppm), C-4''' (70.44 ppm), C-5''' (68.56 ppm) and C-6''' (16.66 ppm), respectively.

In the glucosyl HMBC spectrum (Fig. 2), H-1'' (δ 5.02) indicated correlations with glucosyl C-2'' (76.74 ppm), apigenin C-7 (162.80 ppm), C-8 (104.62 ppm) and C-9 (151.55 ppm), respectively. H-2'' (δ25) was also correlated with glucosyl C-1'' (72.32 ppm) and rhamnosyl C-1''' (101.14 ppm), respectively. C-2'' (76.74 ppm) also showed relationships with H-1'' (δ 5.02) and rhamnosyl H-1''' (δ5.09), respectively.

In the rhamnosyl HMBC spectrum, H-1''' (δ5.09) indicated the correlation with C-5''' (68.56 ppm) and glucosyl C-2'' (76.74 ppm). Rhamnosyl C-1''' (101.14 ppm) also was resonated together with H-2'' (δ4.25) and H-3''' (δ3.84).

Based on the above spectral data, compound 4 was elucidated as 2''-O-rhamnosylvitexin reported by Kwon (2005) and compared with the previous literature data by kim et al. (1997) and kassem et al. (2000).

This compound is isolated, for the first time, from

the extractives of Japanese anise (Illicium anisatum L.)

leaves.

(6)

4. CONCLUSION

Japanese anise (Illicium anisatum L) leaves were collected, air-dried and extracted with 50 % aqueous acetone. The extracts were concentrated and then sequentially fractionated with n-hexane, CHCl

3

, EtOAc, and H

2

O to be freeze-dried. A portion of EtOAc soluble (3.12 g) and H

2

O soluble fractions (6.08 g) were chromatographed on a Sephadex LH-20 column by the successively elution with various aqueous MeOH solution (1:9 → 3:7 → 5:5 → 7:3 → 9:1, v/v).

Compound 1 was isolated by rechromatography of EtOAC fraction 2. Compound 2 also was separated from H

2

O fraction 4, and compound 3 and compound 4 were isolated from H

2

O fraction 1 and 2, respectively. The isolated ones were elucidated as (+)-catechin (1), quercetin (2), quercitrin (3) and 2''-O-rhamnosylvitexin (4) by the comparison with the previous spectral and literature data and by the comparison with the authentic sample.

For the first time, quercitrin (3) and 2''-O- rhamnosylvitexin (4) were isolated from the extracts of Japanese anise leaves and might be used valuable index markers for the species.

ACKNOWLEDGMENT

This study was supported by “R&D Program for Forest Science Technology (Project No. 2013070B10- 1819-AA03)” of Korea Forest Service and also partially supported by Kangwon National University.

REFERENCES

Foo, L.Y., McGraw, G.W., Hemingway, R.W. 1983.

Condensed tannins: Preferential substitution at the interflavanoid bond by sulphite ion. Journal of the Chemical Society, Chemical Communications 12:

672-673.

Jeong, M.J., Yang, J.Y., Choi, W.S., Kim, J.W., Kim, S.J., Park, M.J. 2017. Chemical Compositions and Antioxidant Activities of Essential Oil Extracted from Neolitsea aciculata (Blume) Koidz Leaves.

Journal of the Korean Wood Science and Technology 45(1): 96-106.

Jung, J.Y., Ha, S.Y., Yang, J.k. 2017. Response Surface Optimization of Phenolic Compounds Extraction From Steam Exploded Oak Wood (Quercus mongolica). Journal of the Korean Wood Science and Technology 45(6): 809-827.

Kassem, M., Mosharrafa, S.A., Saleh, N.A.M., Abdel- Wahab, S.M. 2000. Two new flavonoids from Retama raetam. Fitoterapia 71: 649-654.

Kim, H.Y., Kang, M.H. 2005. Screening of Korean medicinal plants for lipase inhibitory activity.

Phytotherapy Research 19: 359-361.

Kim, H.Y., Kim, K. 2003. Protein glycation inhibitory and antioxidative activities of some plant extracts in vitro. Journal of Agricultural and Food Chemistry 51: 1586-1591.

Kim, H.Y., Oh, J.H. 1999. Screening of Korean forest plants for rat lens aldose reductase inhibition.

Bioscience, Biotechnology and Biochemistry 63:

184-188.

Fig. 2. Selected HMBC correlations observed in

compound 4.

(7)

Kim, J.K., Park, W.G., Bae, Y.S. 1997. Flavonoid glycosides from needles of Larix leptolepis (Pinaceae). Journal of the Korean Wood Science and Technology 25(2): 81-87.

Kim, J.W., Choi, W.S., Lee, S.S., Park, M.J. 2015.

Comparative Study on The Composition of Essential Oil by Supercritical Carbon Dioxide Extraction and Hydro-distillation from Chamaecyparis obtusa Leaves. Journal of the Korean Wood Science and Technology 43(4): 494-503.

Kim, J.Y., Kim, S.S., Oh, T.H., Baik, J.S, Song, G.P., Lee N.H., Hyun, C.G. 2009. Chemical composition, antioxidant, anti-elastase, and anti-inflammatory activities of Illicium anisatum essential oil. Acta Pharmaceutica 59: 289-300.

Kwon, D.J. 2005. Antioxidative activities on the extractives of Larix kaempfer Carr. needles. Master Disseration submitted to Kangwon National University, South Korea.

Kwon, D.J., Kim, J.K., Ham, Y.H., Bae, Y.S. 2007.

Flavone glycosides from the aerial parts of Lespedza cuneata G. Don. Journal of Applied Biological Chemistry 50(4): 344-347.

Lee, J.H., Chung, H.K., Baek, N. I., Kim, S.H., Hee, W.P., Dae, K.K. 2004. Phytochemical constituents from Diodia teres. Archives of Pharmacal Research 27(1): 40-43.

Lee, T.S., Min, H.J., Bae, Y.S. 2015. Phenolic Glycosides from Cercidiphyllum japonicum Leaves.

Journal of the Korean Wood Science and Technology 43(5): 591-599.

Lee, T.S., Ryu, W.G., Bae, Y.S. 2015. α-Glucosidase Inhibition Activity of the Extracts of Katsura Tree (Cercidiphyllum japonicum Sieb. Et Zucc) Leaves.

Journal of the Korean Wood Science and Technology 43(2): 238-247.

Lew, J.H., Kwak, J.H., Lee, K.R., Zee, O.P. 1998.

Flavonoids from Kylinga brevifolia var. leiolepsis.

Korean Journal of Pharmacognosy 29(2): 71-74.

Luo, W., Zhao, M., Yang, B., Shen, G. and Rao, G.

2009. Identification of bioactive compounds in Phyllenthus emblica L. fruit and their free radical scavenging activities. Food Chemistry 114(2): 499 -504.

Min, H.J., Bae, Y.S. 2017. Phenolic compounds from Japanese anise (Illcium anisatum L.) twigs. Journal of the Korean Wood Science and Technology 45(4):

456-462.

Owen, R.W., Haubner, R., Mier, W., Giacosa, A., Hull, W.E., Spiegelhalder, B., Bartsch, H. 2003. Isolation, structure eelucidation and antioxidant potential of the major phenolic and flavonoid compounds in brined olive drupes. Food and Chemical Toxicology 41: 703-717.

Pyo, M.K., Koo, Y.K., Yun-Choi, H.S. 2002. Anti- platelet effect of the phenolic constituents isolated from the leaves of Magnolia obovata. Natural Product Sciences 8(4): 147-151.

Rho, J.H., Moon, H.I., Zee, O.P. 2000. Phytochemical Constituents from Melampyrum roseum var.

hirsutum Beauv. Korean Journal of Pharmacognosy 51(2): 157-162.

Shibuya, M., Abe, K., Nakahahsi, Y., Kubota S. 1978.

Phenolic components from leaf oil of Illicium anisatum L. Chemical and Pharmaceutical Bulletin 26(9): 2671-2673.

Yamada, K., Takada, S., Nakamura, S., Hirata, Y. 1968.

Structures of anisatin and neoanisatin toxic sesquiterpenes from Illicium anisatum. Tetrahedron 24(1): 199-229.

Yamade, K., Takada, S., Nakamura, S., Hirata, Y. 1965.

Structure of anisatin. Tetrahedron Letters 52: 4797-

4801.

수치

Fig. 1. Chemical structures of isolated compounds.
Fig. 2. Selected HMBC correlations observed in  compound  4.

참조

관련 문서

In the analysis of soluble solids, the treatment group with material grains and the combined groups of glutinous millet and barley appeared high, and

Inhibitory effects of classified methanol extracts of Smilax china L on the COX-2 and iNOS expression of human colorectal cancer cell lines... Inhibitory

Comparison of genotypes using REP-PCR and Integron-IS26 PCR results among 78 IRAB strains isolated from 2 university hospitals.. The result of REP-PCR genotypes and

Figure.11 1 1 1.The cell growth, soluble glucan producti .The cell growth, soluble glucan producti .The cell growth, soluble glucan producti .The cell growth, soluble glucan

l Drop metal ball into the water l Oil droplet come out from bottom of water.. 두 경우 모두 결국은 속도가

– Applies to both organic and inorganic compounds.. 분류 : 일반적 two phases의 종류에 따라 명칭을 붙인다.. Classification of column chromatography methods.. solvent)

1 John Owen, Justification by Faith Alone, in The Works of John Owen, ed. John Bolt, trans. Scott Clark, "Do This and Live: Christ's Active Obedience as the

– If very small dimension structures have L< l ( the average distance between scattering events ), a large percentage of the carriers travel from the source to the