The Relationship between Coronary Artery Calcification and Renal Function in Nondialyzed Patients
Jae Hyun Chang,
1Ji Yoon Sung,
1Ji Yong Jung,
1Hyun Hee Lee,
1Wookyung Chung,
1Yon Mi Sung,
2and Sejoong Kim
1,31Departments of Internal Medicine and 2Radiology, Gachon University of Medicine and Science, Incheon;
3Department of Internal Medicine, Seoul National University Bundang Hospital, Seongnam, Korea.
Received: May 26, 2011 Revised: July 9, 2011 Accepted: September 27, 2011 Corresponding author: Dr. Sejoong Kim, Department of Internal Medicine, Seoul National University Bundang Hospital, 82 Gumi-ro 173beon-gil, Bundang-gu, Seongnam 463-707, Korea.
Tel: 82-31-787-7051, Fax: 82-31-787-4052 E-mail: [email protected]
∙ The authors have no financial conflicts of interest.
© Copyright:
Yonsei University College of Medicine 2012 This is an Open Access article distributed under the terms of the Creative Commons Attribution Non- Commercial License (http://creativecommons.org/
licenses/by-nc/3.0) which permits unrestricted non- commercial use, distribution, and reproduction in any medium, provided the original work is properly cited.
Purpose: Coronary artery calcification (CAC) has been described in individuals with chronic kidney disease (CKD), and its presence is associated with an in- creased risk of cardiovascular death. However, it is unclear whether there is an in- dependent relationship between renal function and CAC. Therefore, we evaluated the association between renal function and CAC. Materials and Methods: We retrospectively reviewed 870 Korean patients who had undergone computed to- mographic coronary angiography. The glomerular filtration rate (GFR) was esti- mated using the Modification of Diet in Renal Disease study formula with an eth- nic factor for the Korean population. The CKD stages were classified using estimated GFR (eGFR) and proteinuria. Results: The mean age of the participants was 56.8±11.8 years, and the mean eGFR was 89.4±16.5 mL/min/1.73 m2. Hyper- tension and diabetes were noted in 41.5 and 17.0% of patients, respectively. There were 584 and 286 patients with no CAC and with CAC, respectively. After adjust- ing for confounding variables, late stage CKD was associated with CAC [odds ra- tio (OR) 2.80, 95% confidence interval (CI) 1.05-7.46]. However, early stage CKD was not associated with CAC (OR 1.61, 95% CI 0.92-2.82). Diabetes was an independent risk factor of CAC (OR 2.06, 95% CI 1.36-3.13). There was no significant association between proteinuria and CAC (OR 1.65, 95% CI 0.96- 2.85). Conclusion: CAC is related to late stage CKD in nondialyzed patients.
These findings emphasize that individuals with CAC should be considered a high- risk population for decreased renal function.
Key Words: Chronic kidney disease, coronary artery calcification, proteinuria, re- nal function
INTRODUCTION
Cardiovascular disease (CVD) is a significant clinical problem and the most com- mon cause of morbidity and mortality in patients with chronic kidney disease (CKD).1 As the glomerular filtration rate (GFR) decreases, the relative risk of mor- tality from CVD increases.2 In patients with CKD, the rates of cardiovascular mor-
sified using the eGFR and proteinuria data.14 Stage 1 or 2 CKD was defined as proteinuria with eGFR ≥60 mL/min/
1.73 m2. Stage 3 or 4 CKD was defined as eGFR 15-60 mL/min/1.73 m2.
We assessed CAC using a Somatom Definitions dual- source CT scanner (Siemens Medical Systems, Forchheim, Germany), utilizing a calcium threshold of ≥130 Houn- sfield units. As Agatston, et al.15 described, CAC score was determined by multiplying the area of each calcified lesion by a weighting factor corresponding to the peak pixel inten- sity for each lesion. The sum of each lesion for all coronary arteries was used for analyses. All images were scored by a single radiologist. CAC was categorized as being either present (Agatston score >0) or absent.
The study protocol was approved by the local medical ethics committee.
Statistical analysis
The results are reported as mean±SD or numbers (percent- ages). Differences in baseline characteristics were com- pared across CKD stages using an analysis of variance and the chi-square test or Fisher’s exact test for categorical vari- ables, as appropriate. To identify the factors associated with each independent variable of CKD stage, diabetes and pro- teinuria, all variables with p<0.10 were entered into the multivariate regression analysis. The covariate-adjusted odds ratios (OR) and their 95% confidence intervals (CI) according to CKD stage, diabetes and proteinuria were de- rived in multiple logistic regression models for CAC. When the associations between the CAC score and various pa- rameters were evaluated, the distribution of CAC scores was non-normal; subsequently, the analysis comparing CAC score and renal function was performed using log- transformed [In (1+absolute CAC score)] CAC scores. In- dependent factors associated with CAC were determined by multiple linear regression analysis. Values with p<0.05 were considered statistically significant. The data analysis was conducted using SPSS software version 12.0 for Win- dows (SPSS Inc., Chicago, IL, USA).
RESULTS
The baseline characteristics of the study population are shown in Table 1. In total, 870 subjects were analyzed. The mean age of the participants was 56.8±11.8 years, and the mean eGFR was 89.4±16.5 mL/min/1.73 m2. There were bidity and mortality are higher than those in people with
normal renal function and are well behind the rates expected based on traditional risk factors.3 Therefore, other factors are responsible for the excessive cardiovascular events in CKD.
Numerous mechanisms link CKD and CVD. Traditional and nontraditional risk factors, such as mineral metabolism abnormalities, are associated with coronary artery calcifica- tion (CAC) in patients with coronary artery disease and CKD.4 Vascular calcification is a potential mechanism that explains the association between renal function and cardio- vascular mortality. Vascular calcification is a severe vascu- lar change that has been increasingly recognized as a signif- icant predictor of cardiovascular morbidity and mortality.
Some studies have shown that renal impairment is asso- ciated with higher CAC scores in non-dialysis and dialysis patients,5-9 while in other studies the association between impaired renal function and CAC either was not significant or strongly attenuated after adjusting for cardiovascular risk factors.10,11 It is unclear whether there is an independent re- lationship between renal function and CAC, as previous studies have produced conflicting results regarding this re- lationship. Therefore, this study evaluated the association between renal function and CAC in nondialyzed patients.
MATERIALS AND METHODS
Study population
We retrospectively reviewed 870 consecutive Korean sub- jects who had undergone multislice computed tomography (CT) coronary angiography at Gachon University Gil Hos- pital from January 2008 to December 2009. Their medical records were reviewed to obtain demographic data, infor- mation on the presence of traditional cardiac risk factors, blood pressure (BP), and laboratory results. Hypertension was defined as a systolic BP ≥140 mm Hg, a diastolic BP
≥90 mm Hg, or current use of antihypertensive medication.
Diabetes was defined as a fasting glucose ≥126 mg/dL or use of hypoglycemic medications. Body mass index (BMI) was calculated as weight in kilograms divided by height in meters squared. The estimated GFR (eGFR) was calculated from the serum creatinine level measured in closest prox- imity to the multislice CT coronary angiography using the Modification of Diet in Renal Disease study formula with an ethnic factor for the Korean population.12,13 Proteinuria was defined as the presence of +1 or more proteinuria upon random-urine dipstick analysis. CKD stages were then clas-
stage 1 or 2 CKD and 70.0% with stage 3 or 4 CKD.
The relationship between CAC and CKD stages is shown in Table 2. After adjusting for confounding variables, in- cluding age, gender, hypertension, and diabetes, CAC was associated with stage 3 or 4 CKD (OR 2.80, 95% CI 1.05- 7.46, p=0.039), but not with stage 1 or 2 CKD (OR 1.61, 95% CI 0.92-2.82, p=0.099).
The association of CAC with diabetes is shown in Table 3. Diabetics had CAC more frequently than non-diabetics (53.3% vs. 28.6%, p<0.001). After adjusting for confound- ing variables, including age, gender, hypertension, eGFR, and proteinuria, diabetes was a risk factor for CAC (OR 2.06, 95% CI 1.36-3.13, p<0.001).
The relationship between CAC and proteinuria is shown in Table 4. More subjects with proteinuria had CAC than those without proteinuria (49.4% vs. 31.0%, p=0.001).
There was an association between proteinuria and CAC in the unadjusted analysis, while there was no significant asso- ciation between proteinuria and CAC after adjusting for the confounding variables, including age, gender, hypertension, diabetes, and eGFR (OR 1.65, 95% CI 0.96-2.85, p=0.070).
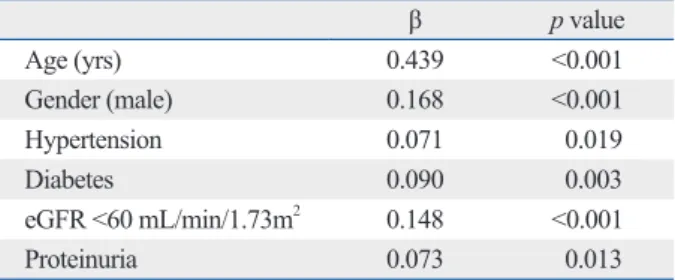
The multiple linear regression analysis for independent factors associated with the log-transformed CAC score is shown in Table 5. Therein, CAC scores were correlated with age, male, hypertension, diabetes, eGFR <60 mL/
min/1.73 m2, and proteinuria.
584 patients with CAC and 286 without CAC. Compared with the subjects without CKD, the patients with CKD were older, had a higher CAC score as well as lower albumin, and more of these patients had a history of diabetes and hyperten- sion. However, there was no significant difference in current smoking status, BMI, systolic BP, diastolic BP, calcium- phosphorus (Ca×P) product, or total cholesterol among the three groups.
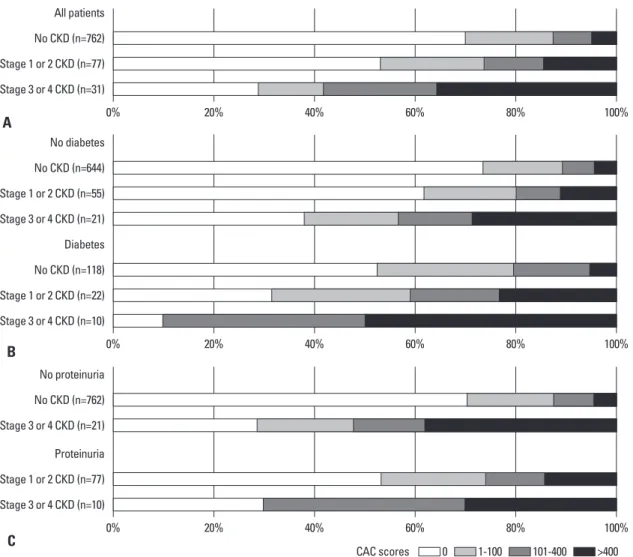
The distributions of CAC scores according to CKD stage in the total study population, in the nondiabetic and diabetic populations, and in the populations with and without pro- teinuria are shown in Fig. 1. For the total population without CKD, the CAC scores were 0, 1-100, 101-400, and >400 in 70.1, 17.6, 7.8, and 4.5%, respectively. The frequency of CAC was 1.5-fold higher among participants with stage 1 or 2 CKD (46.8%) and was more than 2-fold higher among participants with stage 3 or 4 CKD (71.0%), compared to participants without CKD (29.9%). In the nondiabetic popu- lation, CAC was detected in 26.2% of patients without CKD, 38.2% with stage 1 or 2 CKD, and 61.9% with stage 3 or 4 CKD. Among the diabetics, CAC was noted in 47.5%
of those without CKD, 68.2% with stage 1 or 2 CKD, and 90.0% with stage 3 or 4 CKD. In the population without proteinuria, CAC was seen in 29.9% of the patients without CKD and 71.4% of those with stage 3 or 4 CKD. Of those with proteinuria, CAC was seen in 46.8% of those with Table 1. Baseline Characteristics of the Study Population
Total (n=870) Chronic kidney disease stages
No. (n=762) Stage 1 or 2 (n=77) Stage 3 or 4 (n=31) p value
Age (yrs) 56.8±11.8 56.0±11.5 59.9±12.6 68.5±9.0 <0.001
Male (%) 419 (48.2) 372 (48.8) 37 (48.1) 10 (32.3) 0.195
Current smoker (%) 140 (16.1) 129 (16.9) 7 (9.1) 4 (12.9) 0.283
Hypertension (%) 361 (41.5) 296 (38.8) 44 (57.1) 21 (67.7) <0.001
Diabetes (%) 150 (17.0) 118 (15.5) 22 (28.6) 10 (32.3) 0.001
Body mass index (kg/m2) 25.1±3.5 25.0±3.4 25.8±4.0 25.7±4.1 0.163
Systolic BP (mm Hg) 128±18 128±18 130±19 129±20 0.401
Diastolic BP (mm Hg) 77±12 77±12 78±13 76±13 0.705
CAC score (AU) 92±337 62±227 201±475 567±1061 <0.001
eGFR (mL/min/1.73m2) 89.4±16.5 91.1±14.9 88.3±16.0 52.1±8.7 <0.001
Albumin (g/dL) 4.4±0.3 4.4±0.3 4.3±0.4 4.1±0.5 <0.001
Ca (mg/dL) 9.0±0.5 9.0±0.5 8.9±0.5 9.0±0.4 0.225
P (mg/dL) 3.8±0.6 3.8±0.6 3.8±0.8 4.1±0.8 0.021
Ca×P product (mg2/dL2) 34.2±6.7 34.1±6.6 34.1±7.2 37.2±7.0 0.084
Total cholesterol (mg/dL) 192±40 193±40 189±40 191±45 0.895
Triglyceride (mg/dL) 147±98 146±99 152±81 151±93 0.895
Proteinuria 87 (10.0) 0 (0) 77 (100) 10 (32.3) <0.001
BP, blood pressure; CAC, coronary artery calcification; eGFR, estimated glomerular filtration rate; Ca, calcium; P, phosphorus.
Data are expressed as mean±SD or number (%).
Stage 3 or 4 CKD (n=31)
Stage 3 or 4 CKD (n=10) Stage 3 or 4 CKD (n=21) Stage 3 or 4 CKD (n=10) Stage 3 or 4 CKD (n=21) Stage 1 or 2 CKD (n=77)
Stage 1 or 2 CKD (n=77) No CKD (n=762) Stage 1 or 2 CKD (n=22) Stage 1 or 2 CKD (n=55) No CKD (n=762)
Proteinuria No proteinuria No CKD (n=118) No CKD (n=644) All patients
Diabetes No diabetes
0%
0%
0%
20%
20%
20%
40%
40%
40%
60%
60%
60%
80%
80%
80%
100%
100%
100%
CAC scores 0 1-100 101-400 >400
C B A
Fig. 1. Distribution of coronary artery calcification (CAC) scores according to chronic kidney disease (CKD) stage. (A) All patients, (B) stratified by the presence of diabetes, and (C) stratified by the presence of proteinuria.
Table 2. Association of Coronary Artery Calcification (CAC) with Chronic Kidney Disease (CKD) Stage
No CKD Stage 1 or 2 CKD Stage 3 or 4 CKD
Participants with CAC [n/N (%)] 228/762 (29.9) 36/77 (46.7) 22/31 (71.0)
Unadjusted odds ratio (95% CI) 1.00 (reference) 2.06 (1.28-3.30) 5.73 (2.60-12.63)
Adjusted odds ratio (95% CI)* 1.00 (reference) 1.61 (0.92-2.82) 2.80 (1.05-7.46)
*Adjusted for age, gender, hypertension, and diabetes.
Table 3. Association of Coronary Artery Calcification (CAC) with Diabetes
No diabetes Diabetes p value
Participants with CAC [n/N (%)] 206/720 (28.6) 80/150 (53.3) <0.001
Unadjusted odds ratio (95% CI) 1.00 2.85 (1.99-4.08) <0.001
Adjusted odds ratio (95% CI)* 1.00 2.06 (1.36-3.13) <0.001
eGFR, estimated glomerular filtration rate.
*Adjusted for age, gender, hypertension, eGFR, and proteinuria.
Table 4. Association of Coronary Artery Calcification (CAC) with Proteinuria
No proteinuria Proteinuria p value
Participants with CAC [n/N (%)] 243/783 (31.0) 43/87 (49.4) 0.001
Unadjusted odds ratio (95% CI) 1.00 2.17 (1.39-3.39) <0.001
Adjusted odds ratio (95% CI)* 1.00 1.65 (0.96-2.85) 0.070
eGFR, estimated glomerular filtration rate.
*Adjusted for age, gender, hypertension, diabetes, and eGFR.
nondiabetic stratum.11 Two other studies reported positive relationships between CKD and CAC, yet both investiga- tions studied individuals with diabetes exclusively.22,23 In- creased CAC scores in CKD patients with diabetes may re- flect end-organ damage caused by multiple metabolic derangements. Decreased GFR in diabetic patients may contribute to changes in the levels of calcium-regulating glycoproteins or cytokines, which can interact with hyper- glycemia and accelerate the development or progression of atherosclerosis.11 Calcium precipitates in coronary athero- sclerotic arteries by the glycoproteins found in bone forma- tion.24 Decreased serum levels of extracellular calcium-reg- ulatory proteins have been implicated as risk factors for excess vascular calcification in patients with CKD25,26 and may be operative in patients who have diabetes and a de- creased GFR. However, the associations between CKD and CAC within these studies may have been confounded by a longer duration or increased severity of diabetes, rather than reflecting an independent association of kidney disease with calcification.
We observed that CAC scores were related to proteinuria and there was a likely association between proteinuria and the presence of CAC. There was an association between proteinuria and CAC in the unadjusted analysis, but the as- sociation was not statistically significant after multivariate adjustment. Cho, et al.19 found significant differences in the prevalence of CAC scores >100 between stage 3 CKD with and without proteinuria. A recent study showed that micro- albuminuria is associated with a greater incidence and de- gree of progression of CAC in individuals free of coronary heart disease.27 Further longitudinal studies are needed to evaluate the relationship between CAC and proteinuria.
Our study had several limitations. First, the study was retrospective; therefore, it was difficult to infer causality be- tween CAC and renal function, and selection bias may have influenced the results. Second, we had no data on medica-
DISCUSSION
This study found that CAC was related to a moderately im- paired renal function in nondialyzed patients. Renal func- tion may play an important role in the prevalence and pro- gression of CAC. It has been suggested that CAC starts early in the course of CKD and progresses with the deterio- ration in renal function.16 In an animal study, calcification of the aorta and heart in rats with a 5/6 nephrectomy accel- erated renal disease progression, and a reduction in the cal- cification-related changes may have ameliorated the renal dysfunction associated with renal calcification. It is possible that calcification-related changes are related to a decrease in GFR and that calcification of the heart may be an indicator of calcification-related changes.17 However, previous epide- miological studies found conflicting results regarding the relationship between renal function and CAC. Kramer, et al.11 evaluated 2660 participants with a median age of 49 years in the Dallas Heart Study and observed a strong asso- ciation between CKD and CAC among diabetic partici- pants. By contrast, Fox, et al.10 evaluated 319 participants in the Framingham Heart Study, with a mean eGFR of 86 mL/
min/1.73 m2 and a mean age of 60 years, and observed an association between a lower eGFR and a higher prevalence of CAC in an unadjusted analysis, but the association was of marginal statistical significance after multivariate adjust- ment for cardiovascular risk. Watanabe, et al.16 revealed that the prevalence of severe CAC increased gradually based on the progression of CKD, but the result was not significant.
Ix, et al.18 showed that the higher burden of CAC is unlike- ly to explain the association between mild to moderate kid- ney dysfunction found among 6749 participants in the Multi-Ethnic Study of Atherosclerosis, with a mean GFR of 79 mL/min/1.73 m2 and a mean age of 63 years. Cho, et al.19 found no significant association between a decrease in eGFR and a CAC score >100 after adjusting for proteinuria and other confounding factors. This discrepancy might be explained by differences in the characteristics of the study populations, such as age, renal function and comorbidity, as well as the use of different CAC criteria.
Diabetes is a strong risk factor for vascular calcification independent of renal function.20,21 The association between CKD and increased CAC score differs substantially with the presence of diabetes. In the Dallas Heart Study, a strong association was found between CKD and CAC among par- ticipants with diabetes, but no association was found in the
Table 5. Multiple Linear Regression Analysis for Indepen- dent Factors Associated with Log-Transformed Coronary Artery Calcification Scores
β p value
Age (yrs) 0.439 <0.001
Gender (male) 0.168 <0.001
Hypertension 0.071 0.019
Diabetes 0.090 0.003
eGFR <60 mL/min/1.73m2 0.148 <0.001
Proteinuria 0.073 0.013
eGFR, estimated glomerular filtration rate.
the Dallas Heart Study. J Am Soc Nephrol 2005;16:507-13.
12. Lee CS, Cha RH, Lim YH, Kim H, Song KH, Gu N, et al. Ethnic coefficients for glomerular filtration rate estimation by the Modifi- cation of Diet in Renal Disease study equations in the Korean population. J Korean Med Sci 2010;25:1616-25.
13. Levey AS, Bosch JP, Lewis JB, Greene T, Rogers N, Roth D. A more accurate method to estimate glomerular filtration rate from serum creatinine: a new prediction equation. Modification of Diet in Renal Disease Study Group. Ann Intern Med 1999;130:461-70.
14. National Kidney Foundation. K/DOQI clinical practice guidelines for chronic kidney disease: evaluation, classification, and stratifi- cation. Am J Kidney Dis 2002;39(2 Suppl 1):S1-266.
15. Agatston AS, Janowitz WR, Hildner FJ, Zusmer NR, Viamonte M Jr, Detrano R. Quantification of coronary artery calcium using ul- trafast computed tomography. J Am Coll Cardiol 1990;15:827-32.
16. Watanabe R, Lemos MM, Manfredi SR, Draibe SA, Canziani ME.
Impact of cardiovascular calcification in nondialyzed patients after 24 months of follow-up. Clin J Am Soc Nephrol 2010;5:189-94.
17. Kawata T, Nagano N, Obi M, Miyata S, Koyama C, Kobayashi N, et al. Cinacalcet suppresses calcification of the aorta and heart in uremic rats. Kidney Int 2008;74:1270-7.
18. Ix JH, Katz R, Kestenbaum B, Fried LF, Kramer H, Stehman- Breen C, et al. Association of mild to moderate kidney dysfunction and coronary calcification. J Am Soc Nephrol 2008;19:579-85.
19. Cho I, Min HS, Chun EJ, Park SK, Choi Y, Blumenthal RS, et al.
Coronary atherosclerosis detected by coronary CT angiography in asymptomatic subjects with early chronic kidney disease. Athero- sclerosis 2010;208:406-11.
20. Katz R, Wong ND, Kronmal R, Takasu J, Shavelle DM, Probst- field JL, et al. Features of the metabolic syndrome and diabetes mellitus as predictors of aortic valve calcification in the Multi- Ethnic Study of Atherosclerosis. Circulation 2006;113:2113-9.
21. Schurgin S, Rich S, Mazzone T. Increased prevalence of signifi- cant coronary artery calcification in patients with diabetes. Diabe- tes Care 2001;24:335-8.
22. Qunibi WY, Abouzahr F, Mizani MR, Nolan CR, Arya R, Hunt KJ. Cardiovascular calcification in Hispanic Americans (HA) with chronic kidney disease (CKD) due to type 2 diabetes. Kidney Int 2005;68:271-7.
23. Mehrotra R, Budoff M, Hokanson JE, Ipp E, Takasu J, Adler S.
Progression of coronary artery calcification in diabetics with and without chronic kidney disease. Kidney Int 2005;68:1258-66.
24. Wexler L, Brundage B, Crouse J, Detrano R, Fuster V, Maddahi J, et al. Coronary artery calcification: pathophysiology, epidemiolo- gy, imaging methods, and clinical implications. A statement for health professionals from the American Heart Association. Writ- ing Group. Circulation 1996;94:1175-92.
25. Ketteler M, Wanner C, Metzger T, Bongartz P, Westenfeld R, Gladziwa U, et al. Deficiencies of calcium-regulatory proteins in dialysis patients: a novel concept of cardiovascular calcification in uremia. Kidney Int Suppl 2003:S84-7.
26. Ketteler M, Bongartz P, Westenfeld R, Wildberger JE, Mahnken AH, Böhm R, et al. Association of low fetuin-A (AHSG) concen- trations in serum with cardiovascular mortality in patients on dial- ysis: a cross-sectional study. Lancet 2003;361:827-33.
27. DeFilippis AP, Kramer HJ, Katz R, Wong ND, Bertoni AG, Carr J, et al. Association between coronary artery calcification progres- sion and microalbuminuria: the MESA study. JACC Cardiovasc Imaging 2010;3:595-604.
tion use, such as the use of phosphate binders or lipid-low- ering agents.
In conclusion, CAC is related to late stage CKD in non- dialyzed patients. Our findings emphasize that individuals with CAC should be considered a high-risk population for decreased renal function. This might help explain the in- creased risk of cardiovascular disease in patients with CKD.
Further exploration is clearly needed to evaluate the rela- tionship between CAC and renal function.
ACKNOWLEDGEMENTS
This work was supported by intramural grant of Gachon University Gil Hospital.
REFERENCES
1. Parfrey PS, Foley RN. The clinical epidemiology of cardiac dis- ease in chronic renal failure. J Am Soc Nephrol 1999;10:1606-15.
2. Go AS, Chertow GM, Fan D, McCulloch CE, Hsu CY. Chronic kidney disease and the risks of death, cardiovascular events, and hospitalization. N Engl J Med 2004;351:1296-305.
3. Russo D, Corrao S, Miranda I, Ruocco C, Manzi S, Elefante R, et al. Progression of coronary artery calcification in predialysis pa- tients. Am J Nephrol 2007;27:152-8.
4. Nakamura S, Ishibashi-Ueda H, Niizuma S, Yoshihara F, Horio T, Kawano Y. Coronary calcification in patients with chronic kidney disease and coronary artery disease. Clin J Am Soc Nephrol 2009;4:1892-900.
5. Raggi P, Boulay A, Chasan-Taber S, Amin N, Dillon M, Burke SK, et al. Cardiac calcification in adult hemodialysis patients. A link between end-stage renal disease and cardiovascular disease? J Am Coll Cardiol 2002;39:695-701.
6. Braun J, Oldendorf M, Moshage W, Heidler R, Zeitler E, Luft FC.
Electron beam computed tomography in the evaluation of cardiac calcification in chronic dialysis patients. Am J Kidney Dis 1996;
27:394-401.
7. Goodman WG, Goldin J, Kuizon BD, Yoon C, Gales B, Sider D, et al. Coronary-artery calcification in young adults with end-stage renal disease who are undergoing dialysis. N Engl J Med 2000;
342:1478-83.
8. Oh J, Wunsch R, Turzer M, Bahner M, Raggi P, Querfeld U, et al.
Advanced coronary and carotid arteriopathy in young adults with childhood-onset chronic renal failure. Circulation 2002;106:100-5.
9. Russo D, Palmiero G, De Blasio AP, Balletta MM, Andreucci VE.
Coronary artery calcification in patients with CRF not undergoing dialysis. Am J Kidney Dis 2004;44:1024-30.
10. Fox CS, Larson MG, Keyes MJ, Levy D, Clouse ME, Culleton B, et al. Kidney function is inversely associated with coronary artery calcification in men and women free of cardiovascular disease: the Framingham Heart Study. Kidney Int 2004;66:2017-21.
11. Kramer H, Toto R, Peshock R, Cooper R, Victor R. Association between chronic kidney disease and coronary artery calcification: