DOI:http://dx.doi.org/10.21218/CPR.2016.4.2.042 eISSN 2508-125X
The Effects of WO 3 Nanoparticles Addition to the TiO 2
Photoelectrode in Dye-Sensitized Solar Cells
Hong Ha Thi Vu ․ Yoon-Hwae Hwang* ․ Hyung-Kook Kim*
Department of Nano Energy Engineering and BK21 PLUS Nanoconvergence Technology Division, Pusan National University, Miryang 50463, Republic of Korea
ABSTRACT: Increasing the efficiency of dye-sensitized solar cells (DSSCs) by the fabrication of new photoelectrodes (PEs) is an important challenge. This study examined the photovoltaic parameters of DSSCs composed of a TiO
2PE with WO
3nanoparticles (NPs).
A number of PEs with the same thickness but different concentrations of WO
3NPs in the TiO
2PE were prepared. The morphology and structural properties of the prepared PEs were examined by field-emission scanning electron microscopy and X-ray diffraction, respectively. The effects of the WO
3NPs mixing concentration on the efficiency of DSSCs were investigated under simulated solar light irradiation.
Key words: TiO
2, WO
3, Dye-sensitized solar cells
*Corresponding author: [email protected], [email protected] Received April 29, 2016; Revised May 13, 2016;
Accepted May 25, 2016
ⓒ 2016 by Korea Photovoltaic Society
This is an Open Access article distributed under the terms of the Creative Commons Attribution Non-Commercial License (http://creativecommons.org/licenses/by-nc/3.0)
which permits unrestricted non-commercial use, distribution, and reproduction in any medium, provided the original work is properly cited.
Nomenclature
V
OC: open circuit voltage, V
J
SC: short circuit current density, mA/cm
2FF : fill factor
PCE : power conversion efficiency, %
Subscript
DSSCs : dye-sensitized solar cells PE : photoelectrode
NP : nanoparticle
FTO : fluorine doped tin oxide
N719 : di-tetrabutylammonium cis-bis(isothiocyanato) bis(2.2’-bipyridyl-4, 4’-dicarboxylato) ruthenium (II)
EIS : electrochemical impedance spectroscopy XRD : X-ray diffraction
FE-SEM : field emission-scanning electron microscopy CB : conduction band
VB : valance band
1. Introduction
In recent years, solar energy as a green and sustainable energy source has attracted considerable attention in global energy.
Among them, dye sensitized solar cells (DSSCs) are relatively inexpensive, efficient, relatively simple to fabricate and clean.
Since the first report by Gratzel’s group in 1991, DSSCs have been studied to improve their power conversion efficiency (PCE) and are currently undergoing rapid development for practical use
1). A basic DSSC consists of a photoelectrode (PE) with a semiconducting thin film with an absorbed ruthenium complex dye deposited on a conducting substrate (fluorine doped tin oxide (FTO)), a counter electrode with FTO glass coated platinum, and a liquid electrolyte containing a redox couple. The light harvesting ability, amount of dye absorption, and the efficiency of charge separation are the three main factors that should be considered when attempting to improve the efficiency of solar cells. Many wide band gap semiconductors have been evaluated as potential electron acceptors for DSSCs, such as TiO
2, ZnO, SnO
2, and Nb
2O
51-5). Among them, TiO
2has the highest efficiency because of its high dye absorption and rapid electron transport. Generally, the high efficiency of DSSCs with the photo injected electrons in the TiO
2are collected at the back contact of the PE in high yield. This requires that the transport time of electrons through the TiO
2is much faster than their lifetime, which in turn, is determined by the recombination
42
of electrons with the oxidized dye or with redox couple in the electrolyte. Therefore, it is a factor limiting the efficiency of DSSCs
6). In addition, a photosensitized dye usually uses a Ru-complex (such as N719, N3), which absorbs photons from sunlight and injects electrons into the conduction band of TiO
2. On the other hand, they only absorb visible light in the wavelength range, 300-800 nm
7,8). Therefore, most of the solar light is not utilized. If the UV light can be absorbed, the photocurrent of the DSSCs will increase, leading to improved efficiency.
Tungsten oxide (WO
3) is one of the most important n-type semiconductor materials, and a promising candidate for water splitting
9,10), photocatalysis
11,12), DSSCs
13-15), gas sensors
16,17), and electrochromic devices
18,19). The band gap of WO
3depends on its crystal structure in the range, 2.6-3.1 eV, which responds to the blue-UV region of the sunlight spectrum
11,13). Therefore, WO
3has a smaller band gap than anatase TiO
2(3.2 eV). In addition, WO
3has a higher carrier mobility than TiO
2. This study investigated the photovoltaic performance of DSSCs fabricated with the addition of WO
3NPs. Different concentrations of WO
3NPs were mixed with TiO
2NPs to form a PE in DSSC.
2. Experiment
2.1 DSSC fabrication
The TiO
2(P25) NPs were purchased from Sigma-Aldrich and used as received. The TiO
2paste was prepared as reported elsewhere
20). Different amounts of WO
3NPs powder were dispersed in 5 ml of absolute ethanol under ultrasonication for 15 minutes. Subsequently, 4 ml of a TiO
2paste was then added and stirred vigorously with a magnetic bar for 3 hours to evaporate the ethanol. The weight ratios of the WO
3NPs in the TiO
2NPs paste were 5, 10 and 15 wt.%.
During cell preparation, the FTO glass substrate was cleaned sequentially with deionized water, acetone, and ethanol in an ultrasonic bath. A thin film of TiO
2mixed with the desired amount of WO
3NPs was coated uniformly on a FTO glass substrate using the doctor blade method, and dried for 5 minutes at 100°C. The coating procedure was repeated to thicken the mixture layer. The PE was then annealed at 500°C for 1 hour to remove all the organic components. The PE was soaked in a 0.1 M TiCl
4solution at 70°C for 30 minutes, rinsed with water and ethanol, and sintered at 500°C for 1 hour. The prepared PE was immersed overnight in a ruthenium dye solution containing N719 (Solaronix S. A.) in ethanol at room temperature and finally rinsed with pure ethanol, and dried with a continuous
flow of nitrogen. The counter electrode was fabricated by the dip-coating of a FTO glass substrate into a chloroplatinic acid H
2PtCl
6(37.5% Pt basis) solution followed by annealing at 400°C for 30 minutes in air. The cell was assembled by attaching the dye absorbed PE to the counter electrode using a 100 μm hot-melt polypropylene spacer. The liquid electrolyte (Dyesol- TIMO) was injected into the internal space between the sand- wiched cell through a hole in the back of the counter electrode, which was sealed using a piece of hot melting film and a cover glass. The other samples were also fabricated using a similar method to compare their efficiency.
2.2 Characterization
The crystal structures of samples were analyzed by X-ray diffraction (XRD, Bruker D8 Discover) using Cu-K α (λ = 0.15405 nm) radiation in the 2θ range of 10 to 70°. The morphology and composition of these samples were investigated by field-emission scanning electron microscopy (FESEM, Hitachi- S4700). Elemental analysis was determined by energy dispersive X-ray spectroscopy (EDX; Horiba, 6853-H). The current density- voltage curves of the devices were recorded under simulated solar light AM 1.5 G illumination at a light intensity of 100 mW cm
−2(Abet Technologies). The active areas of the solar cells were 0.16 cm
2. The electrochemical impedance spectra (EIS) were measured by applying the open circuit voltage under 100 mW cm
−2illumination, and the data was recorded over the frequency range, 0.1-100 kHz, using an ac potential pulse with an amplitude of 10 mV. An equivalent circuit model was fitted to the impedance spectra obtained using Z-view software.
3. Results and discussion
3.1 Crystal structures and morphologies
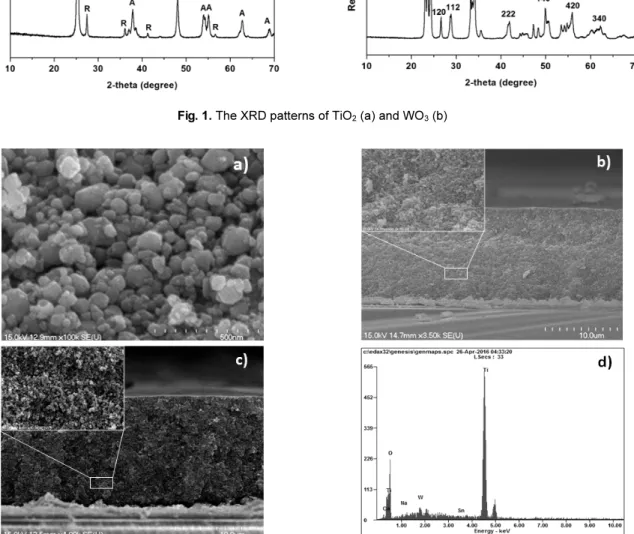
XRD was performed to determine the purity and crystallinity.
Fig. 1(a) presents the XRD pattern of the TiO
2NPs taken in the 2 θ scan range, 10-70° . The XRD pattern showed that the TiO
2NPs have a crystalline structure containing a mixture of anatase
(marked as A) and rutile (marked as R) phases. The XRD peaks
at 25.3°, 37.8°, 47.9°, 53.8°, 55.0°, 62.4
o, and 68.8
owere
responded to the (101), (004), (200), (105), (211), (204), and
(116) planes of anatase TiO
2phase (JCPDS no. 21-1272),
respectively. The peaks at 27.5°, 36.1°, 41.0
o, and 56.6° were
assigned to the (110), (101), (111) and (220) planes of the rutile
phase (JCPDS no. 21-1276), respectively. No additional peak of
other phases were detected. Fig. 1(b) shows the XRD pattern of
Fig. 1. The XRD patterns of TiO2 (a) and WO3 (b)
Fig. 2. FE-SEM images of WO3 nanoparticles (a), low (scale bar 10 μm) and high (scale bar 1 μm) magnification FE-SEM images of the photoelectrode composed of TiO2 (b) and TiO2/WO3 (c). EDX analysis of the TiO2+ 10%WO3 PE surface (d)
the WO
3powder. The results confirmed the formation of pure monoclinic WO
3crystalline phase (JCPDS no. 43-1035) without any impurity peaks
21). The XRD peaks are sharp and strong indicating a high crystallinity of samples.
Fig. 2(a) shows FE-SEM images of the WO
3NPs. The WO
3particles were separated with a mean particle size ranging from 50 to 200 nm. Fig. 2(b) and (c) present cross-sectional FE-SEM images of the photoelectrode coating on a FTO glass substrate.
The thin film of the PEs was uniform and contained compact TiO
2P25 particles, approximately 14 μm in thickness, whereas the thickness of the TiO
2+ 10% WO
3particles mixture layer was approximately 13.8 μm. The different concentrations of
WO
3particles PE were prepared using a similar method. The
morphology of the TiO
2mixed with 5% and 15% WO
3NPs PEs
were similar to the mixture TiO
2+ 10% WO
3particles PE (data
not shown). Because small amount of WO
3particles in the TiO
2colloid, WO
3nanoparticles in the mixture PE could not be
observed. The EDX analysis of the TiO
2+10%WO
3PE was
performed to present of WO
3NPs within TiO
2. Fig. 2(d) shows
the spectra revealed the present of Ti, O, and W elements on the
surface of the TiO
2+10%WO
3PE. Besides, the Ca, Na, Sn
elements are from FTO glass. Therefore, WO
3particles were
confirmed to be present in TiO
2NPs.
Fig. 3. J-V curves of DSSCs composed with different PEs
Table 1. Performance parameters of DSSCs with different PE types
PE type JSC
(mA/cm2) VOC
(V) FF
(%) PCE
(%)
TiO2 12.23 0.74 68.70 6.22
TiO2 + 5% WO3 12.92 0.72 63.33 5.89
TiO2 +10% WO3 13.36 0.70 57.44 5.38
TiO2 + 15% WO3 12.60 0.67 57.44 4.89
Fig. 4. The EIS Nyquist plots of DSSCs comprised of different PEs and the equivalent circuit model of these DSSCs
3.2 Photoelectrochemical characterization
Fig. 3 presents the current density- voltage characteristics of the different PEs of DSSCs under simulated 1.5 AM solar illumination. Table 1 lists the measured corresponding parameters with the photocurrent density (J
SC), open-circuit voltage (V
OC), fill factor (FF), and power conversion efficiency (PCE) of the solar cells. The current density, J
SC, of the devices with WO
3were higher than that of the TiO
2only devices (Table 1). The maximum current density was 13.36 mA/cm
2for the DSSC with TiO
2+10%WO
3PE. The current density increased with increasing WO
3concentration until the weight ratio was10%, beyond which, J
SCdecreased. The enhanced J
SCoriginated mainly from the absorption of the blue-UV region of the sunlight spectrum owing to the low band gap of WO
3, which results in more incident solar light being harvested and an enhanced J
SC.
The open circuit voltage generated under illumination corresponds to the difference between the Fermi level of the electron in the semiconductor and the redox potential of the electrolyte. The open circuit voltage, V
OC, of the DSSC with TiO
2particles PE was the highest compared to the other DSSCs examined and V
OCdecreased with increasing concentration of WO
3NPs in TiO
2. The decreasing V
OCwas attributed to the conduction band gap edge position of WO
3being more positive than TiO
2; it was reported to be in the region of 0 V relative to NHE
14). Although
the DSSCs with the WO
3NPs have a higher current density but a lower V
OCand FF than the cell without WO
3, the device containing only TiO
2displayed the highest photovoltaic parameters:
J
SC= 12.23 mA/cm
2, V
OC= 0.74 V, FF= 68.70% and PCE=
6.22%. The results were negative because the conduction band (CB) of WO
3is lower than that of TiO
2but the valence band (VB) of WO
3is higher than that of TiO
222,23). Therefore, the band structures in the WO
3/TiO
2couple do not favor the separation of charge carriers
24). On the other hand, some W sites can act as charge recombination centers according to the following scheme
22):
W
6++ e
(TiO2) CB- →W
5+W
5++ e
(TiO2) VB+→ W
6+Consequently, WO
3or TiO
2itself can be a remarkable recombination center for holes and electrons.
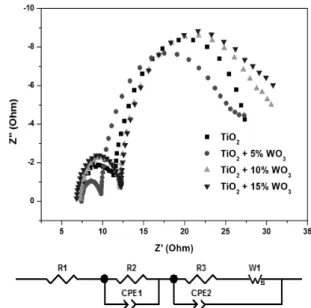
Electrochemical impedance spectroscopy (EIS) was performed
for a better understanding of the charge transfer inside the
DSSCs. Fig. 4 shows the EIS Nyquist plots of the different PEs
of DSSCs and the EIS data was fitted to the corresponding
equivalent circuit model using Z-view software. In all EIS
spectra, there were two well-defined semicircles. The first
semicircle at the high frequency region is related to the
impedance of the charge transfer process occurring at the
interface of the electrolyte and the counter electrode, whereas
the other semicircle at the lower frequency region provides
information on the impedance at the TiO
2-WO
3/dye/electrolyte
Fig. 5. UV-vis absorption spectra of N719 dye loading in different PEs
interface related to recombination, which is important for determining the efficiency of these DSSCs. The interfacial resistance of the TiO
2/dye/electrolyte was 15.88 Ω for the nanoporous TiO
2cell. The interfacial resistance of the TiO
2-WO
3/dye/electrolyte was 16.01 Ω, 18.53 Ω, and 18.61 Ω for TiO
2+ 5% WO
3, TiO
2+ 10% WO
3, and TiO
2+ 15% WO
3PEs in the solar cells, respectively. An increase in the interfacial resistance of the TiO
2-WO
3/dye/electrolyte means an increase in the recombination rate, suggesting a low electron transfer in the cells. As a result, the efficiency of the DSSC with WO
3particles is reduced.
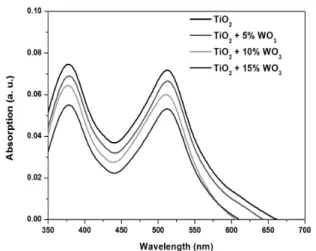
Generally, a higher level of N719 dye absorption in PEs provides more effective photocurrent generation, which will result in an increase in efficiency. To determine the influence of different concentrations of WO
3on the performance of the absorbed dye, the loaded dye from the different PEs were estimated by UV-vis absorption spectroscopy.
Fig. 5 represents N719 dye desorption in a 0.1M NaOH solution from the base TiO
2photoelectrode films and mixed TiO
2and WO
3photoelectrode films. The results show that the dye loaded on the bare TiO
2film was the highest compared to the other PEs and the sensitized dye absorption decreased with increasing amount of WO
3NPs in the PEs due to the lower surface area of WO
3compared toTiO
2. Although there was a smaller amount of dye absorbed on the photoanodes containing WO
3NPs, the photocurrent was enhanced by adding WO
3to the PEs. This might be because the low band gap of WO
3responds to the blue-UV region of the solar spectrum. Therefore, the improvement in the photocurrent of DSSC can be attributed to the WO
3NPs enhancing incident light harvesting.
4. Conclusions
Tungsten oxide nanoparticles were introduced as a photo- electrode in DSSCs. A composite PE with TiO
2and WO
3exhibited a higher current density in the cell compared to that using TiO
2P25 only. On the other hand, the efficiency of the DSSCs with the WO
3nanoparticles was lower than those without WO
3. These negative results can be explained by the higher recombination rate of holes and electrons and the smaller amount of dye absorbed on the PEs containing WO
3NPs.
Acknowledgments
This work was supported by a 2-Year Research Grant of Pusan National University.
References
1. O’Regan, B., Gratzel, M., “A low-cost high-efficiency solar cell based on dye sensitized colloidal TiO2 films,” Nature, Vol. 353, pp. 737-740, 1991.
2. Sakai, N., Miyasaka, T., Murakami,T. N., “Efficiency en- hancement of ZnO-based Dye-sensitized solar cells by low-tem- perature TiCl4 treatment and dye optimization,” J. Phys. Chem.
C, Vol. 117, No. 21, pp. 10949-10956, 2013.
3. Lee, J. H., Park, N. G., Shin, Y. J., “Nano-grain SnO2 electro- des for high conversion efficiency SnO2-DSSC,” Solar Energy Materials& Solar cells, Vol. 95, pp. 179-183, 2011.
4. Kay, A., Gratzel, M., “dye-sensitized core-shell nanocrystals:
Improved Efficiency of Mesoporous Tin Oxide Electrodes Coated with a Thin Layer of an Insulating Oxide,” Chem.
Mater., Vol. 14, No. 7, pp. 2930-2935, 2002.
5. Le Viet, A., Jose, R., Reddy, M.V., Chowdari, B. V. R., Ramakrisna, S., “Nb2O5 Photoelectrodes for Dye-Sensitized Solar Cells: Choice of the Polymorph,” J. Phys. Chem. C, Vol.
114, No. 49, pp. 21795-21800, 2010.
6. Paulsson, H., Kloo, L., Hagfeldt, A., Boschloo, G., “Electron transport and recombination in dye-sensitized solar cells with ionic liquid electrolytes,” Journal of Electroanalytical Chemistry, Vol. 586, pp. 56-61, 2006.
7. Klein, C., Nazeeruddin, M. K., Liska, P., Censo, D. D., Hirata, N., Palomares, E., Durrant, J. E., Gratzel, M., “Engineering of a novel ruthenium sensitizer and its application in dye-sensi- tized solar cells for conversion of sunlight into electricity,”
Inorg. Chem., Vol 44, pp 178-180, 2005.
8. Nazeeruddin, M. K., Kay, A., Rodicio, I., Humphry-Baer, R., Mueller, E., Liska, P., Vlachopoulos, N., Gratzel, M., “Conversion of light to electricity by cis-X2bis(2,2'-bipyridyl-4,4'-dicarbox- ylate)ruthenium(II) charge-transfer sensitizers (X = Cl-, Br-, I-,
CN-, and SCN-) on nanocrystalline titanium dioxide electro- des,” J. Am. Chem. Soc., Vol. 115, pp. 6382-6390, 1993.
9. Liu, X., Wang, F., Wang, Q., Nanostructure-based WO3 pho- toanodes for photoelectrochemical watersplitting, Phys. Chem.
Chem. Phys., Vol. 14, pp. 7894-7911, 2012.
10. Cristino, V., Caramori, S., Argazzi, R., Meda, L., Marra, G. L., Bignozzi, C. A., “Efficient Photoelectrochemical Water Splitting by Anodically Grown WO3 Electrodes,” Langmuir, Vol. 27, No. 11, pp. 7276-7284, 2011.
11. Wang, F., Valentin, C. D., Pacchioni, G., “Rational band gap engineering of WO3 photocalalyst for visible water splitting,”
Chemcatchem, Vol. 4, pp. 476-478, 2012.
12. Szilagyi, I. M., Fórizs,B., Rosseler, O., Szegedi, A., Nemeth, P., Kiraly, P., Tarkanyi, G, Vajna, B., Varga-Josepovits, K., Laszlo, K., Toth, A. L., Baranyai, P., Leskela, M., “WO3 pho- tocatalysts: Influence of structure and composition,” Journal of Catalysis, Vol. 294, pp. 119-127, 2012.
13. Yong, S. M., Nikolay, T., Ahn, B. T., Kim, D. K., “One-dimen- sional WO3 nanorods as photoelectrode for dye-sensitized solar cell,” J. Alloys Compd., Vol. 547, pp. 113-117, 2013.
14. Zheng, H., Tachibana, Y., Kalantar-zadeh, K., Dye-sensitized solar cells based on WO3,” Langmuir, Vol. 26, No. 24, pp.
19148-19152, 2010.
15. Shaikh, S. F., Kalanur, S. S., Mane, R. S., Joo, O. S.,
“Monoclinic WO3 nanorods–rutile TiO2 nanoparticles core– shell interface for efficient DSSCs,” Dalton Trans., Vol. 42, pp.
10085-10088, 2013.
16. Siciliano, T., Tepore, A., Micocci, G., Serra, A., Manno, D., Filippo, E., “WO3 gas sensors prepared by thermal oxidization of tungsten,” Sensors and Actuators B: Chemical, Vol. 133, pp.
321-326, 2008.
17. Zeng, J., Hu, M., Wang, W., Chen, H., Qin, Y., “NO2-sensing
properties of porous WO3 gas sensor based on anodized sput- tered tungsten thin film,” Sensors and Actuators B: Chemical, Vol. 161, pp. 447-452, 2012.
18. Papaefthimiou, S., Leftheriotis, G., Yianolis, Y., “Advanced electrochromic devices based on WO3 thin films,” Electrochimia Acta, Vol. 46, pp. 2145-2150, 2001.
19. Liang, L., Zhang, J., Zhou, Y., Xie, J., Zhang, X., Guan, M., Pan, B., Xie, Y., “High-performance flexible electrochromic device based on facile semiconductor-to-metal transition real- ized by WO3·2H2O ultrathin nanosheets,” Scientific reports, Vol. 3, Acticle number 1936, pp. 1-8, 2013.
20. Vu, T. H. H., Atabaev, T. S., Ahn, J. Y., Nguyen, N. D., Kim, H. K., Hwang, Y. H., “Dye-sensitized solar cells composed of photoactive composite photoelectrodes with enhanced solar energy conversion efficiency,” J. Mater. Chem. A, Vol. 3, pp.
11130-11136, 2015.
21. Yang, B., Zhang, Y., Drabarek, E., Barnes, P. R. F., and Luca, V., “Enhanced photoelectrochemical activity of sol-gel tung- sten trioxide films through textural control,” Chemistry of Materials, Vol. 19, No. 23, pp. 5664–5672, 2007.
22. Zhang, H., Chen, G., Bahnemann, D. W., “Photoelectrocatalytic materials for environmental application,” J. Mater. Chem., Vol. 19, pp. 5089-5121, 2009
23. Shaban, A. Y., Khan, S. U. M., “Photoresponse of Visible Light Active CM-n-TiO2, HM-n-TiO2, CM-n-Fe2O3, and CM-p-WO3 towards Water Splitting Reaction,” Hindawi publishing corpo- ration, Internatinal Journal of Photoenergy, Vol. 2012, article ID 749135, pp. 1-20, 2012.
24. Higashimoto, S., Sakiyama, M., Azuma, M., “Photoelectrochemical properties of hybrid WO3/TiO2 electrode. Effect of structure of WO3 on charge separation behavior,” Thin Solid Film, Vol.
503, pp. 201-206, 2006.