ISSN 2234-3806 • eISSN 2234-3814
http://dx.doi.org/10.3343/alm.2013.33.5.309
The Role of Cardiac Biomarkers in the Diagnosis and Management of Patients Presenting with Suspected Acute Coronary Syndrome
Eric Christenson, M.D.1 and Robert H. Christenson, Ph.D.2
Department of Medicine1, Johns Hopkins Hospital; Department of Pathology2, University of Maryland School of Medicine, Baltimore, USA Myocardial infarction (MI) is the leading cause of death in the developed world. Biomark-
ers have an essential role in diagnosis, risk stratification, guiding management and clinical decision making in the setting of patients presenting with signs and symptoms of MI. Car- diac troponin (cTn) rose to prominence during the 1990s and has evolved to be the cor- nerstone for diagnosis of MI. The current criteria for MI diagnosis include a rise and/or fall in cTn with at least one value above the 99th percentile of the upper reference limit. Along with cTn, the natriuretic peptides B-type natriuretic peptide (BNP) and amino-terminal proBNP (NT-proBNP) have an important role in determining prognosis and guiding man- agement. As assays for cTn have been evolved that are capable of reliably detecting smaller and smaller quantities in the blood, a dilemma has emerged as to how to use this new information. Several studies have attempted to answer this question and have shown that these lower concentrations of cTn have important prognostic significance and, more importantly, that intervention in these patients leads to improved clinical outcomes. New algorithms incorporating BNP, NT-proBNP, and more sensitive cTn assays hold promise for more rapid diagnosis or rule-out of MI, allowing for appropriate management steps to be initiated and more efficient and effective utilization of healthcare resources.
Key Words: Cardiac troponin I, Cardiac troponin T, BNP, Myocardial infarction, Manage- ment, Cardiac biomarkers
Received: May 17, 2013 Revision received: June 3, 2013 Accepted: July 1, 2013 Corresponding author:
Robert H. Christenson
Department of Pathology, University of Maryland School of Medicine, 22 South Greene Street, Baltimore, MD 21201, USA Tel: +1-410-328-8672
Fax: +1-410-328-0990 E-mail: [email protected]
© The Korean Society for Laboratory Medicine.
This is an Open Access article distributed under the terms of the Creative Commons Attribution Non-Commercial License (http://creativecom- mons.org/licenses/by-nc/3.0) which permits unrestricted non-commercial use, distribution, and reproduction in any medium, provided the original work is properly cited.
INTRODUCTION
Each year in the United States (US) alone, there are approxi- mately 1.5 million cases of myocardial infarction (MI), which translates to nearly 600 cases per 100,000 individuals. There are 6 to 9 million urgent care presentations that require evaluation for possible cardiac ischemia, which consumes substantial US healthcare resources. Due to improvements in the management of these patients, from 1999 to 2009 the relative rate of death at- tributable to CVD declined by 32.7%. However in 2009, CVD still accounted for 32.3% (787,931) of all 2,437,163 deaths, or 1 of every 3 deaths in the US [1].
Based on the patient’s electrocardiogram (ECG), MI can be divided into two subtypes: ST segment elevation MI (STEMI) and non-ST elevation MI (NSTEMI). The role of biochemical markers is very different in STEMI vs. NSTEMI. For STEMI pa- tients, biomarkers are prognostic and play a useful confirmatory role for diagnosis. On the other hand, in NSTEMI biochemical markers have a pivotal role in diagnosis, differentiation from un- stable angina and guiding management [2].
The predominant cause of myocardial necrosis and MI is the acute coronary syndromes (ACS), or type 1 MI [3]. ACS is a continuum of myocardial ischemia ranging from unstable an- gina with no irreversible cardiac injury to frank MI with large ar-
eas of myocardial cell death. The root cause of ACS is unstable plaque within the coronary arteries. Rupture of coronary plaque causes their thrombogenic contents to become exposed to the circulation. This leads to platelet activation, initiation of the coag- ulation cascade and other physiological effects resulting in myo- cardial ischemia. A second class of MI, type 2, is related to a supply/demand mismatch resulting from coronary spasm, high or low blood pressure, anemia, arrhythmia or stenosis due to a fixed atherosclerotic lesion [3]. Although ACS is the predomi- nant etiology for cardiac necrosis, it is important to note that there are several other etiologies that also cause myocardial ischemia [3]. As shown in Fig. 1, type 3 MI describes patients who suffer from cardiac sudden death, and types 4a, 4b, and 5 MI are related to interventional procedures. Regardless of the pathobiology, myocardial necrosis due to myocardial ischemia is designated as MI [3, 4]. In this review, the focus will be on types 1 and 2 MI because these patients usually present to the emer- gency department or urgent care, and biochemical markers are the cornerstone for diagnosis and management.
The biochemical markers myoglobin and the MB isoenzyme of creatine kinase (CK-MB) are increased in plasma after myo- cardial injury and have been utilized clinically as cardiac mark- ers of ischemia since the late 1970s. However, these early bio-
chemical markers have gradually fallen out of favor and in the 1990s the cardiac biomarkers field emerged into what may be termed the ‘era of cardiac troponin’. Currently cardiac troponin (cTn) is the preferred marker for diagnosis and management of suspected MI patients [3, 5].
Troponin (Tn) is a ternary structural protein complex that plays an essential role as a calcium sensitive ‘molecular switch’
in striated muscle contraction [6]. The three members of the Tn complex are designated TnC, TnI, and TnT. The TnC subunit binds intracellular calcium; the calcium-binding signal is trans- mitted to the thin filament by the other two Tn subunits; TnI is the inhibitory subunit and TnT acts as the tropomyosin-binding subunit. Cardiac specific isoforms of TnI and TnT are expressed exclusively by cells in the myocardium; this exclusivity is what makes TnI and TnT so special among cardiac biomarkers.
These isoforms are termed cardiac TnI (cTnI) and cardiac TnT (cTnT). The mechanism by which cTnI and cTnT are released into circulation has not been fully elucidated but possibilities suggested include normal turnover of myocardial cells, apopto- sis, cellular release of cTn degradation products, increased cel- lular wall permeability, formation and release of membranous blebs, and myocyte necrosis [7]. Although early cTn assays were considered a replacement test for CK-MB, the biomarkers
Fig. 1. Classification of myocardial infarction based on the third universal definition of myocardial infarction. Adapted with permission from J Am Coll Cardiol 2012;60:1581-8.
Type 1: Spontaneous myocardial infarction
Spontaneous myocardial infarction related to atherosclerotic plaque rupture, ulceration, fissuring, erosion, or dissection with resulting intraluminal thrombus in one or more of the coronary arteries leading to decreased myocardial blood flow or distal platelet emboli with ensuing myocyte necrosis. The patient may have underlying severe CAD but on occasion non-obstructive or no CAD.
Type 2: Myocardial infarction secondary to an ischemic imbalance
In instances of myocardial injury with necrosis where a condition other than CAD contributes to an imbalance between myocardial oxygen supply and/or demand, e.g. coronary endothelial dysfunction, coronary artery spasm, coronary embolism, tachy-/brady-arrhythmias, anemia, respiratory failure, hypotension, and hypertension with or without LVH.
Type 3: Myocardial infarction resulting in death when biomarker values are unavailable
Cardiac death with symptoms suggestive of myocardial ischemia and presumed new ischemic ECG changes or new LBBB, but death occurring before blood samples could be obtained, before cardiac biomarker could rise, or in rare cases cardiac biomarkers were not collected.
Type 4a: Myocardial infarction related to percutaneous coronary intervention (PCI)
Myocardial infarction associated with PCI is arbitrarily defined by elevation of cTn values >5×99th percentile URL in patients with normal baseline values (≤99th percentile URL) or a rise of cTn values >20% if the baseline values are elevated and are stable or falling. In addition, either (i) symptoms suggestive of myocardial ischemia, or (ii) new ischemic ECG changes or new LBBB, or (iii) angiographic loss of patency of a major coronary artery or a side branch or persistent slow-or no-flow or embolization, or (iv) imaging demonstration of new loss of viable myocardium or new regional wall motion abnormality are required.
Type 4b: Myocardial infarction related to stent thrombosis
Myocardial infarction associated with stent thrombosis is detected by coronary angiography or autopsy in the setting of myocardial ischemia and with a rise and/
or fall of cardiac biomarkers values with at least one value above the 99th percentile URL.
Type 5: Myocardial infarction related to coronary artery bypass grafting (CABG)
Myocardial infarction associated with CABG is arbitrarily defined by elevation of cardiac biomarker values >10×99th percentile URL in patients with normal baseline cTn values (≤99th percentile URL). In addition, either (i) new pathological Q waves or new LBBB, or (ii) angiographic documented new graft or new native coronary artery occlusion, or (iii) imaging evidence of new loss of viable myocardium or new regional wall motion abnormality.
are not equivalent [8]. In fact, 12% to 39% of patients who were negative for CK-MB, i.e. below the biomarker’s MI cutoff, had cTn results classified as positive for MI [8]. These data raised the question as to whether discordant cTn and CK-MB results were cTn false positives, or if cTn represented a more clinically sensitive indicator of cardiac necrosis. Subsequent meta-analy- ses answered this question by showing that patients with posi- tive cTnT and cTnI results indeed had a higher short term risk for adverse outcomes [9, 10]. These data contributed to cTn’s evolution into the preferred cardiac marker for the diagnosis of MI as well as other clinical applications [3, 5]. It is noteworthy that cTn is elevated in a great many other conditions involving the heart [11] and therefore an elevated cTn is a finding that represents the likely occurrence of myocardial necrosis and does not in and of itself provide any indication of the etiology [12]. Therefore a most important nuance is that cTnT and cTnI are cardiac specific markers, not disease markers (e.g., MI).
Here we will offer insights about various laboratory medicine aspects of cTn and discuss its utilization. An important resource that should be considered compulsory reading for laboratory practitioners is the “American College of Cardiology Foundation (ACCF) 2012 Expert Consensus Document on Practical Clinical Considerations in the Interpretation of Troponin Elevations” [13].
This document was a collaborative effort between laboratory medicine through the American Association for Clinical Chemis- try and clinical representation from the American College of Chest Physicians, American College of Cardiology (ACC), Ameri- can College of Emergency Physicians, American Heart Associa- tion (AHA) and Society for Cardiovascular Angiography and In- terventions. It is noteworthy that the AHA and ACCF are cur- rently in the final phases of developing guidelines for diagnosis and management of NSTEMI. Once these guidelines are pro- mulgated their knowledge must also be considered compulsory.
INTERPRETATION
More than 30 yr ago a report from the International Society and Federation of Cardiology and the World Health Organization de- fined the criteria for the diagnosis of ischemic heart disease [14]. In this document the diagnosis of acute MI was based on fulfilling 2 of the following 3 criteria: 1) clinical history, 2) ECG findings, and 3) temporal changes in serum enzymes. A diag- nosis based on considering 2 of these 3 criteria equally was necessary at the time because of broad variation in clinical pre- senting symptoms, the fact that the ECG is frequently con- founded and because the biochemical markers available in the
1970s were not specific for myocardial injury. The discovery of more cardiac specific biomarkers, cTnT and cTnI, in the early 1990s completely changed this dynamic [15].
Based on evidence available from the 1990s, the National Academy of Clinical Biochemistry promulgated the need for in- corporation of blood cTn measurements into the diagnosis of MI [16]. This statement initiated the notion that any amount of myocardial necrosis caused by ischemia should be labeled as MI. The evolution of analytically sensitive and specific cTn as- says measurement technologies necessitated the re-evaluation of established definitions of MI. Shortly thereafter in 1999, a joint committee of the European Society of Cardiology (ESC) and the ACCF was convened to re-examine the MI definition [12]. The result was a consensus that the preferred biochemical marker for detecting myocardial necrosis was cTn and that a maximal concentration of cTnT or cTnI that exceeded the operative threshold on at least 1 occasion during the first 24 hr after an index clinical ischemic event indicated MI [12]. The operative threshold for MI that was defined by consensus at this confer- ence was the 99th percentile of the values for a reference con- trol, which of course is linked to a potential false positive rate of 1%. In 2007 this definition was updated to include a rise and/or fall in biomarkers (preferably cTn) [4], and in 2012 a further up- date was published by a global task force [3].
Fig. 2 displays the universal definition of MI which states that the term should be used when there is evidence of myocardial necrosis in a clinical setting consistent with acute myocardial ischemia [3]. With the appropriate clinical and diagnostic pic- ture, detection of a rising and/or falling pattern of cTn with at least one value above the 99th percentile of a reference control population meets the criteria for MI.
EVOLUTION OF cTn ASSAYS
The 2000 Global Task Force redefinition of MI [12] challenged the cardiac markers field to improve the analytic requirements of cTnI and cTnT assays. Instead of cTn being considered a re- placement test for CKMB, cTn was thrust into the central role of being virtually essential for the diagnosis of MI. Further, the re- definition document recommended an important analytical characteristic to help avoid patient misclassification. The recom- mendation was that cTn assays have a 10% total CV at the 99th percentile cutoff. At the time that this redefinition was published, no available cTn assay could meet the requirements specified [17]. This necessitated the development of more sensitive cTn assays with limits of detection and quantification in harmony
with the MI redefinition. Analytic based guidelines were pub- lished that included recommendations for characteristics such as the amino acid targets, specimen type and stability in addi- tion to specifying the imprecision [18]. As a result, there has been an evolution of cTn assays having characteristics that meet or exceed these recommendations. A current listing of the char- acteristics of clinical and research assays is available on the In- ternational Federation of Clinical Chemistry (IFCC) website [19].
CLASSIFICATION OF cTn ASSAYS
Unfortunately, the terminology used to describe the evolving generations of cTn assays remains haphazard and no univer- sally accepted nomenclature for assays currently exists. Termi- nology such as ‘Ultra’, ‘high sensitivity (hs)’, ‘4th generation’,
‘guideline compliant’ and so on have been used for naming, of- ten due to marketing considerations, without regard to assay characteristics. In summary, assays coined “Ultra” or “hs-cTn”
do not necessarily represent superior performance. Assays with many of these designations may be updated versions of earlier assays, thus they required a different “flashy” trade name to distinguish them from earlier versions of the tests. Or these as- say may indeed be improved, next-generation assays with better performance characteristics that are able to reliably measure in- creasingly low levels of cTn. Information and evidence collated
on the IFCC website are helpful in determining actual docu- mented assay performance.
One system of nomenclature for different cTn assays which involves assigning them a specific designation based on their analytical performance and their ability to reliably measure Tn in normal populations, has been recently published [20]. With this proposed system assays are classified as conventional, contem- porary sensitive, high sensitivity or super sensitive with an indi- cation of evidence for use in MI diagnosis and risk stratification.
However the very highest performing ‘super sensitive assays’
have not been adequately validated for these applications. The main issue with this and other systems is that ‘contemporary’ is a term that will change with time. A more descriptive and repro- ducible system for designating Tn assays would be based on their ability to reliably detect a proportion of a normal reference control cohort. For example, the contemporary sensitive assays would be 10% assays because they can reliably measure this proportion of normal. High sensitivity assays would be desig- nated as assays able to reliably measure >50% of normal sub- jects, and super sensitive assays would be able to quantify 95% of a normal cohort. A common sample cohort of carefully char- acterized normal reference control individuals would be ideal for this purpose.
Fig. 2. Definition of myocardial infarction. Adapted with permission from J Am Coll Cardiol 2012;60:1581-8.
Definition of Myocardial Infarction Criteria for acute myocardial infarction
The term acute myocardial infarction (MI) should be used when there is evidence of myocardial necrosis in a clinical setting consistent with acute myocardial ischemia. Under these conditions any one of the following criteria meets the diagnosis for MI:
• Detection of a rise and/or fall of cardiac biomarker values [preferably cardiac troponin (cTn)] with at least one value above the 99th percentile upper reference limit (URL) and with at least one of the following:
∙ Symptoms of ischemia.
∙ New or presumed new significant ST-segment–T wave (ST–T) changes or new left bundle branch block (LBBB).
∙ Development of pathological Q waves in the ECG.
∙ Imaging evidence of new loss of viable myocardium or new regional wall motion abnormality.
∙ Identification of an intracoronary thrombus by angiography or autopsy.
• Cardiac death with symptoms suggestive of myocardial ischemia and presumed new ischemic ECG changes or new LBBB, but death occurred before cardiac biomarkers were obtained, or before cardiac biomarker values would be increased.
• Percutaneous coronary intervention (PCI) related MI is arbitrarily defined by elevation of cTn values (>5×99th percentile URL) in patients with normal baseline values (≤99th percentile URL) or a rise of cTn values >20% if the baseline values are elevated and are stable or falling. In addition, either (i) symptoms suggestive of myocardial ischemia or (ii) new ischemic ECG changes or (iii) angiographic findings consistent with a procedural complication or (iv) imaging demonstration of new loss of viable myocardium or new regional wall motion abnormality are required.
• Stent thrombosis associated with MI when detected by coronary angiography or autopsy in the setting of myocardial ischemia and with a rise and/or fall of cardiac biomarker values with at least one value above the 99th percentile URL.
• Coronary artery bypass grafting (CABG) related MI is arbitrarily defined by elevation of cardiac biomarker values (>10×99th percentile URL) in patients with normal baseline cTn values (≤99th percentile URL). In addition, either (i) new pathological Q waves or new LBBB, or (ii) angiographic documented new graft or new native coronary artery occlusion, or (iii) imaging evidence of new loss of viable myocardium or new regional wall motion abnormality.
IMPLICATIONS OF INCREASINGLY SENSITIVE cTn ASSAYS
As cTn assays with higher analytical sensitivity have evolved, it has become possible to reliably measure values in the region of the 99th percentile of normal populations. This ability contrasts with earlier ‘conventional’ assays, in which reliable measure- ment of cTn values was possible only at levels several fold higher than the 99th percentile. The ability of sensitive cTn as- says to detect smaller quantities of cTn release provides earlier reliable detection of clinically important cTn elevations. This al- lows for more rapid diagnosis of MI compared to previous con- ventional assays [21, 22].
Initially there was significant concern among the laboratory and clinical practice communities that sensitive assays with their lower detection limits confused the clinical picture in pa- tients. The issue is underscored by quotes such as “when tro- ponin was a lousy assay it was a great test, but now that it’s be- coming a great assay, it’s getting to be a lousy test.” [23].
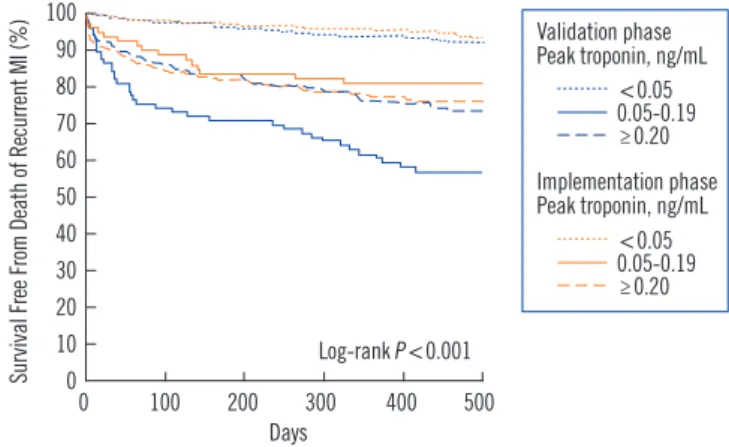
Are more sensitive assays picking up clinically insignificant Tn release, or does detection contribute to improved patient out- comes? Stated differently: Do patients with signs and symptoms of MI have better outcomes if the 99th percentile is utilized as the MI cutoff, versus use of a higher Tn cutoff like that neces- sary with earlier cTn assays? Mills et al. [24] examined this question by evaluating the clinical impact of replacing a conven- tional cTnI assay with a cutoff of 0.20 ng/mL with a new more sensitive cTnI assay having a cutoff of 0.05 ng/mL. In this study suspected MI patients were analyzed in three strata based on their cTnI results: 1) <0.05 ng/mL, below the 99th percentile of the new sensitive assay, 2) between 0.05 and 0.19 ng/mL, and 3)
≥0.20 ng/mL, the cutoff for earlier conventional assay’s decision limit. The study design included two phases: the first was the validation phase, in which patients (n=1,038) had the sensitive cTnI measurement, but the previous conventional assay’s MI cutoff of 0.2 ng/mL was used for decision making. The second phase was implementation; in which the 99th percentile value of
<0.05 ng/mL was used as the MI cutoff for these patients (n=1,054). Event-free survival at 1 yr (i.e. patients absent recur- rent MI and mortality) was the measured outcome. Fig. 3 shows that outcomes in the validation phase for the patients with levels
<0.05 ng/mL were low at <7% and event-free survival of pa- tients with results >0.20 ng/mL was about 24% at 1 yr. However, patients who had cTnI values between 0.05 and 0.19 ng/mL were at highest risk with 1 yr events at -40%, about 2-fold higher compared to the >0.20 ng/mL strata. This is possibly secondary
to lower rates of intervention and risk modification. In the imple- mentation phase when the sensitive assay’s cutoff of <0.05 ng/
mL was used for decision making, Fig. 3 shows that the 1-yr outcomes for both the <0.05 and >0.20 ng/mL strata were vir- tually identical to the validation phase. However, the 0.05 to 0.20 ng/mL strata had outcomes that were ~50% (39% down to 21%) improved from in the implementation phase. Therefore, implementation of the lower 99th percentile diagnostic cTnI threshold was associated with major reductions in 1-yr mortality and recurrent MI [24]. Patients with signs and symptoms of MI have better outcomes if a sensitive assay’s 99th percentile is uti- lized as the MI cutoff, versus use of a higher Tn cutoff such as that necessary with earlier cTn assays.
Although sensitive cTn assays do present an advantage com- pared to higher cut point conventional assays, the benefit of higher sensitivity assays compared to sensitive assays in the context of MI diagnosis is unclear. In one comparative study, the area under the time-dependent ROC curve was not different be- tween these assays, indicating that the tests were essentially equivalent for making the diagnosis of MI [22]. Highly sensitive assays may, however, cause a diagnostic dilemma as to what to do with newly detectable elevations that do not exceed the 99% MI cutoff. Outcome-based studies in this cohort will be needed to examine this point.
DEFINING A RISE AND/OR FALL IN cTn
Initially, the joint committee of the ESC and ACC in 2000 predi- cated the redefinition of an acute or evolving MI on a single cTn value exceeding the 99th percentile of a reference control popu- lation [12]. Presumably because of specificity issues involving
Survival Free From Death of Recurrent MI (%)
100 90 80 70 60 50 40 30 20 10
00 100 200 300 400 500
Days
Log-rank P <0.001
<0.05
≥0.20 0.05-0.19 Validation phase Peak troponin, ng/mL
<0.05
≥0.20 0.05-0.19 Implementation phase Peak troponin, ng/mL
Fig. 3. Implementation of a sensitive cardiac troponin I assay and risk of recurrent myocardial infarction and death in patients with suspected acute coronary syndrome. Adapted with permission from JAMA 2011;305:1210-6.
elevations in cTn that were not MI, the definition was revised in 2007 [4] and 2012 [3] to include a typical rise and/or fall of bio- markers of myocardial necrosis, i.e., cTn, in addition to at least one value exceeding the 99th percentile of a normal reference population. However, neither of these later task force docu- ments explicitly stated how a rise and/or fall should be defined.
Approaches examining relative temporal changes or absolute changes in levels have been postulated as ways to mitigate di- minished specificity.
RELATIVE CHANGES FOR ACUTE MI DIAGNOSIS
One strategy to more quantitatively express the rise and/or fall in cTn is to calculate a percentage change over time, termed the relative percentage change. For example, for a presentation cTn of 4.0 ng/L followed by a serial 2-hr cTn of 9.0 ng/L, the relative percentage change equals [(9-4)/4]×100=125 (%). Determin- ing the percent change that fulfills criterion for a “rise and/or fall” has been a topic of active discussion. However, there is general agreement that the relative change used for interpreta- tion of acute MI must exceed the natural biological variance plus the analytical variability of the measurement.
Most studies examining the relative percentage change have used a baseline measurement at presentation and follow-up cTn measurement between 1 and 6 hr later [2, 16]. Literature reviews have demonstrated that cTn elevations occur in many clinical situations besides ischemic cardiac damage [11, 25], and it is important to note that in addition to acute MI, other acute cardiac conditions including dysrhythmias and acute de- compensated failure may also produce substantial temporal % changes in cTn.
Numerous relative percentage change values have been re- ported that reflect biological variability as well as both the reactiv- ity of reagents with the cTn antigen(s) and the method impreci- sion. A general reference value of 15-20% was suggested for the relative percentage change as part of guidelines for diagnosis of acute MI [2, 16]. A more recent paper quotes relative percentage change thresholds of 46% for an increasing pattern or 32% for a decreasing cTn on the contemporary sensitive Centaur Ultra-TnI method [26]. A study that examined the hs-TnT assay utilized ROC curve methodology to determine optimal relative percent- age change values [27]. Importantly, these authors accounted for the time differences in their determinations; they reported a rela- tive percentage change value of 117% from presentation to the 3-hr sampling and 243% from presentation to the 6-hr sampling.
In this study the 4th generation cTnT measurement (cut point 13 ng/L) was initially negative ( <10 ng/L) and then converted to positive (≥30 ng/L). This choice of reference standard may well have biased the study towards needing a high relative percent- age change for the hs-TnT assay [27].
Use of a cTn relative percentage change of ≥20% has been tested in suspected ACS patients with sensitive assays and was found to have significantly increased specificity for acute MI [28, 29]. Diagnostic specificity was also increased using the hs-TnT relative change values determined using ROC curves [27]. How- ever, there is an important tradeoff because use of relative change in cTn values reduced sensitivity [28, 29] and opens the possibility of misclassification of a large number of patients at increased risk.
Using a specified relative percentage change value involves a complicated balance between diagnostic sensitivity and speci- ficity. Also, the cTn release kinetics is unpredictable and vari- able in many NSTEMI cases, further confounding use of spe- cific relative percentage change values. In addition, the magni- tude of the relative percentage change is time dependent; rela- tive change more than doubled when 0 to 6 hr sampling was used compared to 0 to 3 hr sampling [27], and therefore collect- ing samples at specific times is implicit for interpretation.
ABSOLUTE cTn CHANGE AND MI DIAGNOSIS
Absolute change in cTn involves comparing the cTn concentra- tion at patient presentation with the value in a second sample typically collected either one or two hr later. An example of ab- solute change would be: presentation cTnT =5.0 ng/L, and a 1-hr cTn=12.0 ng/L; the absolute change is the difference=7.0 ng/L. The objective of an absolute cTn change is early MI diag- nosis/rule out of MI, or risk assessment. Of interest, the evi- dence so far indicates that there is not a substantial difference between sampling at 1 hr or 2 hr after patient presentation and using the absolute increase strategy with a sensitive cTnI method (Ultra) or hs-TnT [30].
An algorithm derived for clinical diagnostic use of hs-TnT [31] will be discussed in section 10 below.
COMPARING THE USE OF RELATIVE VS.
ABSOLUTE CHANGE FOR DIAGNOSIS OF MI
Contrasting the relative percentage change strategy and abso- lute change strategies with simple examples can remove confu- sion and add insight into interpretation of cTn temporal pat-
terns. An illustration for the hs-TnT method demonstrates this point. If the presentation cTnT is 13 ng/L (the hs-TnT cutoff) and the 1-hr cTn is 16 ng/L, then the absolute change is 3 ng/L, the relative percentage change for this same example is (3/13)×
100=23 (%). If the threshold is 25% for relative percentage change, then this case would be negative for acute MI. How- ever, with the absolute change strategy, this case would be in the observational zone [31]. This case illustrates that higher baseline cTn values may have a confounding impact on relative percentage change. Consider a second illustration where the presentation hs-cTnT value is 150 ng/L and the 1 hr value is 170 ng/L; here the absolute change is 20 ng/L, and the relative per- centage change is (20/150)×100=13.3 (%). The quantity of cTnT released is greater than in the illustration above; the pa- tient would be classified as negative using a relative percentage change threshold of 25%. However, the patient would rule in for MI with the absolute method. These examples show that in situ- ations where the patient presents with low baseline cTn levels, relative percentage change can fluctuate dramatically with very small absolute changes. Therefore relative percentage change has a large dependence on the presenting cTn value; while the absolute value is not dependent on the cTn concentration at patient presentation. Evidence comparing the relative percent- age change and absolute change strategies indicates that the absolute strategy is superior in the early hr after patient presen- tation [30].
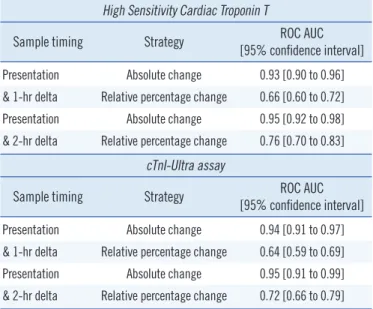
A recent study compared the accuracy of MI diagnosis for both the relative percentage change and absolute change strat- egies using both the hs-cTnT (Roche Diagnostics, Basel, Swit- zerland) and the cTnI-Ultra method (Siemens Healthcare Diag- nostics, Erlangen, Germany). This multicenter study included a cohort of 836 patients presenting to the emergency department
with symptoms suggestive of acute MI [30]. Sampling for the study hs-cTnT and cTnI-Ultra measurements were collected at presentation and then 1 and 2 hr later. Final patient diagnosis of MI was adjudicated by 2 independent cardiologists, who re- viewed all available medical records but were blinded to the hs- cTnT and cTnI-Ultra measurements. The prevalence of acute MI in the study population was 13% [30].
As shown in Fig. 4, the difference in overlap between MI and other conditions for the relative percentage change (Panel A) and absolute change (Panel B) was striking. The ROC area un- der the curves (AUCs) listed in Table 1 for the strategies show that the absolute change is dramatically better to diagnose MI
Relative percentage Change (%)
300
200
100
0
-100 AMI Unstable
anglana Cardiac but
not CAD Non-cardiac
chest pain Unknown Panel A
hs-cTnT 1 hr relative changes cTnl Ultra 1 hr relative changes cTnl Ultra 2 hr relative changes hs-cTnT 2 hr relative changes
Absolute increase (ug/L)
0.300
0.200
0.100
0.000
AMI Unstable
anglana Cardiac but
not CAD Non-cardiac chest pain Unknown Panel B
hs-cTnT 1 hr absolute changes cTnl Ultra 1 hr absolute changes cTnl Ultra 2 hr absolute changes hs-cTnT 2 hr absolute changes
Fig. 4. Utility of relative (panel A) and absolute changes (panel B) in cardiac troponin concentrations in the early diagnosis of acute myocar- dial infarction. Adapted with permission from Circulation 2011; 124:136-45.
Table 1. The receiver operator characteristic area under the curve (ROC AUC) for two strategies of quantifying the rise and/or fall in cardiac troponin using different sample timing for calculation of change (Differences between two strategies were highly significant (P <0.001) [32]; See text for detail)
High Sensitivity Cardiac Troponin T
Sample timing Strategy ROC AUC
[95% confidence interval]
Presentation Absolute change 0.93 [0.90 to 0.96]
& 1-hr delta Relative percentage change 0.66 [0.60 to 0.72]
Presentation Absolute change 0.95 [0.92 to 0.98]
& 2-hr delta Relative percentage change 0.76 [0.70 to 0.83]
cTnI-Ultra assay
Sample timing Strategy ROC AUC
[95% confidence interval]
Presentation Absolute change 0.94 [0.91 to 0.97]
& 1-hr delta Relative percentage change 0.64 [0.59 to 0.69]
Presentation Absolute change 0.95 [0.91 to 0.99]
& 2-hr delta Relative percentage change 0.72 [0.66 to 0.79]
compared to the relative percentage change. All differences be- tween the ROC AUC comparisons between the relative percent- age change and absolute change strategies were highly signifi- cant (P <0.001) [30].
LEVERAGING HIGH-SENSITIVITY ASSAYS TO MAKE EARLIER MANAGEMENT DECISIONS
The use of new cTn technology and approaches for evaluating the rise and/or fall of cTn for the diagnosis of MI could play an important role in the improved management of acute-onset chest pain presenting to the emergency department. Holding patients to rule out of MI often places significant burden on emergency departments while discharging patients home with NSTEMI is associated with a 2-fold increase in mortality [31].
Reichlin et al. [31] combined either high sensitivity or sensitive cTn assays with the use of absolute change cut-offs to develop a novel strategy for early diagnosis or rule out of MI in patients presenting with acute-onset chest pain.
In this study, 872 patients who presented to the emergency department with signs and symptoms of suspected MI were en- rolled. The first half of the cohort (n=436) had serial cTnT col- lections and underwent traditional management. Data from the first half were used as an algorithm derivation data set to deter- mine the appropriate cut-off points for presenting levels and ab- solute changes in later samples. Cutoffs were derived that al- lowed for 100% sensitivity after 1 hr (100% negative predictive value) for MI to identify a group of patients for whom MI could be safely ruled-out and who could be sent home from the emer- gency department. The authors determined rule-out criteria to be defined for their study as initial hs-cTnT level lower than 12 ng/L and an absolute change over the first hr of <3 ng/L. Rule- in criteria was set as initial hs-cTnT level higher than 52 ng/L or absolute change over the first hr of >5 ng/L. Patients who did not fit the rule-out or rule-in criteria were held in the emergency department for observation. This algorithm was then validated in the second group of 436 patients; these patients were fol- lowed up at 30 days and 3, 12, and 24 months after presenta- tion to determine if patients sent home had an elevated risk of death [31].
Results showed that 259 of the 436 (60%) patients could be ruled out for MI after 1 hr; 67 patients (17%) were ruled in, and the remaining 101 patients (23%) fell in between the two cut-off points and required additional observation in the emergency department. Of these patients, 8 (8%) were subsequently deter- mined to have suffered from a MI.
Follow-up survival rates at 30 days were 99.8%, 98.6%, and 95.3% for the rule-out, observation, and rule-in groups, respec- tively. These data confirmed the usefulness of this algorithm for risk stratification. Subsequent 24-month follow-up showed a continuation of this trend with survival rates of 98.1%, 89.1%, and 85.4% for the respective groups.
While these results are exciting, they demand replication with the hope that a new algorithm-based tool may provide the op- portunity for stratification of risk with earlier triage, optimizing both patient care and efficiency of the healthcare system [31].
NATRIURETIC PEPTIDES: B-TYPE NATRI- URETIC PEPTIDE (BNP) AND AMINO-TERMI- NAL PRO B-TYPE NATRIURETIC PEPTIDE (NT-proBNP)
The natriuretic peptides BNP and NT-proBNP are also useful for risk assessment in suspected MI patients. BNP represents the active hormone and when it is released from myocytes acts to reduce hemodynamic stressors such as wall stretch through natriuresis, vasodilation, inhibition of the renin-angiotensin-aldo- sterone axis and sympathetic nervous system [32, 33]. NT- proBNP, on the other hand, is an inactive co-metabolite of the common intracellular precursor [34]. BNP and NT-proBNP are predominantly released from the cardiac ventricles in response to hemodynamic stresses such as wall stretch or tension. Ana- lytically, the measurement of NT-proBNP is advantageous com- pared to BNP as it is more stable after collection and upon long- term freezing; NT-proBNP also has a longer biological half-life [34]. As a result of the greater frozen stability, most epidemio- logical studies have examined NT-proBNP for prognostic stud- ies and it will be the focus here.
Although BNP and NT-proBNP are most commonly associ- ated with a clinical role in the diagnosis or rule-out of congestive heart failure, they have been evaluated for use in MI for prog- nostication, risk stratification, and rule-out of ACS in low-risk pa- tients [2, 16]. Gene expression of this molecule is up-regulated in the presence of myocardial ischemia and thus a rational mechanism exists for its elevation in this setting, even in the ab- sence of hemodynamic changes [35].
INCORPORATION OF NT-proBNP INTO DIAGNOSTIC MODELS FOR RULE-OUT MI
NT-proBNP’s ability to indicate structural heart disease along with its correlation with ACS, infarct severity and prognostic im-
plications post-MI confer the potential for its use in a variety of roles in the evaluation and management of this disease process [36]. NT-proBNP’s use in combination with cTn has been shown in studies to improve the diagnostic ability of clinicians to differentiate between MI, unstable angina, and non-cardiac causes of chest pain [36]. cTn is the most heart-specific marker of myocardial damage, but NT-proBNP has been shown to have slightly better prognostic sensitivity [37, 38]. The incorporation of this marker into an algorithm to examine ACS reportedly adds to the sensitivity of a single cTn collection and allows for better negative predictive value [36]. Although it is interesting, these data are in need of confirmation in larger studies before routine use is appropriate.
In low risk patients, combining cTn and NT-proBNP (or per- haps BNP) in a “rule-out” biomarker based model may provide the opportunity to safely discharge these patients without the current standard of care, stress test, saving the individual pa- tient and healthcare system much aggravation and cost [38].
USE OF NT-proBNP AS A MARKER OF PROGNOSTICATION
NT-proBNP has shown promise as a valuable marker of adverse outcomes in patients presenting with MI [33, 36]. In a large 70,000 patients cohort presenting with MI, NT-proBNP was measured. Patient results were divided into quartiles, and there was a stepwise increase in in-hospital mortality from 1.3% in the lowest quartile to 11.2% in the highest quartile even after con- trolling for age, creatinine, heart failure, and shock [39]. A meta- analysis of 12 studies that included patients presenting to the hospital with NSTE ACS showed that risk of death was 4.89-fold greater in those patients with elevated NT-proBNP levels on ad- mission [33].
CONCLUSIONS
The cardiac biomarkers cTnT, cTnI, BNP, and NT-proBNP pro- vide important information for clinicians by assisting in the guid- ance of diagnostic, prognostic, and treatment decisions for pa- tients presenting urgently with signs and symptoms of MI. cTnT and cTnI have evolved through several assay revisions and cur- rently the sensitive and high sensitivity versions of these assays are the best available tests for clinical use in MI diagnosis.
These laboratory tests will become of increasing importance throughout the world and particularly in Southeast Asia with the changing demographics and healthcare landscape. The grow-
ing worldwide epidemic of obesity and diabetes mellitus will re- sult in more patients presenting to the emergency department with the diagnostic dilemma of MI versus other causes of their signs and symptoms. Rapid and accurate diagnosis, risk stratifi- cation, and management decisions will continue to be aided by biomarkers. They play an invaluable role in providing effective care while minimizing healthcare costs.
Authors’ Disclosures of Potential Conflicts of Interest
No potential conflicts of interest relevant to this article were re- ported.
REFERENCES
1. Lloyd-Jones D, Adams R, Carnethon M, De Simone G, Ferguson TB, Flegal K, et al. Heart disease and stroke statistics--2009 update: a report from the American Heart Association Statistics Committee and Stroke Statistics Subcommittee. Circulation 2009;119:480-6.
2. Morrow DA, Cannon CP, Jesse RL, Newby LK, Ravkilde J, Storrow AB, et al. National Academy of Clinical Biochemistry Laboratory Medicine Practice Guidelines: clinical characteristics and utilization of biochemi- cal markers in acute coronary syndromes. Circulation 2007;115:e356-75. 3. Thygesen K, Alpert JS, Jeffe AS, Simoons ML, Chaitman BR, White HD,
et al. Third universal definition of myocardial infarction. J Am Coll Cardi- ol 2012;60:1581-98.
4. Thygesen K, Alpert JS, White HD; Joint ESC/ACCF/AHA/WHF Task Force for the Redefinition og Myocardial Infarction. Universal definition of myocardial infarction. J Am Coll Cardiol 2007;50:2173-95.
5. Babuin L and Jaffe AS. Troponin: the biomarker of choice for the detec- tion of cardiac injury. CMAJ 2005;173:1191-202.
6. Farah CS and Reinach FC. The troponin complex and regulation of muscle contraction. FASEB J 1995;9:755-67.
7. Wu AH and Christenson RH. Analytical and assay issues for use of car- diac troponin testing for risk stratification in primary care. Clin Biochem 2013;46:969-78.
8. Luepker RV, Apple FS, Christenson RH, Crow RS, Fortmann SP, Goff D, et al. Case definitions for acute coronary heart disease in epidemiology and clinical research studies: a statement from the AHA Council on Epi- demiology and Prevention; AHA Statistics Committee; World Heart Fed- eration Council on Epidemiology and Prevention; the European Society of Cardiology Working Group on Epidemiology and Prevention; Centers for Disease Control and Prevention; and the National Heart, Lung, and Blood Institute. Circulation 2003;108:2543-9.
9. Wu AH and Lane PL. Metaanalysis in clinical chemistry: validation of cardiac troponin T as a marker for ischemic heart diseases. Clin Chem 1995;41:1228-33.
10. Heidenreich PA, Alloggiiamento T, Melsop K, McDonald KM, Go AS, Hlatky MA. The prognostic value of troponin in patients with non-ST el- evation acute coronary syndromes: a meta-analysis. J Am Coll Cardiol 2001;38:478-85.
11. Kelley WE, Januzzi JL, Christenson RH. Increases of cardiac troponin in conditions other than acute coronary syndrome and heart failure. Clin Chem 2009;55:2098-112.
12. Alpert JS, Thygesen K, Antman E, Bassand JP. Myocardial infarction re-
defined--a consensus document of The Joint European Society of Car- diology/American College of Cardiology Committee for the redefinition of myocardial infarction. J Am Coll Cardiol 2000;36:959-69.
13. Newby LK, Jesse RL, Babb JD, Christenson RH, De Fer TM, Diamond GA, et al. ACCF 2012 expert consensus document on practical clinical considerations in the interpretation of troponin elevations: a report of the American College of Cardiology Foundation task force on Clinical Expert Consensus Documents. J Am Coll Cardiol 2012;60:2427-63. 14. Nomenclature and criteria for diagnosis of ischemic heart disease. Re-
port of the Joint International Society and Federation of Cardiology/
World Health Organization task force on standardization of clinical no- menclature. Circulation 1979;59:607-9.
15. Cummins P and Perry SV. Troponin I from human skeletal and cardiac muscles. Biochem J 1978;171:251-9.
16. Wu AH, Apple FS, Gibler WB, Jesse RL, Warshaw MM, Valdes R Jr. Na- tional Academy of Clinical Biochemistry Standards of Laboratory Prac- tice: recommendations for the use of cardiac markers in coronary artery diseases. Clin Chem 1999;45:1104-21.
17. Panteghini M, Pagani F, Yeo KT, Apple FS, Christenson RH, Dati F, et al. Evaluation of imprecision for cardiac troponin assays at low-range concentrations. Clin Chem 2004;50:327-32.
18. Apple FS, Jesse RL, Newby LK, Wu AH, Christenson RH, Cannon CP, et al. National Academy of Clinical Biochemistry and IFCC Committee for Standardization of Markers of Cardiac Damage Laboratory Medicine Practice Guidelines: analytical issues for biochemical markers of acute coronary syndromes. Clin Chem 2007;53:547-51.
19. Apple FS, Collinson PO; IFCC Task Force on Clinical Applications of Cardiac Biomarkers. Analytical characteristics of high-sensitivity cardiac troponin assays. Clin Chem 2012;58:54-61.
20. Keller T, Münzel T, Blankenberg S. Making it more sensitive: the new era of troponin use. Circulation 2011;123:1361-3.
21. Melanson SE, Morrow DA, Jarolim P. Earlier detection of myocardial in- jury in a preliminary evaluation using a new troponin I assay with im- proved sensitivity. Am J Clin Pathol 2007;128:282-6.
22. Reichlin T, Hochholzer W, Bassetti S, Steuer S, Stelzig C, Hartwiger S, et al. Early diagnosis of myocardial infarction with sensitive cardiac tro- ponin assays. N Engl J Med 2009;361:858-67.
23. Jesse RL. On the relative value of an assay versus that of a test: a histo- ry of troponin for the diagnosis of myocardial infarction. J Am Coll Car- diol 2010;55:2125-8.
24. Mills NL, Churchhouse AM, Lee KK, Anand A, Gamble D, Shah AS, et al. Implementation of a sensitive troponin I assay and risk of recurrent myocardial infarction and death in patients with suspected acute coro- nary syndrome. JAMA 2011;305:1210-6.
25. Jeremias A and Gibson CM. Narrative review: alternative causes for ele- vated cardiac troponin levels when acute coronary syndromes are ex- cluded. Ann Intern Med 2005;142:786-91.
26. Wu AH. Interpretation of high sensitivity cardiac troponin I results: refer- ence to biological variability in patients who present to the emergency room with chest pain: case report series. Clin Chim Acta 2009;401:170-4.
27. Giannitsis E, Becker M, Kurz K, Hess G, Zdunek D, Katus HA. High- sensitivity cardiac troponin T for early prediction of evolving non-ST-seg- ment elevation myocardial infarction in patients with suspected acute coronary syndrome and negative troponin results on admission. Clin Chem 2010;56:642-50.
28. Casals G, Filella X, Augé JM, Bedini JL. Impact of ultrasensitive cardiac troponin I dynamic changes in the new universal definition of myocardi- al infarction. Am J Clin Pathol 2008;130:964-8.
29. Apple FS, Pearce LA, Smith SW, Kaczmarek JM, Murakami MM. Role of monitoring changes in sensitive cardiac troponin I assay results for early diagnosis of myocardial infarction and prediction of risk of adverse events. Clin Chem 2009;55:930-7.
30. Reichlin T, Irfan A, Twerenbold R, Reiter M, Hochholzer W, Burkhalter H, et al. Utility of absolute and relative changes in cardiac troponin con- centrations in the early diagnosis of acute myocardial infarction. Circu- lation 2011;124:136-45.
31. Reichlin T, Schindler C, Drexler B, Twerenbold R, Reiter M, Zellweger C, et al. One-hr rule-out and rule-in of acute myocardial infarction using high-sensitivity cardiac troponin T. Arch Intern Med 2012;172:1211-8. 32. Riezebos RK, Laarman GJ, Tijssen JG, Verheugt FW. The value of N-
terminal proB-type natriuretic peptide for early identification of myocar- dial infarction in patients with high-risk non-ST-elevation acute coronary syndromes. Clin Chem Lab Med 2011;49:1359-65.
33. Jernberg T, James S, Lindahl B, Johnston N, Stridsberg M, Venge P, et al. Natriuretic peptides in unstable coronary artery disease. Eur Heart J 2004;25:1486-93.
34. Ordonez-Llanos J, Collinson PO, Christenson RH. Amino-terminal pro- B-type natriuretic peptide: analytic considerations. Am J Cardiol 2008; 101:9-15.
35. Zeng X, Li L, Su Q. The prognostic value of N-terminal pro-brain natri- uretic peptide in non-ST elevation acute coronary syndromes: a meta- analysis. Clin Chem Lab Med 2012;50:731-9.
36. Truong QA, Bayley J, Hoffmann U, Bamberg F, Schlett CL, Nagurney JT, et al. Multi-marker strategy of natriuretic peptide with either conven- tional or high-sensitivity troponin-T for acute coronary syndrome diag- nosis in emergency department patients with chest pain: from the “Rule Out Myocardial Infarction using Computer Assisted Tomography”
(ROMICAT) trial. Am Heart J 2012;163:972-9.e1.
37. Melki D, Lind S, Agewall S, Jernberg T. Prognostic value of combining high sensitive troponin T and N-terminal pro B-type natriuretic peptide in chest pain patients with no persistent ST-elevation. Clin Chim Acta 2012;413:933-7.
38. Mathewkutty S, Sethi SS, Aneja A, Shah K, Iyengar RL, Hermann L, et al. Biomarkers after risk stratification in acute chest pain (from the BRIC Study). Am J Cardiol 2013;111:493-8.
39. Scirica BM, Kadakia MB, de Lemos JA, Roe MT, Morrow DA, Li S, et al.
Association between Natriuretic Peptides and Mortality among Patients Admitted with Myocardial Infarction: a Report from the ACTION Registry(R)-GWTGTM. Clin Chem 2013; doi:10.1373/clinchem.2012.198 556 [Epub ahead of print].