INTRODUCTION
Gliomas account for 29% and 81% of all primary and malignant cerebral tumors, respectively (1). Currently, structural magnetic resonance imaging (MRI) is the most commonly accepted diagnostic method for identifying gliomas. However, enhancement of low-grade gliomas (LGGs)
Combination of Magnetic Resonance Spectroscopy and
11 C-Methionine Positron Emission Tomography for the Accurate Diagnosis of Non-Enhancing Supratentorial Glioma
Nijiati Kudulaiti, MD
1*, Tianming Qiu, MD, PhD
1*, Junfeng Lu, MD, PhD
1, Huiwei Zhang, MD, PhD
2, Zhengwei Zhang, MD
2, Yihui Guan, MD, PhD
2, Dongxiao Zhuang, MD, PhD
1, Jinsong Wu, MD, PhD
11Department of Neurologic Surgery and 2PET Center, Huashan Hospital, Shanghai Medical College, Fudan University, Shanghai, China
Objective: To evaluate whether the combination of magnetic resonance spectroscopy (MRS) and
11C-methionine positron emission tomography (
11C-MET PET) could increase accurate diagnostic sensitivity for non-enhancing supratentorial gliomas.
Materials and Methods: Between February 2012 and December 2017, 109 patients with non-enhanced supratentorial lesions on contrast-enhanced MRI were enrolled. Each patient underwent MRS and
11C-MET PET before treatment. A lesion was considered to be a glioma when either the MRS or
11C-MET PET results reached the diagnostic threshold. The radiological diagnosis was compared with the pathological diagnosis or medical diagnostic criteria.
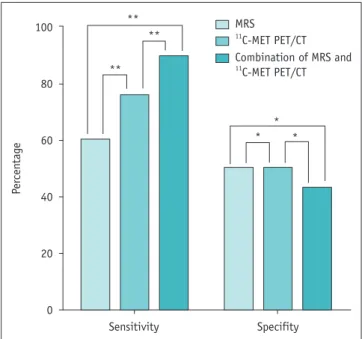
Results: The sensitivity and specificity were 60.0% and 50.0% for MRS and 75.8% and 50.0% for
11C-MET PET, respectively.
Upon combining the two modalities, the sensitivity and specificity of the imaging-based diagnosis prior to surgery reached 89.5% and 42.9%, respectively. Statistically significant differences in the sensitivities were observed between the combined and individual approaches (MRS alone, 89.5% vs. 60.0%, p < 0.001;
11C-MET PET alone, 89.5% vs. 75.8%, p = 0.001). However, no significant differences in specificity were observed between the combined and individual modalities.
Conclusion: The combination of MRS and
11C-MET PET findings significantly increases accurate diagnostic sensitivity for non- enhancing supratentorial gliomas without significantly lowering the specificity. This finding suggests the potential of the combined MRS and
11C-MET PET approach in clinical applications.
Keywords: Glioma; Magnetic resonance spectroscopy; Methionine; PET
Received October 5, 2018; accepted after revision January 28, 2019.
This study was supported by the National Natural Science Foundation of China (Nos.81672476 and 81701289), Shanghai Sailing Program (No.16YF1415400).
*These authors contributed equally to this work.
Corresponding author: Dongxiao Zhuang, MD, PhD, Department of Neurologic Surgery, Huashan Hospital, Shanghai Medical College, Fudan University, 12# Wulumuqi Zhong Rd., Shanghai 200040, China.
• Tel: (8621) 5288 8771 • Fax: (8621) 5288 8771 • E-mail: [email protected]
This is an Open Access article distributed under the terms of the Creative Commons Attribution Non-Commercial License (https://
creativecommons.org/licenses/by-nc/4.0) which permits unrestricted non-commercial use, distribution, and reproduction in any medium, provided the original work is properly cited.
and certain high-grade gliomas (HGGs) is sometimes not observed on post-contrast T1-weighted imaging (T1WI).
This lack of enhancement occurs despite the use of contrast and additional MRI sequences, such as diffusion-weighted imaging, T2-weighted fluid-attenuated inversion recovery (FLAIR), and perfusion-weighted imaging, which may lead to potential difficulties in differentiating non-enhancing
Korean J Radiol 2019;20(6):967-975https://doi.org/10.3348/kjr.2018.0690
gliomas from non-tumor lesions arising from gliosis, encephalomalacia, demyelination, or inflammation (2).
To overcome these structural MRI deficiencies, metabolic imaging techniques have been used as supplementary approaches to obtain information on tissue biological processes and diagnose gliomas. Positron emission tomography (PET) and magnetic resonance spectroscopy (MRS) are metabolic imaging techniques with potential applications in cerebral tumor imaging (3). These
techniques can be used to acquire information about tumor- related physiological processes, metabolic pathways, and molecular events.
MRS provides important metabolic information on N-acetylaspartate (NAA), choline (Cho), and creatine levels, which are useful for characterizing gliomas and surrounding normal brain tissue (4-6). A previous study reported that, at a maximum Cho/NAA index (CNI
max) threshold of 2.0, tumor infiltration in HGGs and LGGs could be predicted with probabilities of 90% and 87%, respectively (7). However, when gliomas invade ventricular systems, blood vessels, scalp fat, and skull lipids can affect MRS image quality, which makes the CNI
maxunreliable for preoperative diagnosis.
In addition to MRS, various biological processes in gliomas can be noninvasively imaged using PET. Of the numerous radiotracers synthetized to distinguish between brain tumors,
11C-methionine (
11C-MET) is highly useful (3, 8, 9).
11C-MET PET has relatively low background activity in normal brain tissue, which allows it to differentiate between gliomas and non-tumor lesions with high specificity and sensitivity (10). Although the sensitivity of
11C-MET PET ranges between 76–100% according to different studies, its sensitivity is comparatively lower when there is a higher percentage of non-enhancing LGGs (10).
11
C-MET PET can still be reliable in areas of reduced MRS image quality, whereas MRS results can be referred to when gliomas are hypometabolic on
11C-MET PET. Considering the advantages and limitations of
11C-MET PET and MRS, we sought to assess whether a combination of these imaging techniques could facilitate accurate diagnosis of non- enhancing supratentorial gliomas.
MATERIALS AND METHODS
Study Population
This retrospective study included patients with non- enhancing supratentorial lesions on contrast-enhanced MRI admitted between February 2012 and December
2017. Patients who had previously undergone surgery, chemotherapy, or radiotherapy were excluded. One hundred and nine patients with non-enhanced supratentorial lesions visible on contrast-enhanced MRI were enrolled in this study. MRS and
11C-MET PET were performed for each patient. Treatment was started within a month of the latest imaging-based diagnosis. Histological diagnosis was based on biopsy or resection, depending on availability.
For neurological diseases, diagnoses were made according to medical criteria by two blinded neurologists. The study was approved by the Institutional Review Board of Huashan Hospital, and informed consent was obtained from all study participants.
MRI
An 8-channel head coil 3T iMRI suite (Siemens Healthineers, Erlangen, Germany) was used to perform MRI. For imaging-based diagnosis, T1WI and T2-weighted imaging (T2WI) were obtained for each patient before performing MRS.
The conventional MRI protocol consisted of a sagittal T1 FLAIR sequence (repetition time [TR]/echo time [TE]/
inversion time [TI], 2000/9/860 ms), an axial T2-weighted turbo spin-echo sequence (TR/TE, 6000–7540/95–98 ms), axial T1 FLAIR sequence (TR/TE/TI, 2000/9/860 ms), axial T2 FLAIR sequence (TR/TE/TI, 8500/94/2440 ms), and axial T1-weighted contrast-enhanced gradient-echo sequence (TR/TE, 2000/9 ms). To obtain MRI data for navigation purposes, a three-dimensional (3D) anatomic magnetization-prepared rapid-acquisition gradient-echo sequence (TR/TE/TI, 1900/2.94/900 ms; field of view [FOV], 250 x 250 mm; 1-mm isotropic resolution; 176 slices) or turbo spin-echo sequence (TR/TE, 3200/332 ms;
FOV, 250 x 250 mm; slice thickness, 2.0 mm; 64 slices) was performed.
MRS Imaging
The MRS parameter settings used in this study have
been previously published (7). A multivoxel point-resolved
spectroscopic sequence (TR/TE, 1700/135 ms; 15-mm
section thickness; FOV, 120 x 120 mm; phase encoding,
16 x 16) was used. To achieve water suppression, three
chemical shift-selective pulses were used. On T2WI, the
size of the chemical shift imaging slice was larger than the
largest diameter of the lesion. The region of interest (ROI)
was placed on the abnormal signal region on T2WI. Areas
of skull lipid and scalp fat were carefully avoided because
they could have compromised imaging quality. After image acquisition, the raw data were exported to a post- processing workstation.
MRS Data Processing
A Siemens Syngo workstation (syngo MultiModality Workplace, Siemens Healthineers) was used for
reconstructing and analyzing the raw spectral data. The spatial distribution of the metabolite was generated by fitting a curve to the peak area. Within each volume of interest, Cho and NAA were estimated and expressed as integral ratios. The Cho/NAA index (CNI) was calculated for each voxel. A rainbow-colored look-up table comprising the CNIs was created utilizing an overlaid grid, which suggested the anatomical position of the CNIs. The MRS results were considered positive when CNI
maxwas ≥ 2.0 and negative when CNI
maxwas < 2.0.
11
C-MET PET Imaging
Each patient underwent
11C-MET PET using a 3D PET scanner (Biograph 64, Siemens Healthineers). Data acquisition began 15 minutes after an intravenous bolus injection of 10 mCi
11C-MET at the PET Center of Huashan Hospital. Fasting was not required for
11C-MET PET because no collateral effects have been reported. Before
11C-MET PET scanning, computed tomography (CT) was performed for attenuation correction and image fusion. A 3D acquisition mode was used to acquire
11C-MET PET images during a 15-minute static scan. The spatial resolution of the CT scanner in the axial and tangential directions was 1.5 mm. By applying manufacturer workstation and post-reconstruction 3D gaussian filter smoothing, image reconstructions were achieved with filtered back projection at a maximum full width of 3.5 mm.
11
C-MET PET Data Processing
The tumor to normal tissue (T/N) ratio was chosen for semi-quantitative analysis. First, 3D spherical ROIs covering the entire lesion were drawn, and the maximum standardized uptake (SUV
max) value inside the ROI was measured. For the T/N ratio, a circular ROI (7-mm diameter) was placed on the most intense lesion area and centered on the pixel with the SUV
max. Another ROI was positioned on an unaffected corresponding contralateral region. If the lesion had affected the contralateral region, the ROI was placed on an intact region of the contralateral hemisphere (11).
The mean radiotracer uptake in the lesion ROI divided by
the reference ROI value was defined as the T/N ratio. The
11
C-MET PET results were considered positive when the T/N ratio was ≥ 1.3 and negative when the T/N ratio was < 1.3.
Final Diagnosis
For histopathological evaluation, samples were obtained by biopsy or resection based on the treatment strategy.
When the lesion was resectable, maximally safe lesion resection was conducted with navigation guidance.
Otherwise, needle biopsy was performed according to the
11
C-MET PET and MRS results. The samples were fixed in 10% formalin and embedded in paraffin. Hematoxylin-eosin stained sections of all of the samples were reviewed by two blinded neuropathologists and categorized according to the 2016 World Health Organization Classification of Tumors of the Central Nervous System. When surgical findings were unavailable, two blinded neurologists made a definite diagnosis according to clinical evidence-based medical diagnostic criteria.
Statistical Analysis
For MRS images, a CNI
maxthreshold of 2.0 was set as the cut-off value for distinguishing between gliomas and non- tumor tissues as previously reported (7). Meanwhile, a T/N ratio of 1.3 was applied as the cut-off threshold for
11C-MET PET images (11). These thresholds were used to calculate the sensitivity and specificity. A lesion was considered a glioma when
11C-MET PET or MRS results were positive, and a lesion was classified as non-tumor tissue when
11C-MET PET or MRS results were negative. Following this, the imaging-based diagnostic results were compared with the final diagnosis to determine their diagnostic capability.
McNemar’s test was performed to compare the sensitivity and specificity of the combination of
11C-MET PET and MRS as well as those of the individual techniques. A p value of <
0.05 was considered statistically significant. SPSS software (version 21, IBM Corp., Armonk, NY, USA) was used to analyze the data.
RESULTS
Patients
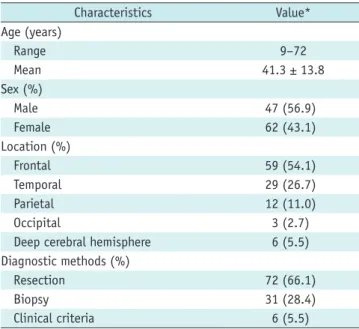
Patient characteristics and clinical data are summarized in Table 1. Of 109 patients, 72 and 31 had resection- and needle biopsy-based histological diagnoses, respectively.
The remaining six patients were diagnosed by two blinded
neurologists according to clinical evidence-based medical
diagnostic criteria. These patients were diagnosed with inflammation (n = 2), autoimmune encephalopathy (n = 1), cerebral vasculitis (n = 1), demyelination (n = 1), and epilepsy (n = 1). In the patient with epilepsy, there was abnormal signal in the limbic system on MRI; however, there was no progression during the 3-year follow-up period, leading to the diagnosis of a benign lesion. Patient
pathological findings are summarized in Table 2.
Diagnostic Capability
The sensitivity, specificity, and diagnostic accuracy for glioma diagnosis were calculated for MRS images with a CNI
maxthreshold of 2.0. For
11C-MET PET images and the combined techniques, the sensitivity, specificity, and diagnostic accuracy for glioma diagnosis were calculated with a T/N ratio threshold of 1.3. The diagnostic capabilities are summarized in Table 3.
The combination of the MRS and
11C-MET PET techniques substantially increased the sensitivity of the radiological diagnosis for non-enhancing supratentorial gliomas. The difference between the combined approach and MRS alone was obvious. Compared with the sensitivity of MRS alone, the sensitivity of the combined approach was 29.5% higher, resulting in a significant difference (89.5% vs. 60.0%, p <
0.001). Statistically significant differences in sensitivities were also observed between the combined techniques and
11
C-MET PET alone (89.5% vs. 75.8%, p = 0.001). However, no statistically significant differences in specificities were noted between the combined and individual approaches (MRS alone, 42.9% vs. 50.0%, p = 1.000;
11C-MET PET alone, 42.9% vs. 50.0%, p = 1.00). Upon comparing
11C-MET PET and MRS,
11C-MET PET showed better sensitivity (p = 0.029), but equal specificity (p = 0.480) (Fig. 1).
The false negative cases for MRS alone were as
Table 1. Patients’ Characteristics and Clinical DataCharacteristics Value*
Age (years)
Range 9–72
Mean 41.3 ± 13.8
Sex (%)
Male 47 (56.9)
Female 62 (43.1)
Location (%)
Frontal 59 (54.1)
Temporal 29 (26.7)
Parietal 12 (11.0)
Occipital 3 (2.7)
Deep cerebral hemisphere 6 (5.5)
Diagnostic methods (%)
Resection 72 (66.1)
Biopsy 31 (28.4)
Clinical criteria 6 (5.5)
*Values are shown as numbers of patients unless otherwise indicated.
Table 2. Pathological Findings of Patients
Diagnosis Value (%) Diagnosis Value (%)
Astrocytoma 42 (38.5) Gliosis 4 (3.7)
Oligodendroglioma 18 (16.5) Inflammation 3 (2.8)
Anaplastic astrocytoma 18 (16.5) Demyelination 2 (1.8)
Anaplastic oligodendroglioma 4 (3.7) Focal cortical dysplasia 1 (0.9)
Oligoastrocytoma, NOS 4 (3.7) Granuloma 1 (0.9)
Glioblastoma 3 (2.8) Cerebral vasculitis 1 (0.9)
Pilocytic astrocytoma 2 (1.8) Epilepsy 1 (0.9)
Dysembryoplastic neuroepithelial tumor 2 (1.8) Autoimmune encephalopathy 1 (0.9)
CNS embryonal tumor 1 (0.9)
CD34-positive neuroepithelial tumor 1 (0.9) CNS = central nervous system, NOS = not otherwise specified
Table 3. Diagnostic Capabilities
Sensitivity Specificity Accuracy
MRS 60.0% (57/95) (50.1–69.9%) 50.0% (7/14) (23.8–73.8%) 58.7% (64/109) (52.5–67.9%)
11C-MET PET 75.8% (72/95) (67.2–84.4%) 50.0% (7/14) (23.8–73.8%) 72.5% (79/109) (64.1–80.9%) Combination of MRS and 11C-MET PET 89.5% (85/95) (83.3–95.7%) 42.9% (6/14) (17.0–68.8%) 83.5% (91/109) (79.9–87.1%) Values are shown as mean with 95% confidence interval. MRS = magnetic resonance spectroscopy, 11C-MET PET = 11C-methionine positron emission tomography
follows: Twenty astrocytomas, seven oligodendrogliomas, six anaplastic astrocytomas, two dysembryoplastic neuroepithelial tumors, one oligoastrocytoma, one CD34- positive neuroepithelial tumor, and one anaplastic oligodendroglioma. The false negative cases for
11C-MET PET alone were as follows: Twelve astrocytomas, three oligodendrogliomas, three anaplastic astrocytomas, two dysembryoplastic neuroepithelial tumors, one oligoastrocytoma, and one anaplastic oligodendroglioma.
The false positive cases for the combination of MRS and
11
C-MET PET were as follows: Three gliosis, one focal cortical dysplasia, one granuloma, one demyelination, one inflammation, and one autoimmune encephalopathy.
The false negative cases for the individual and combined approaches were as follows: Five astrocytomas, two oligodendrogliomas, two dysembryoplastic neuroepithelial tumors, and one oligoastrocytoma.
Effect on Clinical Management
A cross table of the
11C-MET PET and MRS results are presented in Table 4. Of the recruited patients, 45 had a normal CNI
max; however, 29 (64.4%; 29/45) patients were reconsidered for surgery because positive
11C-MET PET uptake (i.e., T/N ratio ≥ 1.3) was detected. The treatment of these patients could have been delayed if the results had been based on MRS alone (Fig. 2).
Conversely, of the 30 patients who were misdiagnosed earlier due to reliance on
11C-MET PET scans alone, 14 (46.7%; 14/30) benefited from the supplementary evidence provided by MRS (Fig. 3).
DISCUSSION
11
C-MET is a sensitive radiotracer for glioma detection because it can distinguish between gliomas and non- neoplastic pathologies with high sensitivity and specificity.
Such differentiation is possible because of the relatively low background activity of
11C-MET in normal brain tissue.
As a result,
11C-MET has been applied to the diagnosis and prognosis of gliomas (12, 13), differentiation of glioma recurrence from radiation injury (14, 15), and surgical (11, 16) and radiotherapy planning (17, 18).
Previous research has established that
11C-MET PET is more accurate for glioma diagnosis than CT (19), and other studies have suggested that
11C-MET PET is superior to MRI and
18F-fluorodeoxyglucose PET (12, 20). Ribom et al. (13) reported increased
11C-MET uptake in 30/32 (94%) LGGs, whereas only 12/32 (38%) showed increased
11C-MET uptake with contrast enhancement. In our study, increased
11C-MET uptake was detected in 94/109 (86.2%) gliomas.
11C-MET PET accuracy for the differential diagnosis of gliomas has been shown in several studies. In LGGs and HGGs, the overall sensitivity of
11C-MET PET ranged from 76% to 100%
(10). In most studies, the T/N ratio was routinely used for calculating the sensitivity and specificity. The cut-off value was typically set as 1.3, and the sensitivity and specificity of
11C-MET PET for glioma diagnosis were 87% and 89%, respectively (11). Applying the same T/N ratio cut-off value in this study, the
11C-MET PET sensitivity reached 75.8%. This finding might be explained by the sensitivity being reduced with the inclusion of a higher proportion of gliomas (10). Moreover, clinicians are more concerned with overall
11C-MET PET accuracy in practice. Our results had an accuracy of 72.5%, whereas Herholz et al. (8) reported an overall
11C-MET PET accuracy of 79% for a large-scale study
100
80
60
40
20
0
Percentage
**
**
*
* *
**
11C-MET PET/CT Combination of MRS and
11C-MET PET/CT MRS
Sensitivity Specifity
Fig. 1. Sensitivities and specificities of MRS, 11C-MET PET, and MRS and 11C-MET PET combined. There are significant differences in sensitivities (p < 0.05), but not specificities (p > 0.05) between three groups. *p > 0.05, **p < 0.05. MRS = magnetic resonance spectroscopy, 11C-MET PET = 11C-methionine positron emission tomography
Table 4. Cross Table of 11C-MET PET and MRS Results
Tumor Non-Tumor
11C-MET PET 11C-MET PET Positive Negative Positive Negative MRS
Positive 44 13 6 1
Negative 28 10 1 6
of 196 patients.
Although
11C-MET PET can provide additional diagnostic information, in clinical practice, it is not the first choice for glioma differentiation due to its use of radioisotopes, cost, and long acquisition times. Conversely, MRS can be obtained during routine MRI and is, thus, cheaper and more convenient. This technique has been widely used to acquire additional diagnostic information and reflects the histological features of gliomas. In LGGs with hypometabolic
11
C-MET uptake, MRS is better than
11C-MET PET at detecting the metabolic features of gliomas. Therefore, MRS is a valuable tool for tumor differentiation, grading, and biopsy and radiotherapy planning (4, 21-23). Previous research on the relationship between glioma metabolism and the CNI has revealed that CNI thresholds of 2.0, 1.5, 1.0, and 0.5 appeared to predict tumor-containing samples with
probabilities of 90%, 79%, 60%, and 38% for HGGs and 87%, 67%, 39%, and 16% for LGGs, respectively (7).
In our study, the CNI
maxwas > 2.0 in 79/109 patients;
however, MRS indicated a diagnostic sensitivity of only 60.0%. This finding could be attributed to the limitations of MRS. First, the results depended on sequence settings.
Thus, parameter optimization is crucial for securing reliable results. Second, MRS requires full patient cooperation because patient movement affects the signal-to-noise ratio and leads to an unstable baseline. Moreover, tumor heterogeneity may result in a false-negative result. Finally, the image quality will be affected when gliomas occupy or are near ventricular systems, skull lipids, or scalp fat. Thus, for lesions located in these areas,
11C-MET PET could yield a better diagnosis than that of MRS.
Considering the imaging characteristics of
11C-MET
AD
B
E
C
F Fig. 2. Representative case of anaplastic oligodendroglioma in 53-year-old man.
A. T1-weighted MRI showing low-intensity lesion in right temporal lobe. B. T2-weighted MRI showing hyperintense lesion in right temporal lobe.
C. FLAIR MRI outlining margin of lesion. D. Non-enhanced lesion on post-contrast T1-weighted MRI acquired after Gd-DTPA injection. E. MRS result showing CNImax of 1.65. F. 11C-MET PET showing strong MET uptake in lesion (SUVmax, 5.4; T/N ratio, 3.3). Surgery was performed based on combined MRS and 11C-MET PET findings, and diagnosis was confirmed as anaplastic oligodendroglioma (WHO III). White square (□) shows ROI for CNImax, and white circle (○) shows ROI for calculating T/N ratio. Cho = choline, CNImax = maximum Cho/NAA index, FLAIR = fluid-attenuated inversion recovery, Gd-DTPA = gadolinium-diethylenetriamine pentaacetic acid, MET = methionine, NAA = N-acetylaspartate, ROI = region of interest, SUVmax = maximum standardized uptake, T/N = tumor to normal tissue, WHO = World Health Organization
PET and MRS, we evaluated whether the combination of these techniques could overcome their individual deficiencies and lead to higher diagnostic accuracy for non-enhancing supratentorial glioma. In our study, the sensitivity differences between the combined approach and MRS or
11C-MET PET alone were significant. Compared with MRS,
11C-MET PET had enhanced sensitivity and equal specificity, which suggested its superiority to MRS.
However,
11C-MET PET is radioactive, expensive, and poses practical difficulties. Thus, because MRS is more convenient, inexpensive, and non-radioactive, it may be an ideal first choice when non-enhancing glioma is highly suspected.
If the CNI
maxis < 2.0 on MRS, then
11C-MET PET is highly recommended because it greatly reduces the rate of missed diagnoses. As a result, a combination of MRS and
11C-MET PET can substantially increase radiological diagnostic sensitivity for non-enhancing supratentorial gliomas without greatly reducing specificity.
However, the combination of MRS and
11C-MET PET may increase the number of false positives. An increased CNI
maxhas been observed in other intracranial tumors, such as lymphoma (24), and some non-tumor lesions caused by encephalitis, demyelination, or vasculitis (25, 26).
Demyelination, cerebral infarction, hematomas, or acute or subacute cerebral ischemia elevate
11C-MET uptake (8, 11). In our study, the false positives associated with the combination of MRS and
11C-MET PET included gliosis, focal cortical dysplasia granuloma, inflammation, granuloma, and demyelination. However, there was no significant difference in the number of false positives between the combined and individual approaches.
The combination of MRS and
11C-MET PET led clinicians to seek further histological or clinical diagnosis rather than resort to the wait-and-watch strategy. Although the wait-and-watch strategy has led to better quality of life scores in patients with suspected LGG (27), early surgical
AD
B
E
C
F Fig. 3. Representative case of astrocytoma in 33-year-old woman.
A. T1-weighted MRI showing low-intensity lesion in right frontal lobe. B. T2-weighted MRI showing hyperintense lesion in right frontal lobe. C.
FLAIR MRI outlining margin of lesion. D. Non-enhanced lesion on post-contrast T1-weighted MRI acquired after Gd-DTPA injection. E. MRS result indicating glioma (CNImax, 3.04). F. 11C-MET PET showing no visible accumulation in lesion (SUVmax, 2.1; T/N ratio, 0.9). Surgery was performed based on combined MRS and 11C-MET PET findings, and diagnosis of astrocytoma was confirmed (WHO II). White square (□) shows ROI for CNImax, and white circle (○) shows ROI for calculating T/N ratio.
intervention has been associated with a longer overall survival time compared with this strategy (28). Afra et al.
(29) found that the overall survival of patients with LGG was adversely impacted by seizure history duration prior to surgery and, therefore, recommended surgical intervention in patients with seizures and imaging results indicative of LGG. Several studies have reported that asymptomatic LGGs were safer to resect than symptomatic LGGs. Moreover, asymptomatic LGGs were associated with better overall survival. These findings suggest the potential benefits of performing surgery before lesions become symptomatic (30, 31). The early interventions described were based on sensitive auxiliary imaging methods used to avoid misdiagnosis, which supports the combination of MRS and
11
C-MET PET as a more practical approach in clinical contexts.
Our study has some limitations. First, there is currently no consensus in the literature concerning the pathological CNI
maxand
11C-MET PET cut-off values. The use of different cut-off values may lead to divergent results. Therefore, a reliable cut-off value is needed. Moreover, our study was retrospective and based on a relatively small patient sample. Therefore, to validate our findings, a prospective study with greater patient recruitment and a longer follow- up period is needed.
In conclusion, the combination of MRS and
11C-MET PET can considerably improve accurate diagnostic sensitivity for non-enhancing supratentorial gliomas without significantly lowering specificity. This finding suggests that this combined approach should be highly reliable for clinical applications.
Conflicts of Interest
The authors have no potential conflicts of interest to disclose.
ORCID iDs Dongxiao Zhuang
https://orcid.org/0000-0002-4964-6529 Nijiati Kudulaiti
https://orcid.org/0000-0002-8771-0288
REFERENCES
1. Ostrom QT, Gittleman H, Liao P, Rouse C, Chen Y, Dowling J, et al. CBTRUS statistical report: primary brain and central nervous system tumors diagnosed in the United States in 2007-2011. Neuro Oncol 2014;16 Suppl 4:iv1-63
2. Kondziolka D, Lunsford LD, Martinez AJ. Unreliability of contemporary neurodiagnostic imaging in evaluating suspected adult supratentorial (low-grade) astrocytoma. J Neurosurg 1993;79:533-536
3. Fouke SJ, Benzinger T, Gibson D, Ryken TC, Kalkanis SN, Olson JJ. The role of imaging in the management of adults with diffuse low grade glioma: a systematic review and evidence- based clinical practice guideline. J Neurooncol 2015;125:457- 479
4. Wang W, Hu Y, Lu P, Li Y, Chen Y, Tian M, et al. Evaluation of the diagnostic performance of magnetic resonance spectroscopy in brain tumors: a systematic review and meta- analysis. PloS One 2014;9:e112577
5. Martinez-Bisbal MC, Celda B. Proton magnetic resonance spectroscopy imaging in the study of human brain cancer. Q J Nucl Med Mol Imaging 2009;53:618-630
6. Ha DH, Choi S, Oh JY, Yoon SK, Kang MJ, Kim KU. Application of 31P MR spectroscopy to the brain tumors. Korean J Radiol 2013;14:477-486
7. Guo J, Yao C, Chen H, Zhuang D, Tang W, Ren G, et al. The relationship between Cho/NAA and glioma metabolism:
implementation for margin delineation of cerebral gliomas.
Acta Neurochir (Wien) 2012;154:1361-1370; discussion 1370 8. Herholz K, Hölzer T, Bauer B, Schröder R, Voges J, Ernestus
RI, et al. 11C-methionine pet for differential diagnosis of low-grade gliomas. Neurology 1998;50:1316-1322 9. Demetriades AK, Almeida AC, Bhangoo RS, Barrington SF.
Applications of positron emission tomography in neuro- oncology: a clinical approach. Surgeon 2014;12:148-157 10. Glaudemans AW, Enting RH, Heesters MA, Dierckx RA, van
Rheenen RW, Walenkamp AM, et al. Value of 11C-methionine PET in imaging brain tumours and metastases. Eur J Nucl Med Mol Imaging 2013;40:615-635
11. Kracht LW, Miletic H, Busch S, Jacobs AH, Voges J, Hoevels M, et al. Delineation of brain tumor extent with [11C]L-methionine positron emission tomography: local comparison with stereotactic histopathology. Clin Cancer Res 2004;10:7163-7170
12. Kato T, Shinoda J, Nakayama N, Miwa K, Okumura A, Yano H, et al. Metabolic assessment of gliomas using 11C-methionine, [18F] fluorodeoxyglucose, and 11C-choline positron-emission tomography. AJNR Am J Neuroradiol 2008;29:1176-1182 13. Ribom D, Eriksson A, Hartman M, Engler H, Nilsson A,
Långström B, et al. Positron emission tomography (11) C-methionine and survival in patients with low-grade gliomas.
Cancer 2001;92:1541-1549
14. Tsuyuguchi N, Sunada I, Iwai Y, Yamanaka K, Tanaka K, Takami T, et al. Methionine positron emission tomography of recurrent metastatic brain tumor and radiation necrosis after stereotactic radiosurgery: is a differential diagnosis possible?
J Neurosurg 2003;98:1056-1064
15. Shishido H, Kawai N, Miyake K, Yamamoto Y, Nishiyama Y, Tamiya T. Diagnostic value of 11C-methionine (MET) and 18F-fluorothymidine (FLT) positron emission tomography in
recurrent high-grade gliomas; differentiation from treatment- induced tissue necrosis. Cancers (Basel) 2012;4:244-256 16. Pirotte B, Goldman S, Dewitte O, Massager N, Wikler D,
Lefranc F, et al. Integrated positron emission tomography and magnetic resonance imaging-guided resection of brain tumors: a report of 103 consecutive procedures. J Neurosurg 2006;104:238-253
17. Matsuo M, Miwa K, Tanaka O, Shinoda J, Nishibori H, Tsuge Y, et al. Impact of [11C]methionine positron emission tomography for target definition of glioblastoma multiforme in radiation therapy planning. Int J Radiat Oncol Biol Phys 2012;82:83-89
18. Grosu AL, Weber WA, Riedel E, Jeremic B, Nieder C, Franz M, et al. L-(methyl-11C) methionine positron emission tomography for target delineation in resected high-grade gliomas before radiotherapy. Int J Radiat Oncol Biol Phys 2005;63:64-74 19. Mosskin M, Bergström M, Collins VP, Ehrin E, Eriksson
L, von Holst H, et al. Positron emission tomography with 11C-methionine of intracranial tumours compared with histology of multiple biopsies. Acta Radiol Suppl 1986;369:157-160
20. Kaschten B, Stevenaert A, Sadzot B, Deprez M, Degueldre C, Del Fiore G, et al. Preoperative evaluation of 54 gliomas by PET with fluorine-18-fluorodeoxyglucose and/or carbon-11- methionine. J Nucl Med 1998;39:778-785
21. Bulik M, Jancalek R, Vanicek J, Skoch A, Mechl M. Potential of MR spectroscopy for assessment of glioma grading. Clin Neurol Neurosurg 2013;115:146-153
22. Narayana A, Chang J, Thakur S, Huang W, Karimi S, Hou B, et al. Use of MR spectroscopy and functional imaging in the treatment planning of gliomas. Br J Radiol 2007;80:347-354 23. Law M, Yang S, Wang H, Babb JS, Johnson G, Cha S, et
al. Glioma grading: sensitivity, specificity, and predictive
values of perfusion MR imaging and proton MR spectroscopic imaging compared with conventional MR imaging. AJNR Am J Neuroradiol 2003;24:1989-1998
24. Yamasaki F, Takayasu T, Nosaka R, Amatya VJ, Doskaliyev A, Akiyama Y, et al. Magnetic resonance spectroscopy detection of high lipid levels in intraaxial tumors without central necrosis: a characteristic of malignant lymphoma. J Neurosurg 2015;122:1370-1379
25. Oz G, Alger JR, Barker PB, Bartha R, Bizzi A, Boesch C, et al.
Clinical proton MR spectroscopy in central nervous system disorders. Radiology 2014;270:658-679
26. Baysal T, Ozisik HI, Karlidag R, Sarac K, Baysal O, Dusak A, et al. Proton MRS in Behcet’s disease with and without neurological findings. Neuroradiology 2003;45:860-864 27. Reijneveld JC, Sitskoorn MM, Klein M, Nuyen J, Taphoorn MJ.
Cognitive status and quality of life in patients with suspected versus proven low-grade gliomas. Neurology 2001;56:618-623 28. Jakola AS, Myrmel KS, Kloster R, Torp SH, Lindal S, Unsgård
G, et al. Comparison of a strategy favoring early surgical resection vs a strategy favoring watchful waiting in low-grade gliomas. JAMA 2012;308:1881-1888
29. Afra D, Osztie E, Sipos L, Vitanovics D. Preoperative history and postoperative survival of supratentorial low-grade astrocytomas. Br J Neurosurg 1999;13:299-305
30. Potts MB, Smith JS, Molinaro AM, Berger MS. Natural history and surgical management of incidentally discovered low-grade gliomas. J Neurosurg 2012;116:365-372
31. Aghi MK, Nahed BV, Sloan AE, Ryken TC, Kalkanis SN, Olson JJ. The role of surgery in the management of patients with diffuse low grade glioma: a systematic review and evidence- based clinical practice guideline. J Neurooncol 2015;125:503- 530