The Classification of Music Styles on the Basis of Spectral Contrast Features
1)Yan-bing Wang*
Abstract
In this paper, we propose that the contrast features of octave spectrum can be used to show spectral contrast features of some music clips. It shows the relative spectral distribution rather than average spectrum. From the experiment, it can be seen the method of spectral contrast features has a good performance in classification of music styles. Another comparative experiment shows that the method of spectral contrast features can better distinguish different music styles than the method of MFCC features that commonly used previously in the classification system of music styles.
▸Keyword : Spectral Contrast; Classification of Music; music styles
I. The Introduction of Background
Music is very popular in modern life and the number of math music growth quickly, thus, how to manage such a large digital musical libraries become an urgent problem.
The classification of automatic music style is an effective way of digital music library management. Although the concept of the type of music is not very clear, but music usually can be divided into two main categories: classical music and pop music. Classical music, relative to pop music, means that contains a variety of “serious” music, and pop music means popular music.[1] For each main types of music, it also can be made a further classification according to different stages or the different music style.[2][3] In the musical classification system, classical music can be further subdivided into Baroque music and romantic music style; they correspond to the Baroque era and the romantic era of western music. Pop music can be further subdivided into three types, including pop, jazz, and rock. Therefore, music can be divided into five categories in the musical system.
There are a lot of music features can be used to distinguish different types of music, such as the structure of music, rhythm, melody, tone, chords, etc, however, As for digital music, it is very difficult to extract these features accurately by using the method of signal processing.[4] As a result, many previous studies turn into spectrum features, because it is easy to be extracted and can be distinguished with same musical types: as for the average amplitude of Fu Liye transformation coefficient, scientists B. Matityaho uses multilayer neural network system to distinguish classical music and pop music; scientists K.P.H uses the latest average classifier and the characteristics of simple frequency spectrum to distinguish classical music and pop music; scientists H.
Soltau realizes musical classification system of rock, pop music, electronic music and classical music from the sequence of cepstral coefficients to extract the structure of beat by using the method of HMM and E1M-NN;
scientists D.P ye applies (GMM) and MFCC to make his system to achieve the best musical classification, including six types and blue tone, relaxed and pleasant music, classical music, opera, dance, film and rock.
∙First Author: Yanbing Wang, Corresponding Author: Yanbing Wang
*Yanbing Wang ([email protected]), Dept. of Applied Arts, Kyung Hee University, Korea
∙Received: 2016. 12. 15, Revised: 2016. 12. 26, Accepted: 2017. 01. 06.
∙This work was supported by National Research Foundation Grant funded by the China Government.
(SKL-2015-1599).
However, when different models are to be improved so as to improve recognition system of music, most of these jobs can be done by using the average spectral (e.g.
MFCC) to show spectrum characteristics of music. This characteristic makes sub-band spectrum average and reflects the average spectrum features, but, it can’t show relative characteristics of each sub-band frequency spectrum, it is more important when it comes to the difference of different types of music.[5][6]
This paper proposed the contrast features of octave spectrum to show relative characteristics of musical spectrum. Based on the contrast features of octave spectrum, the strength of peak and valley values of spectrum of each sub-band is considered respectively so that it can perform relative characteristics of spectrum, and then it can roughly reflect the distribution of harmonic part and non harmonic part. The experimental results showed that the method of contrast features of octave spectrum has an advantage over the method of features of MFCC in aspect of distinguishing the types of music.
This paper is organized as follows: the second part is the detailed discussion of the representation based on the contrast features of octave spectrum; the third part describes details of classification scheme; finally, the fourth part makes an evaluation about the proposed features through experiments.
II. The notation about the Contrast Features of Octave Spectrum
The strength of peak and valley value and its differences of spectrum of each sub-band are considered respectively based on the contrast features of octave spectrum. For most of the music, the strong spectral peak is almost consistent with the harmonic part, however, the non harmonic part or the noise often appears in the valley value of spectrum. Therefore, spectral contrast features can roughly reflect the corresponding distribution of harmonic part and morning harmonic part in the spectrum.
The features that used previously, such as MFCC, makes the distribution of spectrum of each sub-band average, thus losing the relative spectral information.
Considering the two spectrums have different spectrum
distribution and may have the similar average spectral characteristics, the average distribution of spectrum can’t fully show the spectrum characteristics of music.
However, spectrum contrast can keep more information and can better distinguish different kinds of music.
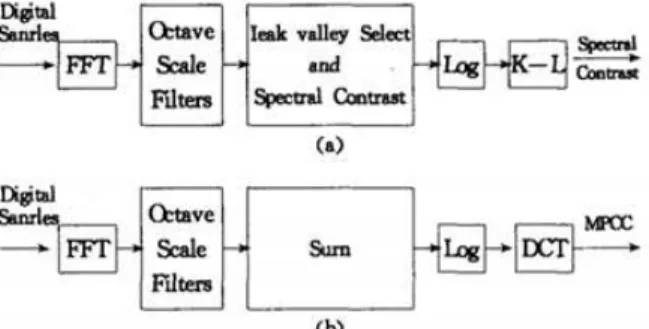
Fig.1The comparison between longitude of octave spectrum and MFCC
Figure 1 (a) shows the process of evaluation about the contrast features of octave spectrum of music. FFT is the first process and the spectrum is obtained from the mathematical sample. Then, the frequency domain is divided into sub band by the octave scale filters. The intensity of peak and valley value of spectrum and its differences are estimated in the spectrum of each sub-band. After being transformed into the log domain, the original spectral contrast features are mapped into the orthogonal spaces to estimate the relativity of different dimensions by the change of Loeve-Karhunen. The above process is using one frame to estimate octave contrast features, as for music clips or music segment, it contains the mean vector and the standard deviation vector of all the frames which can be used to represent the spectral characteristics. The estimation process of MFCC has also been listed in Figure 1 (b), and the two processes have some differences compared with the contrast features of octave spectrum of music.
The filter group is different. The contrast features of octave spectrum uses the octave scale filters, but, MFCC uses MEL proportional filter. Although the proportion of MEL is fit for normal auditory model, but octave scale filter is more suitable for processing music. In the course of realization, frequency domain is divided into six octave ratio sub-bands , such as, 0hz ~ 200Hz, 200Hz ~ 400Hz, 400Hz ~ 800Hz, 800Hz ~ 1600hz, 1600hz ~ 3200hz and 3200hz ~ 8000Hz (sample rate is 16KHz).[7] Because the spectrum contrast features is based on octave scale filter, thus, it is named about contrast features of octave spectrum. Considering the convenience of using it, it is
called spectral contrast in the rest of this paper.
Spectral contrast can be used to extract the peak and valley values of the spectrum and its differences in each sub band, but, the FFT can be used to make amplitude summation of the MFCC. Therefore, the characteristics of spectral contrast expresses the relative characteristics of spectrum, and MFCC only involve spectral mean information of spectrum, so, the characteristics of spectral contrast includes more spectrum information than that of MFCC.[7][8]
In the last step, spectral contrast uses K-L to make transformation, while, MFCC uses DCT to make transformation, they are equivalent without considering the relative point of view. But it is worth noting that the orthogonal basis vector of K-L transformation is obtained from the training data.
1.The Estimate of Spectral Contrast
In the extraction process of features, firstly, music segments are divided into frames by analysis window of 200ms that overlaps the 100ms, for each frame, the use of FI can get spectrum parts, and then it is divided into six sub bands that based on octave. Finally, spectral contrast is estimated from each octave sub bands.
Spectral contrast can be used to estimate the intensity of peak and valley values of the spectrum and its differences in each sub band. In this scheme, in order to ensure the stability of characteristic values, peak and valley values of spectrum are estimated by the mean of neighborhood domain of the maximum value and the minimum value, rather than the accurate maximum value and the minimum value. Therefore, the neighborhood factor is described as a small neighborhood. The detailed expressions are as follows:
If the sub-band of k’ FFT vector is{ ′ ′ L,
′}, after the descending order, a new vector can be expressed as if it meets the condition. ′ ′ ′Then, calculation formula of the strength of spectrum of the peak and valley value can be expressed as follows:
log
′
(1)
log
′
(2)
The difference between them is:
SCk—Peakk—VaUeyk (3) Here N is total of the first k sub-frequency bands, and k ∈ 〔1, 6]. In the experiment, “a” is between 0.02 and 0.2. It is shown that there is no significant change if “a”
varies within a certain range. In real practice, “a” is set up as 0.02. K ∈ {SCk, Valleyk)[1,6])was used to represent the contrast features of 12 dimensions original spectrum. Although the spectrum contrast shows the difference between the peak value and the valley value of spectrum, the intensity of the valley value is also included in the features, which makes it to include more information.[9]
2. Karhunen-Loeve transformation
It is obvious that correlation exists between the original features of different dimensions. Karhunen-Loeve transformation is used to eliminate the relativity so that this problem can be solved. After K - L transformation, eigenvectors are mapped to the orthogonal space, and the covariance matrix also becomes orthogonal in the new feature vector space. These features K - L transformation make classification of process easier, and good classification effect can be achieved when using a simple classifier. In our experiment, matrices estimated from each type of covariance matrix generate orthogonal basis vectors. Expression is as follows:
(4) Here “Sw” is generator matrix. “Pi” and represent the prior probability and the covariance matrix of the first class
“i”. In the experiment, Pi is set to 0.2, which is consistent with the equal probability distribution of each class ; is estimated from the collection of “i” music types. Orthogonal basis vectors are the feature vector of generated matrix Sw.
The deformation is as follows:
X'=Ux (5)
(6)
“x” is the original feature vector, and x 'is the spectrum contrast characteristic vector after K - L transformation. D is the dimension of the feature vector space, and uj is the first j orthogonal basis vector.
III.Classification Scheme
Usually, a type of music can be discerned in a few seconds, such as 10 seconds. So, first, the classification scheme is based on the music clips of 10 seconds, and then the classification scheme is extended to the whole length of the music.
In our method, 16 parts of gaussian mixture model (GMM) and maximum expected (EM) algorithm is used to estimate the parameters of GMM model for each type of music class.
“x” is made as the feature vector of 10-second long music clip, then probability density (mixed density) which belongs to the first class i music clips is defined as:
(7) Gi is the GMM model of first class “i”. Wij, uij and Cij are the first j part weight, average vector and covariance matrix of Gi respectively. Classification is easy. According to the bayesian criterion, each clip in the testing collection is classified to the class which has the most probability density. When the whole piece, not the 10 seconds clip participate in the classification, better effect can be achieved. As for the whole the music classification, it is divided into several periods of 10 seconds clip, the classification results of the whole piece are determined by the joint probability of each paragraph.
Assume that there are N independent 10-second long music clips in a whole piece, and the feature set is x - (x1, x2, K, xN), then the probability density of the first class “i” of the whole piece can be calculated as follows:
(8)
The classification result is determined by the maximum probability density. In the process of experimental operation, to reduce the computational complexity, 10- second music clips are extracted from each 30-second music piece of music.
IV.Experiment
1. Data collection
There are about 1500 pieces of music in the database, including five types of music: baroque music, romantic style of music, pop, jazz, and rock. The baroque style
music in the database is mainly the works of Bach and Handel, who are the most important composers in the baroque era. The romantic style of music in the database is composed of the works of Chopin, Beethoven, Schubert, Liszt and other composers at that time. Pop music is made up of the works of pop artists, including nine male singers and 16 female singers. The music of jazz and rock in the database also includes many different composers’ works. Different possible forms of music and musical instruments are included in the database of each music type. All music data of the database is 16 KHZ, 16 bit, mono file. About 6250 pieces of 10-second clip music are randomly selected from the 1500 pieces of music, which form the classified database. 5000 segments are used for training, and 1250 for testing. For each type of music, about 1000 clips are in the training set, and about 250 clip in the testing set. 10-second clips from one piece of music will not appear in the training set and test set at the same time.
2. The classification results
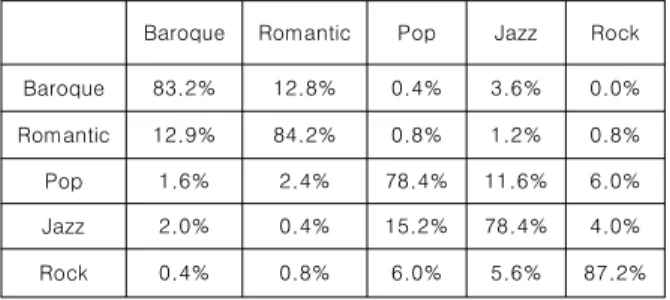
Spectrum contrast feature is used to classify the 10-second music clips first in the experiment. The mean deviation and standard deviation of the spectrum contrast constitute a 24 d eigenvector for the music clips, whose classification effect is very good and the average accuracy rate reaches to 82.3%. The detailed results can be seen from table 1.
Table 1 The classification results of 10-second music clips
Baroque Romantic Pop Jazz Rock
Baroque 83.2% 12.8% 0.4% 3.6% 0.0%
Romantic 12.9% 84.2% 0.8% 1.2% 0.8%
Pop 1.6% 2.4% 78.4% 11.6% 6.0%
Jazz 2.0% 0.4% 15.2% 78.4% 4.0%
Rock 0.4% 0.8% 6.0% 5.6% 87.2%
It can be seen from table 1 that the error rate of baroque and romantic styles of music classification are very high. However, when the two music styles are classified into the other three music styles, the errors rarely appear. This is because baroque style and romantic style music both belong to classical music. Their spectrum features are similar. The same phenomenon can be found in pop, jazz and rock.
Similar classification experiments can be done to the
whole music. The result is as the following table.
Baroque Romantic Pop Jazz Rock
Baroque 86.7% 10.0% 0.0% 3.3% 0.0%
Romantic 7.3% 90.9% 0.0% 1.8% 0.0%
Pop 0.0% 0.0% 92.3% 6.2% 1,5%
Jazz 1.7% 0.0% 5.2% 91.4% 1.7%
Rock 0.0% 0.0% 4.5% 3.0% 92.5%
Table 2 The classification results of the whole music
From table 2, it is clear that the accuracy rate of the average classification of the whole piece is up to 90.8%, which is higher than 82.3% got from the10-second clips.
Moreover, the error rate of each type is reduced.
3. Contrast with MFCC
MFCC is widely used in fields of audio classification and music classification, and was proved that it can achieve good results in these areas. Better performance can be achieved when MFCC is added to a function that is used to distinguish audio features. Therefore, in the comparative experiments, we will compare the classification performance of the three feature sets:
spectrum contrast, MFCC with more function and MFCC without it. And comparative experiments are only carried out in the testing set of10-second clips.
As for spectrum contrast, 12 MFCC features are extracted in order from each frame. Then, the 24 d feature set formed by the average and standard deviation of MFCC is used to estimate the accuracy rate of music clips. When the more function is applied to MFCC, it is 26 d feature set. The average accuracy rates of the three feature sets are shown in table 3.
Table 3 Average accuracy rate
Feature set Classification accuracy rate
MFCC 74.1%
MFCC with more function 78.0%
Spectrum contrast 82.3%
From table 3, it can be found that the accuracy rate of spectrum contrast, which is up to 82.3%, is better than that of the other two kinds of feature sets in terms of music style classification: 8.2% higher than that MFCC and 4.3% higher than that of MFCC with more function respectively.
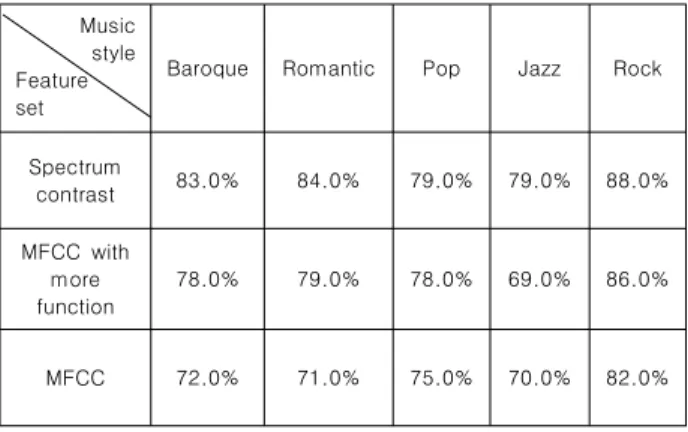
Table 4 The comparative results between spectrum contrast and MFCC features
Music style Feature set
Baroque Romantic Pop Jazz Rock
Spectrum
contrast 83.0% 84.0% 79.0% 79.0% 88.0%
MFCC with more function
78.0% 79.0% 78.0% 69.0% 86.0%
MFCC 72.0% 71.0% 75.0% 70.0% 82.0%
From table 4, it is clear that the error rate is decreased by 20% to 30% when MFCC feature is replaced by spectrum contrast feature for each type of music, which further proves that spectrum contrast features can improve the effect of the music classification greatly.
V. Conclusion
In this paper, the peak and valley value strength of a new feature set spectrum contrast (based on eight octave spectrum contrast) in each sub band processing spectrum, their difference and the relativity of spectrum characteristics are discussed. Based on spectrum contrast features, the automatic classification system of music style is formed: baroque style, romantic style, popular, jazz and rock. As for 10- second music clips, the average classification accuracy rate is up to 82.3%, and the whole piece is up to 90.8%. Comparative experiments also prove that spectral features is superior to the MFCC feature in the aspect of music style classification.
Predictably, spectrum contrast based on eight octave spectrum contrast will be applied more in the field of music style classification.
REFERENCES
[1] D.Li,I.K.Sethi,N.Dimitrova,and T.McGee,
“Classification of General Audio Data for Content—
Based Retrieval”. Pattern Recognition Letters, VO L. 22,No.t, pp.533-544,2010.
[2]Yao Qi, "The Analysis of Rhythm Art Characteristics
in the Movie Picture", Movie Literature, pp.29-31, Sept. 2013.
[3]Dong Ruijuan, Wang Shuo, Zhou Yun, Qi beier, Chen xueqing, and Liu Bo. "The Sutdy of Normal Range of Music Assessment System", Journal of Clinical Otolaryngology Head and Neck Surgery, pp.712-716, 2013.
[4]Zhao Can, "Rhythm of Footage", Youth Journalist, pp.83-94, 2012.
[5]Gao Yumin, and Song Jianhua, "The Design of Music Broadcast System based on PIC Microcontroller in PWM Mode", Measurement and Control Technology, pp.72-75, Sept. 2014.
[6]qZhen Lidong, "An Approach of Contrasting of High density Electronic Circuit Spectrum", Computer and Network, July 2012.
[7]Han Li, "Study on High Resolution Full Spectrum Decomposition", Ji Lin University, May 2013.
[8]Li Jian, "Application Research on Neural Network in Music Classification", Computer Simulation, Nov.
2010.
[9]Tian Hui, "Application of Support Vector Machine (SVM) Ensemble in Music Classification", Shandong Normal University, June 2009.
Author
Yanbing Wang received the B.S., M.S.
degrees in Musicology from Henan Normal University, China, in 2009 and 2012, Doctor of Applied Arts from Kyung Hee University in 2016. Dr. Wang joined the faculty of the Arts Department at Yangzhou Business University,
Yangzhou, China, in 2013. She is currently an associate Professor in the Department of Musicology, Yangzhou Business University. She is interested in Composing, Harmonics, Musicology etc.