INTRODUCTION
Birth weight is known to be the most important determin- ing factor of neonatal mortality (1). The infant morbidity or mortality of a community or a country is reported to be close- ly associated with the distribution of birth weight in that pop- ulation. An increase in low birth weight (LBW) infants or premature infants causes an increase in neonatal morbidity and mortality and infant mortality (2-5).
Although there have been several studies on neonatal birth weight distribution and very low birth weight (VLBW) infant survival rates in Korea (6-17), the populations in these stud- ies are small or limited to general hospitals and university hospitals. In effect, there is a shortage of large-scale or nation- wide studies of birth weight or other factors associated with infant morbidity and mortality in Korea.
Therefore the authors have selected as big a population as possible in Korea and collected data on birth weight and the perinatal factors, to find out the incidence of LBW infants
and VLBW infants, and also the gestational age (GA)-specific birth weight distribution.
MATERIALS AND METHODS
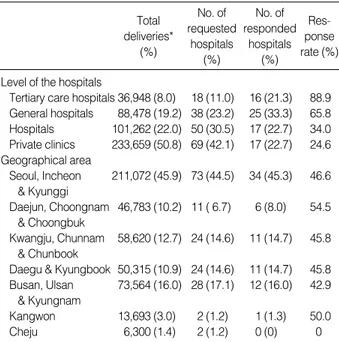
Data was collected on 118,538 live-born infants who were born in Korea between 1 January 2001 and 31 December 2001 at a GA over 23 weeks. Copies of the delivery room records were requested to 164 hospitals including general hos- pitals and obstetric private clinics where more than 1,000 deliveries were recorded per year as well as university hospitals in all parts of the country. The delivery records were received from 75 hospitals across the nation including 16 of 18 tertiary care hospitals (88.9%), 25 of 38 general hospitals (65.8%) and 17 of 50 hospitals (34%) and 17 of 69 obstetric clinics (24.6%) (Table 1). The registers of all live-born infants who were born after 23 weeks of GA were collected through mail.
Birth weight, GA, sex, mode of delivery, maternal age and Son-Moon Shin, Young-Pyo Chang*, Eun-Sil Lee�, Young-Ah Lee�, Dong-Woo Son�, Min-Hee Kim‖, Young-Ryoon Choi
Department of Pediatrics, Samsung Cheil Hospital, Sungkyunkwan University School of Medicine, Seoul;
Departments of Pediatrics*, Colleges of Medicine, Dankook University, Cheonan; Yeungnam University�, Daegu; Dong-A University�, Busan; Department of Pediatrics�, Bombit Hospital, Pyungchon;
Departments of Pediatrics‖, Colleges of Medicine, Kunkook University, Seoul; Chunnam National University¶, Gwangju, Korea
Address for correspondence Son-Moon Shin, M.D.
Department of Pediatrics, Samsung Cheil Hospital, Sungkyunkwan University School of Medicine, 1-19 Mookjung-dong, Jung-gu, Seoul 100-380, Korea Tel : +82.2-2000-7564, Fax : +82.2-2000-7778 E-mail : [email protected]
*This study was supported by a 2001-grant from the Korean Academy of Medical Sciences.
182
Low Birth Weight, Very Low Birth Weight Rates and Gestational Age- Specific Birth Weight Distribution of Korean Newborn Infants
To obtain the low birth weight (LBW) rate, the very low birth weight (VLBW) rate, and gestational age (GA)-specific birth weight distribution based on a large popu- lation in Korea, we collected and analyzed the birth data of 108,486 live births with GA greater than 23 weeks for 1 yr from 1 January to 31 December 2001, from 75 hospitals and clinics located in Korea. These data included birth weight, GA, gen- der of the infants, delivery type, maternal age, and the presence of multiple preg- nancy. The mean birth weight and GA of a crude population are 3,188±518 g and 38.7±2.1 weeks, respectively. The LBW and the VLBW rates are 7.2% and 1.4%, respectively. The preterm birth rate (less than 37 completed weeks of ges- tation) is 8.4% and the very preterm birth rate (less than 32 completed weeks of gestation) is 0.7%. The mean birth weights for female infants, multiple births, and births delivered by cesarean section were lower than those for male, singletons, and births delivered vaginally. The risk of delivering LBW or VLBW infant was higher for the teenagers and the older women (aged 35 yr and more). We have also obtained the percentile distribution of GA-specific birth weight in infants over 23 weeks of gestation.
Key Words : Infant, Low Birth Weight; Infants, Very Low Birth Weight; Gestational Age; Birth Weight; Birth Weight Distribution
Received : 23 March 2004 Accepted : 20 October 2004
the presence of multiple pregnancy of the data were entered into the database.
Of the data collected, 7,883 infants with uncertain birth weight or GA were excluded. After obtaining the distribu- tion of GA-specific birth weight, the data above the 99th per- centile or below the 1st percentile were excluded to remove typing errors during database input. However, all the defi- nite typing errors such as ‘6,500 g for 24 weeks of gestation’
could not be eliminated. Therefore 2,169 infants, whose birth weights were over the 95th percentile or under the 5th per- centile for GA, were excluded to eliminate typing errors. The total number of neonates included in this study was 108,486.
To obtain the distribution of birth weight, first the frequen-
cy of LBW infants (birth weight <2,500 g) and VLBW infants (birth weight <1,500 g) were determined, then percentiles of GA-specific birth weight were deduced. To eliminate risk factors that could affect birth weight, only singleton infants born to mothers who were between 20 and 34 yr of age were selected. In addition, to compensate for errors in estimating GA by last menstrual period, using the same method used by Williams et al. (18), we divided the group by birth weight into 250 g intervals and excluded those with GA above the 99th percentile or below the 1st percentile for each group.
Consequently the GA-specific percentile distribution of birth weight was obtained from 77,192 infants.
Data were expressed as the mean±standard deviation, 95%
confidence interval and proportion (%). Student t-test was used to compare the means of each group and chi-square test to compare incidence or proportion. Statistical procedures were performed using SPSS ver. 10.0 (SPSS, Inc., Chicago, IL). A p-value below 0.05 was considered statistically significant.
RESULTS LBW, VLBW, and premature rates
Mean birth weight and mean GA for the entire groups were 3,188±518 g and 38.7±2.1 weeks respectively. The LBW rate and the VLBW rate were 7.2% and 1.4% respec- tively, and the birth rate of premature infants under 37 weeks
*Number of deliveries in 2001 reported by the Health Insurance Review Agency (23).
Res- ponse rate (%) No. of responded
hospitals (%) No. of requested
hospitals (%) Total
deliveries*
(%)
Level of the hospitals
Tertiary care hospitals 36,948 (8.0) 18 (11.0) 16 (21.3) 88.9 General hospitals 88,478 (19.2) 38 (23.2) 25 (33.3) 65.8 Hospitals 101,262 (22.0) 50 (30.5) 17 (22.7) 34.0 Private clinics 233,659 (50.8) 69 (42.1) 17 (22.7) 24.6 Geographical area
Seoul, Incheon 211,072 (45.9) 73 (44.5) 34 (45.3) 46.6
& Kyunggi
Daejun, Choongnam 46,783 (10.2) 11 ( 6.7) 6 (8.0) 54.5
& Choongbuk
Kwangju, Chunnam 58,620 (12.7) 24 (14.6) 11 (14.7) 45.8
& Chunbook
Daegu & Kyungbook 50,315 (10.9) 24 (14.6) 11 (14.7) 45.8 Busan, Ulsan 73,564 (16.0) 28 (17.1) 12 (16.0) 42.9
& Kyungnam
Kangwon 13,693 (3.0) 2 (1.2) 1 (1.3) 50.0
Cheju 6,300 (1.4) 2 (1.2) 0 (0) 0
Table 1.Distribution of hospitals by the level and geographical area
LBW, low birth weight, less than 2,500 g; VLBW, very low birth weight, less than 1,500 g; ELBW, extremely low birth weight, less than 1,000 g;
Preterm, less than 37 weeks; Extremely preterm, less than 32 weeks;
Postterm, more than 42 weeks; SD, standard deviation; CI, confidence interval.
Variables Number (%) Mean±SD (95% CI)
Total 108,486 (100)
Birth weight (g) 3,188±518 (3,185-3,191)
LBW 7,774 (7.2)
VLBW 1,521 (1.4)
ELBW 709 (0.7)
Gestational age (week) 38.7±2.1 (38.6-38.7)
Preterm 9,158 (8.4)
Extremely preterm 1,865 (1.7)
Postterm 1,015 (0.9)
Table 2.LBW and VLBW rates and preterm and postterm rates
*: Birth weights were expressed as mean±standard deviation with 95%
confidence interval in the parenthesis, �: P values are based on t-test or ANOVA, �: versus male, �: versus singleton, ‖: versus singleton or twin,
¶: versus vaginal delivery, **: versus 20-34 yr of maternal age.
Variables Number (%) Birth weight (g)* p-value�
Total 108,486 (100)
Gender
Male 56,461 (52.0) 3,229±520 (3,225-3,234) Female 51,962 (47.9) 3,141±508 (3,140-3,149) 0.000�
Unknown 63 (0.1)
Multiplicity
Singleton 105,652 (97.4) 3,210±499 (3,206-3,213) Twin 2,691 (2.5) 2,381±537 (2,360-2,401) 0.000� Triplet 103 (0.1) 2,215±545 (2,109-2,322) 0.000‖
Unknown 40 (0.0)
Delivery type
Vaginal delivery 58,838 (54.2) 3,233±462 (3,229-3,264) Cesarean section 34,063 (31.4) 3,133±568 (3,127-3,139) 0.000¶ Unknown 15,585 (14.4)
Maternal age (yr)
<20 469 (0.4) 2,939±612 (2,884-2,995) 0.000**
20-34 80,161 (73.9) 3,186±518 (3,183-3,190) 35-39 7,932 (7.3) 3,140±585 (3,127-3.153) 0.000**
>39 1,491 (1.4) 3,070±666 (3,036-3,104) 0.000**
unknown 18,433 (17.0)
Table 3.Variables affecting birth weight and mean birth weight according to variables
of GA was 8.4%. Birth rates of extremely low birth weight (ELBW) infants under 1,000 g and premature infants under 32 weeks of GA were 0.7% and 1.7% respectively. Postma- ture rate over 42 weeks of GA was 0.9% (Table 2).
Perinatal factors affecting birth weight and mean birth weight
Of all the subjects in the study, 52.0% was male, 2.6% was multiple pregnancies, and 31.4% was delivered via cesarean section. Maternal age distribution was as follows: 1.4% under 20 yr of age, 73.9% between 20 and 34, 7.3% between 35 and 39, 1.4% over 40. Birth weight of male infants was heav- ier than female infants by 85 g, twins were lighter than sin- gletons by 829 g, and infants delivered by cesarean section were 99 g lighter than those delivered vaginally. Birth weights of infants grouped by maternal age were significantly differ- ent between groups. Infants born to mothers between 20 and 34 yr of age were heavier than those with maternal age below 20 yr or over 35 yr of age (Table 3).
LBW rate and VLBW rate with regard to perinatal factors
Although there was no difference in VLBW rate between male and female infants, LBW rate was higher for female infants by 0.9% (p<0.001). LBW rate, VLBW rate, ELBW rate of twins were 52.9%, 6.9%, and 2.5%, which were sig-
nificantly higher than those of singletons, 5.9%, 1.3%, and 0.6% respectively, and these rates were even higher in higher- number multiple pregnancies than those of singletons (p<
0.001). LBW rate and VLBW rate in infants with cesarean delivery were more than two times higher than those of infants delivered vaginally (11.0% vs. 4.7%, and 1.8% vs. 0.8%, re- spectively). In infants born to teenage mothers, LBW, VLBW, ELBW rates were 18.6%, 3.2%, 1.7%, respectively, which were about two times higher than those of infants with mater- nal age between 20 and 34 yr, 7.2%, 1.4%, and 0.7% (p<
0.001). Infants whose mothers aged 35 yr and more also show- ed higher LBW, VLBW, ELBW rates than those of infants with maternal age between 20 and 34 yr (p<0.001) (Table 4).
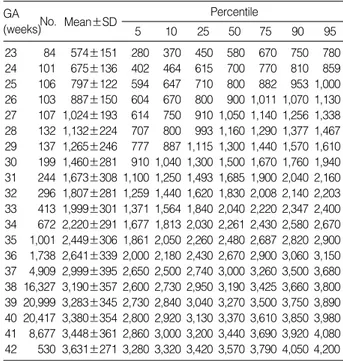
Percentile distribution of GA-specific birth weight
GA-specific birth weight for GA between 23 weeks and 42 weeks, are shown on Table 5.
DISCUSSION
Neonatal morbidity and mortality are affected by the quali- ty of perinatal care (1, 2, 19). Neonatal mortality rate was markedly reduced by the progress of neonatal intensive care in last 2 decades in Korea (19). None the less, the lower birth weight newborn infants showed, the lower possibility of sur- vival they had (2-4, 19). A rise of LBW rate in a country in- creases neonatal mortality and also infant mortality rate, which is an important indicator of the level of public health in the
*: p values are based on chi-square test. LBW, low birth weight, less than 2,500 g; VLBW, very low birth weight, less than 1,500 g; ELBW, extremely low birth weight, less than 1,000 g; VD, vaginal delivery; CS, cesarean section.
Variables Number (%) p-value*
Gender Male Female
Total 56,461 (100) 51,962 (100)
LBW 3,805 (6.7) 3.940 (7.6) 0.000
VLBW 763 (1.4) 735 (1.4) 0.374
ELBW 346 (0.6) 342 (0.7) 0.347
Multiplicity Singleton Twin Triplet Total 105,652 (100) 2,691 (100) 103 (100) LBW 6,262 (5.9) 1,423 (52.9) 73 (70.9) 0.000
VLBW 1,323 (1.3) 186 (6.9) 9 (8.7) 0.000
ELBW 646 (0.6) 67 (2.5) 4 (3.9) 0.000
Delivery type VD CS
Total 28,838 (100) 34,063 (100)
LBW 2,752 (4.7) 3,746 (11.0) 0.000
VLBW 478 (0.8) 605 (1.8) 0.000
ELBW 241 (0.4) 170 (0.5) 0.048
Maternal age (yrs) <20 20-34 ≥35 Total 469 (100) 80,161 (100) 9,423 (100) LBW 87 (18.6) 5,780 (7.2) 1,002 (10.6) 0.000 VLBW 15 (3.2) 1,139 (1.4) 250 (2.7) 0.000
ELBW 8 (1.7) 526 (0.7) 118 (1.2) 0.000
Table 4.LBW, VLBW and ELBW rate according to the variables affecting birth weight
*77,192 singleton births to women aged 20-34 yr were only selected.
No. Mean±SD Percentile
5 10 25 50 75 90 95
GA (weeks)
23 84 574±151 280 370 450 580 670 750 780
24 101 675±136 402 464 615 700 770 810 859 25 106 797±122 594 647 710 800 882 953 1,000 26 103 887±150 604 670 800 900 1,011 1,070 1,130 27 107 1,024±193 614 750 910 1,050 1,140 1,256 1,338 28 132 1,132±224 707 800 993 1,160 1,290 1,377 1,467 29 137 1,265±246 777 887 1,115 1,300 1,440 1,570 1,610 30 199 1,460±281 910 1,040 1,300 1,500 1,670 1,760 1,940 31 244 1,673±308 1,100 1,250 1,493 1,685 1,900 2,040 2,160 32 296 1,807±281 1,259 1,440 1,620 1,830 2,008 2,140 2,203 33 413 1,999±301 1,371 1,564 1,840 2,040 2,220 2,347 2,400 34 672 2,220±291 1,677 1,813 2,030 2,261 2,430 2,580 2,670 35 1,001 2,449±306 1,861 2,050 2,260 2,480 2,687 2,820 2,900 36 1,738 2,641±339 2,000 2,180 2,430 2,670 2,900 3,060 3,150 37 4,909 2,999±395 2,650 2,500 2,740 3,000 3,260 3,500 3,680 38 16,327 3,190±357 2,600 2,730 2,950 3,190 3,425 3,660 3,800 39 20,999 3,283±345 2,730 2,840 3,040 3,270 3,500 3,750 3,890 40 20,417 3,380±354 2,800 2,920 3,130 3,370 3,610 3,850 3,980 41 8,677 3,448±361 2,860 3,000 3,200 3,440 3,690 3,920 4,080 42 530 3,631±271 3,280 3,320 3,420 3,570 3,790 4,050 4,200 Table 5.Gestational age specific birth weight distribution*
country (2). Therefore the first step to reduce infant or neona- tal mortality rate is the reduction of LBW rate, and basic data on LBW rate and VLBW rate must be gathered. Unfortu- nately, nationwide governmental surveillance of birth rate and neonatal mortality is not adequate in Korea. There is insufficient data on perinatal indices, including birth weight.
In general, the LBW and the VLBW rates are estimated to be 6-8% and 1.0-1.5%, respectively in Korea (9). In the most recent study on birth weight and LBW rate in Korea in 1996, data were gathered nationwide from 64 hospitals and the results were: LBW rate 9.8%, VLBW rate 1.7%, ELBW rate 0.5% (8). The results from that study could show higher LBW rate and VLBW rate than the real rates, since the sur- vey was conducted mainly in general hospitals or university hospitals where proportion of high risk pregnancy was proba- bly higher than that of private obstetric clinics (8).
The number of the newborn infants included in this study was 108,486. This constituted 19.5% of the 557,228 infants born in 2001 according to Korean National Statistical Office report (20). Although it is also insufficient to represent the trends in the whole country of Korea, this study could reflect the national trend more accurately than the previous studies, because private obstetric clinics were also included. The LBW rate and the VLBW rate, according to the Korean National Statistical Office report (20), were 3.55% and 0.24% in 2000 and 3.59% and 0.36% in 2001, which differ considerably from the results of our study and the National Vital Statis- tics Report of the United States (21, 22). This discrepancy can be caused by two factors, one of which may be the omis- sion of VLBW and LBW infants from the record of the nation- al statistics, since it was based on the birth registration and birth certificate does not need to be filed if the infant has died soon after birth. The other reason could be the overestima- tion of LBW or VLBW rate in our study due to the higher response rate in the tertiary care hospitals and general hos- pitals than hospitals and private obstetric clinics. According to the report from Health Insurance Review Agency, nearly half of total deliveries were conducted at local private clinics and only 8% were conducted at the tertiary care hospitals (23). Therefore, data from tertiary care hospitals which con- tains more high risk pregnancies could increase the LBW and VLBW rates. In spite of even in possibility of omission and overestimation, the difference is too great and it should be reevaluated in the future studies.
According to the recent National Vital Statistics Report of the United States, the LBW rate was 7.7%, the VLBW rate was 1.44% (21). The LBW rate and the VLBW rate were sim- ilar to the ones in our study. However, the LBW and VLBW rates in singletons in our study were 5.9% and 1.3% respec- tively, which were higher than those of non-Hispanic single- tons in the United States by about 1% and 0.5%. The rate of premature infants under 37 weeks of gestation was 11.9%, and that of very premature infants under 32 weeks was 1.95%
in the United States, which were higher than those in this
study. This means that the rate of high risk infants in Korea is not significantly lower than those of other western devel- oped countries, and also, the data obtained from this study could be considered in the planning and organization of the perinatal care in Korea.
The factors influencing birth weight include biological and medical factors such as gender of the neonate, genetic fac- tors, maternal age, birth order, twin or multiple pregnancy, maternal morbidity, nutritional status and obstetrical com- plications, and socioeconomic factors such as race, education, financial ability, the extent of prenatal examination, marital status, teenage pregnancy, social and psychological stress (1, 2, 24-28). However, as the data on biological, socioeconom- ic, demographic factors that could affect birth weight were not collected in this study, the analyses on those factors were not included in this study.
For all that, our data showed significant differences in birth weight and low birth weight rate in relation to maternal age, multiple pregnancy and the gender of the neonate. Of these factors, the maternal age has a close correlation with the birth weight. Infants born to mothers in their teens and those born to mothers aged 35 yr and more have shown LBW rate of 18.6% and 10.6% respectively, which were higher than those of infants born to mothers who were between 20 and 34 yr of age by 11.4% and 3.4%. In addition, the recent small, but steady increase in LBW rate and VLBW rate in the United States was attributed to the increase in multiple pregnancies (21, 22), and in our study we have also found that mean birth weight of twins was lighter than that of singletons by more than 800-1,000 g, and that VLBW rate and LBW rate were also 5 times and 10 times higher than those of singletons.
Increase in maternal age and multiple pregnancies could be the cause of increase in LBW and VLBW rates in the future.
There were several previous studies on the distribution of birth weight regarding to the GA in the newborn infants (13-17), but those were hospital-based studies on the new- born infants only who were born at their own hospitals. And there were also a few studies on Koreans living in the United States (29-32), but the number of neonates in the study was quite limited.
To obtain the percentile distribution of birth weight of a group, all the factors mentioned above must be considered, but we were able to control only the maternal age and pres- ence of multiple pregnancy. Therefore, we could not compare our data with those from other countries.
Despite these shortcomings, the data acquired in our study could be the starting point for similar studies in the future, which must be a more thorough study with all the biologi- cal, socio-demographic factors put into consideration. In con- clusion, we were able to obtain data on LBW rate and VLBW rate, birth weight distribution in a large population in Korea, and we consider that the results from this study would be a great help for future studies on birth weight, frequency of high risk infants, neonatal morbidity and mortality, and peri-
natal risk factors.
ACKNOWLEDGMENT
The authors wish to express deep gratitude to the neona- tologists and obstetricians who are working at the following hospitals for their assistance in this study. Names of the par- ticipating hospitals are Ajou University Hospital, Andong Sungso Hospital, Areum Hospital, Asea Hospital, Asan Medi- cal Center of University of Ulsan, Busan Adventist Hospital, Changwon Fatima Hospital, Cheil Hospital, Chonbuk Nation- al University Hospital, CL Obstetrics and Gynecology Clin- ic, Daegu Catholic University Medical Center, Daejeon St. Mary’s Hospital of the Catholic University of Korea, Daejin Medi- cal Center Bundang Jesaeng Hospital, Dr. Kim’s Ob & Gyn Clinic, Eden Hospital, Ehwa Womans University Mokdong Hospital, Eulji General Hospital, Eulji University Hospital, Eun Hospital, Gachon Medical School Gil Medical Center, Gayajamo Hospital, Geo Je Hospital, Good Moonhwa Hos- pital, Good Samsun Hospital, Green Hospital, Guri Jang’s Obstetrics and Gynecology Clinic, Handong University Good Samaritan Hospital, Hanmaeum Obstetrics and Gynecolo- gy Clinic, Hansarang Hospital, Hanyang University Hospi- tal, Hosan Women’s Hospital, Hwamyung Ilsin Christian Hospital, Hyekyung Women’s Clinic, Hyosung Woman’s Medical Center, Hyundai Hospital, Ilsin Christian Hospi- tal, Inje University Sanggye Paik Hospital, Injung Hospi- tal, Jang’s Women’s Hospital, Jeon-Ju Jesus Hospital, Kang- nam Sacred Heart Hospital of Hallym University, Kang- nam St. Mary’s Hospital of the Catholic University of Korea, Kayang Women’s Clinic, Keimyung University Dongsan Medical Center, Konyang University Hospital, Kwangju Christian Hospital, Kyunghee University Hospital, Major Woman’s Care Center, Masan Samsung Hospital of Sungkyun- kwan University, Min Byung Yul Obstetrics and Gynecology Clinic, Mirae and Heemang Ob and Gyn Clinic, Miz Medi Hospital, Moa Obstetrics and Gynecology Clinic, Moonhwa Obstetrics and Gynecology Clinic, No Won Jae Ob and Gyn Clinic, Our Lady of Mercy Hospital of the Catholic Univer- sity of Korea, Park Women’s Clinic, Pochon Cha University Hospital, Samsung Cheil Hospital of Sungkyunkwan Uni- versity, Seoul Adventist Hospital, Seoul National Universi- ty Hospital, Seoul Obstetrics and Gynecology Clinic, Seoul Yale Women’s Hospital, Severance Hospital of Yonsei Uni- versity, Shin Se Gae Women’s Hospital, Soonchunhyang Gumi Hospital, Soon Chun Hyang University Cheonan Hospital, Soon Chun Hyang University Hospital, St. Mary’s Hospital of the Catholic University of Korea, Sung Ae Hospital, Sungse Hospital, The Catholic University of Korea Holy Family Hospital, Wonju Christian Hospital of Yonsei University, Yiyeon Women’s Hospital, and Yoon Obstetrics and Gyne- cology Clinic.
REFERENCES
1. Lubchenco LO, Searls DT, Brazie JV. Neonatal mortality rate: rela- tionship to birth weight and gestational age. J Pediatr 1972; 81: 814- 22.
2. Lee KS, Paneth N, Gartner LM, Pearlman M. The very low-birth- weight rate: Principal predictor of neonatal mortality in industrial- ized populations. J Pediatr 1980; 97: 759-64.
3. Stevenson DK, Wright LL, Lemons JA, Oh W, Korones SB, Papile LA, Bauer CR, Stoll BJ, Tyson JE, Shankaran S, Fanaroff AA, Dono- van EF, Ehrenkranz RA, Verter J. Very low birth weight outcomes of the National Institute of Child Health and Human Development Neonatal Research Network, January 1993 through December 1994.
Am J Obstet Gynecol 1998; 179: 1632-9.
4. Lemons JA, Bauer CR, Oh W, Korones SB, Papile L, Stoll BJ, Vert- er J, Temprosa M, Wright LL, Ehrenkranz RA, Fanaroff AA, Stark A, Carlo W, Tyson JE, Donovan EF, Shankaran S, Stevenson DK.
Very low birth weight outcomes of the National Institute of Child Health and Human Development Neonatal Research Network, Jan- uary 1995 through December 1996. Pediatrics 2001; 107: e1.
5. Horbar JD, Badger GJ, Carpenter JH, Fanaroff AA, Kilpatrick S, LaCorte M, Phibbs R, Soll RF, Members of the Vermont Oxford Network. Trends in mortality and morbidity for very low birth weight infants, 1991-1999. Pediatrics 2002; 110: 143-51.
6. Kim SJ, Namgung R, Lee C, Han DG. The result of intensive care on the very low birth weight infants (1,001-1,500 gm). Korean J Pediatr 1988; 31: 29-39.
7. Jeon SS, Lee WM, Choi YS, Seo SS. Clinical survey of very low birth weight infants. Korean J Pediatr 1988; 31: 1120-5.
8. Bae CW, Kim MH, Chun CS, Lee C, Moon SJ, Yoo BH, Lim BK, Lee SG, Choi YY, Byun SH, Choi AH, Pi SY, Han DG, Cho SH, Yun CK. Neonatal Statistics of Korea in 1996: Collective results of live- births, neonatal mortality, and incidence of discharge against medi- cal advice at 64 hospitals. J Korean Soc Neonatol 1997; 4: 153-69.
9. Bae CW. Neonatal viability, morbidity, mortality and outcome of very low birth weight infant. Korean J Pediatr 2000; 43: 1-12.
10. Kim SS, Kim MH, Shim JW, Ko SY, Lee EK, Chang YS, Kang IS, Park WS, Lee MH, Lee SI, Lee HJ. Changes in the outcomes of very low birth weight infants. Korean J Pediatr 2002; 45: 828-35.
11. Ma TH, Lee YK, Kim KA, Ko SY, Kim MJ, Shin SM. Outcome of very low birth weight infants in past 2 years at Samsung Cheil Hos- pital. J Korean Soc Neonatol 2003; 10: 7-13.
12. Kim YO, Kim SH, Cho CY, Choi YY, Kook JH, Hwang TJ. Changes in incidence, survival rate and mortality of very low birth weight infants. Korean J Pediatr 2003; 46: 769-76.
13. Kim YH, Han DG. A study on intrauterine growth standard. Korean J Pediatr 1984; 27: 531-42.
14. Hwang SG, Park JJ, Nam JH, Chung JK. Birth weight percentiles and growth pattern at 21 to 44 weeks of gestation. J Korean Med Assoc 1987; 30: 885-95.
15. Seo K, Park YW, Park TK. Birth weight distribution by gestational age and constructing cut-off value for fetal growth retardation (FGR):
their statistical consideration. Korean J Obstet Gynecol 1989; 32:
530-40.
16. Park NH, Yoon BH, Shin HC, Kim SW. Growth pattern of the new- born infants by gestational age. Korean J Obstet Gynecol 1991; 34:
322-30.
17. Lee GH, Kim YW, Lee KB, Seo EJ, Son MS, Ahn HG, Seok EW, Choi YJ, Kim GJ, Kim SY, Hwang BC, Choi YD, Kim SY, Sohn SJ. Change of birth weight -gestational age table. Korean J Obstet Gynecol 2001; 44: 1851-6.
18. Williams RL, Creasy RK, Cunningham GC, Hawes WE, Norris FD, Tashiro M. Fetal growth and perinatal viability in California. Obstet Gynecol 1982; 59: 624-32.
19. Bae YM, Bae CW. The changes in the mortality rates of low birth weight infant and very low birth weight infant in Korea over the past 40 years. J Korean Med Sci 2004; 19: 27-31.
20. Korea statistical information system. URL: http://kosis.nso.go.kr.
[Accessed march 2, 2004.]
21. Martin JA, Hamilton BE, Ventura SJ, Menacker F, Park MM, Sut- ton PD. Births: final data for 2001. Natl Vital Stat Rep 2002; 51: 1- 102.
22. Martin JA, Hamilton BE, Ventura SJ, Menacker F, Park MM. Births:
final data for 2000. Natl Vital Stat Rep 2002; 50: 1-101.
23. Health Insurance Review Agency. A report on the appropriateness of health insurance reimbursement on cesarean section. Health Insur- ance Review Agency 2002; 22-36.
24. Gould JB, LeRoy S. Socioeconomic status and low birth weight: a racial comparison. Pediatrics 1988; 82: 896-904.
25. Savitz DA, Blackmore CA, Thorp JM. Epidemiologic characteris- tics of preterm delivery: etiologic heterogeneity. Am J Obstet Gynecol 1991; 164: 467-71.
26. Sumits T, Bennett R, Gould J. Maternal risks for very low birth weight infant mortality. Pediatrics 1996; 98: 236-41.
27. Gould JB, Madan A, Qin C, Chavez G. Perinatal outcomes in two dissimilar immigrant populations in the United States: a dual epi- demiologic paradox. Pediatrics 2003; 111: e676-82.
28. Kitchen WH, Ryan MM, Rickards A, Astbury J, Ford G, Lissenden JV, Keith CG, Keir EH. Changing outcome over 13 years of very low birthweight infants. Semin Perinatol 1982; 6: 373-89.
29. Mor JM, Alexander GR, Kieffer EC, Baruffi G. Birth outcomes of Korean women in Hawaii. Public Health Rep 1993; 108: 500-5.
30. Singh GK, Yu SM. Birthweight differentials among Asian Ameri- cans. Am J Public Health 1994; 84: 1444-9.
31. Wang X, Guyer B, Paige DM. Differences in gestational age-spe- cific birthweight among Chinese, Japanese and white Americans.
Int J Epidemiol 1994; 23: 119-28.
32. Shiono PH, Rauh VA, Park M, Lederman SA, Zuskar D. Ethnic dif- ferences in birth weight: the role of lifestyle and other factors. Am J Public Health 1997; 87: 787-93.