INTRODUCTION
The Third Report of the National Cholesterol Education Program Adult Treatment Panel III (NCEP ATP III) proposed the importance of the metabolic syndrome in assessing and managing cardiovascular diseases (1). People with the metabol- ic syndrome are at an increased risk for morbidity as well as mortality from cardiovascular disease (2, 3). Abdominal obe- sity, particularly visceral obesity promotes the insulin resistance (4-6), and also causes the clustering of cardiovascular risk fac- tors at a given level of body mass index (BMI) (7, 8). A high waist circumference, a good predictor of cardiovascular disease (9), is one of important diagnostic standpoints of the metabolic syndrome. A recent prospective study has shown that obesity appears to be the central component of the metabolic syndrome (10), and thus, identification of these high-risk individuals would be crucial in order to provide appropriate therapy with the currently available disease-modifying treatments along with the recommendation of weight reduction as first-line treatment (1).
Korea, like other Asian countries, has experienced rapid socioeconomic growth with prominent lifestyle transforma- tion over the past several decades. The cardiovascular dis- eases is being witnessed as one of the most common causes of death in Korea (11). Asians tend to show a high prevalence of cardiovascular risk factors at even lower BMI compared to
Caucasians, presumably due to a greater central obesity (8). The prevalence of metabolic syndrome has been reported to be more than 20% among Koreans despite a lower prevalence of obesity (12). However, the BMI increment was identified as one of independent modifiable risk factors of the metabolic syndrome among Koreans (12).
The modification of associated factors is known to be essen- tial to prevent and to manage the metabolic syndrome. How- ever, little information is available regarding the effect of weight reduction or change of fat distribution on the metabolic components in obese patients among Koreans. The aims of this study were to examine the change of anthropometric in- dices, fat distribution, and metabolic components with mod- est weight reduction (5-10%), to compare the efficacy of weight reduction in patients with or without the metabolic syndrome, and to investigate the predictable variables for improvement of the metabolic components and insulin resistance during weight reduction in Korean obese patients.
MATERIALS AND METHODS Recruitment of subjects
Our study included 78 obese patients (BMI ≥25 kg/m2) aged 15-60 yr (19 males and 59 females) who visited the Obe-
Hye Soon Park, Su Jung Sim, Jung Yul Park*
Department of Family Medicine, Asan Medical Center, University of Ulsan College of Medicine, Seoul;
*Department of Neurosurgery, Korea University Medical Center, Seoul, Korea
Address for correspondence Hye Soon Park, M.D.
Department of Family Medicine, Asan Medical Center, University of Ulsan College of Medicine, 388-1 Poongnap-dong, Songpa-gu, Seoul 138-736, Korea Tel : +82.2-3010-3813, Fax : +82.2-3010-3815 E-mail : [email protected]
202
Effect of Weight Reduction on Metabolic Syndrome in Korean Obese Patients
The Third Report of the National Cholesterol Education Program Adult Treatment Panel III emphasized the importance of management of the metabolic syndrome.
However, little information is available about the effect of weight reduction on the metabolic syndrome in obese patients among Koreans. A longitudinal clinical inter- vention study from the 12-week of weight reduction program, including life style modi- fication and adjuvant appetite suppressants, in 78 obese persons was performed.
Anthropometry and metabolic risk factors were measured before and after weight reduction. Visceral (VAT), subcutaneous (SAT), and total adipose tissue (TAT) on abdomen were determined by CT scan. Moderate decrease in weight (9.3%) induced significant reduction of waist circumference, systolic and diastolic blood pressure, and triglyceride. Weight reduction also resulted in significant decrease in total cholesterol, LDL-C, uric acid, fasting insulin, and HOMA score. The subjects with metabolic syn- drome showed more improvements of metabolic components than those without metabolic syndrome through weight reduction. The reductions of visceral-subcuta- neous fat ratio (VSR) and waist circumference were observed as for the predictable variables related to the improvement of metabolic component and insulin resistance in Korean obese patients.
Key Words : Metabolic Syndrome X; Weight Reduction; Weight Loss; Obesity; Koreans
Received : 11 July 2003 Accepted : 13 November 2003
sity Clinic in Asan Medical Center. This study was approved by the Institutional Review of Board of Asan Medical Center.
The subjects excluded from this study were pregnant or lac- tating women, and those with secondary causes of obesity and evidence of severe hepatic or renal diseases. Also, the subjects who were taking medications that might have had affect on the metabolic components of metabolic syndrome (e.g., anti- hypertensive drug, oral hypoglycemic agents, insulin, hypolipi- demic agents, and lipase inhibitors) were excluded. All indi- viduals were subjected to a medical evaluation by physicians who were responsible for taking full medical history and phys- ical examination.
Anthropometric measurements
Anthropometric measurements were taken with the sub- jects in light clothing and without shoes. Height and weight were measured by an automatic height-weight scale, to the nearest 0.1 cm and 0.1 kg. Body mass index (BMI) was cal- culated by dividing weight (kg) by square of height (m2). Per- cent body fat and total body fat were then measured by bioim- pedance analysis (Inbody 3.0, Biospace, Seoul, Korea) (13). The waist circumference was measured at the midpoint between the lower border of the rib cage and the iliac crest, and the hip circumference at the widest part of the hip region. Only one well trained technician checked the anthropometric mea- surements throughout the whole process of this study to redu- ce the interpersonal variations. The waist-to-hip ratio (WHR) was calculated by dividing the waist circumference by the hip circumference.
Computed tomography
Cross-sectional abdominal visceral and subcutaneous adi- pose tissue areas were measured by computed tomography (CT) on a Siemens Somaton Scanner (Erlangen, Germany) using an established protocol (14, 15). A cross-sectional scan at 10- mm thickness centered at the L4-L5 vertebral disc space with the subject in the supine position was obtained using a radio- graph of the skeleton as a reference to establish the position of the scans to the nearest millimeter. Subcutaneous and vis- ceral adipose tissue (SAT and VAT) boundaries were defined using a manual cursor by delineating these areas with a graph pen, and the adipose tissue areas were calculated by comput- ing the adipose tissue surfaces with an attenuation range of -190 to -30 Hounsfield units. The abdominal VAT area was measured by drawing a line within the muscle wall surround- ing the abdominal cavity. The SAT area was calculated by sub- tracting the VAT area from the total adipose tissue (TAT) area and the VAT to SAT ratio (VSR) was then calculated.
Metabolic variables
The metabolic components of the metabolic syndrome (e.g.,
blood pressure, fasting blood glucose, triglyceride, and HDL- cholesterol) as well as other metabolic variables (total choles- terol, LDL-cholesterol, uric acid, fasting insulin and HOMA score) were measured in the study subjects before and after weight reduction.
Blood pressure was measured with a mercury sphygmoma- nometer after 10 min rest in the sitting position. All study subjects were refrained from smoking or ingesting caffeine for 30 min preceding the measurements. Cuff size was selected according to arm circumference of the participants. The first appearance of sound (phase 1 Korotkoff sound) was used to define systolic blood pressure and the disappearance of sound (phase 5 Korotkoff sound) was used to define diastolic blood pressure (16). Two readings for each of systolic and diastolic blood pressure were recorded and the average of each measure- ment was used. If the first two measurements differed by more than 5 mmHg, additional readings were obtained.
Blood samples were obtained in the morning after a 12 hr overnight fast from an antecubital vein into vacutainer tubes containing EDTA and subsequently analyzed at a central, cer- tified laboratory. Plasma glucose was measured by a glucose oxidase method, and total cholesterol and triglyceride levels by enzymatic procedures using an autoanalyzer (Hitachi-747, Tokyo, Japan). The HDL-cholesterol fraction was measured by enzymatic method after precipitation of apo-B containing lipoproteins with MnCl2. LDL cholesterol was calculated by Friedewald equation if triglyceride was below 400 mg/dL (17).
The uric acid concentrations were measured by uricase method using autoanalyzer. Fasting insulin was measured by radioim- munoassay (Dianabott, Tokyo, Japan). The estimate of insulin resistance by HOMA score was calculated with the formula:
fasting serum insulin ( U/mL)×fasting plasma glucose (mmol/
L)/22.5 (18).
Participants having 3 or more of the following criteria were defined as having the metabolic syndrome; blood pressure:
≥130/≥85 mmHg; fasting glucose: ≥110 mg/dL; hyper- triglyceridemia: ≥150 mg/dL; and low HDL-cholesterol:
<40 mg/dL in men and <50 mg/dL in women, and abdom- inal obesity: waist circumference >102 cm in men and >88 cm in women as detailed in the NCEP ATP III report (1).
Weight reduction program
The weight reduction program consisted of life style mod- ification and adjuvant pharmacotherapy using appetite sup- pressants. Unrestricted routine dietary intake of subjects was assessed by 24-hr dietary recall. For this, experienced, well- trained interviewers instructed respondents to recall and de- scribe all foods and beverages they had consumed over the past 24 hr. Each subject’s record was coded and standardized ref- erence tables were used to convert household portions to gram weights. The nutrient analysis of the records was quantified using a computer aided nutritional analysis program (CAN, Korean Nutrition Society, Seoul, Korea) (19). Individual ener-
gy deficits were based on the estimated energy requirements calculated from a basal metabolic rate multiplied by a physical activity level (20). The basal metabolic rate was assessed by the Benedict-Harris equation. A well-trained dietitian instruct- ed the daily energy prescriptions for weight reduction.
Diet regimen used in this study was a balanced diet no less than 1,000 kcal/day composed of carbohydrate 60% of total energy intake with the fat level below 30% of calories. Restric- tion of alcohol consumption either by reducing the frequency or the amount of alcohol beverage was strongly recommended to all subjects. However, the subjects were free to select the type of the foods and beverages, and to keep the food diaries recorded three times per week during the 12-week study peri- od. The dietitians interviewed the subjects at regular basis, once a month, and reevaluated their total intake of energy and nutri- ents from food diaries. They monitored to ensure each patient to follow diet habit according to recommended proper nutri- tion for such subject.
The physical activity level of all subjects was assessed using a questionnaires categorized into one of the following groups of physical activity level: inactive, mildly active daily life (no outside exercise), moderately active daily life (formal exercise less than 3 times/week), and severely active daily life (formal exercise more than 3 times/week). Most of the subjects were categorized in inactive or mildly active. Based on initial phys- ical activity level, the subjects were also encouraged to increased levels of daily exercise and to reduce the amount of time spent in a sedentary life style.
The initial duration of exercise was about 30 min, but was progressed to a maximum of 60 min according to individual capabilities. The exercise intensity was increased from 50%
to 85% of the maximum heart rate. The mode of exercise was determined by the subjects and varied from walking, cycling, swimming, stationary cycling, or walking on a motorized tread- mill under unrestricted living condition. Throughout the study, the interviewer monitored the compliance for exercise using a diary and reevaluated physical activity level.
The subjects were prescribed with adjuvant appetite sup- pressant for weight reduction, because they usually failed wei- ght control with life style modification alone. Selective sero- tonin reuptake inhibitor (fluoxetine 40 mg) was prescribed during the 12-week weight reduction program. The subjects finished the 12-week weight reduction program and follow- up reassessment were taken including anthropometric mea- surements, abdominal fat CT scan, and metabolic variables.
Statistical analyses
The results are presented as mean±SD. The changes of anthropometric measurements, abdominal fat distribution, and metabolic variables before and after the weight reduction program in the subjects were tested by the paired t-test. The changes of all variables between the patients with or without the metabolic syndrome were compared by the Student t-test.
The stepwise multiple regression analysis was used to inves- tigate the predictable variables for the improvement of metabol- ic variables. All analyses were two-tailed and a p-value <0.05 was considered statistically significant. The statistical analyses were performed using SAS 6.12 for Windows (SAS institute Inc. Cary, NC, U.S.A.).
RESULTS
Effect of weight reduction on anthropometric variables and abdominal fat distribution
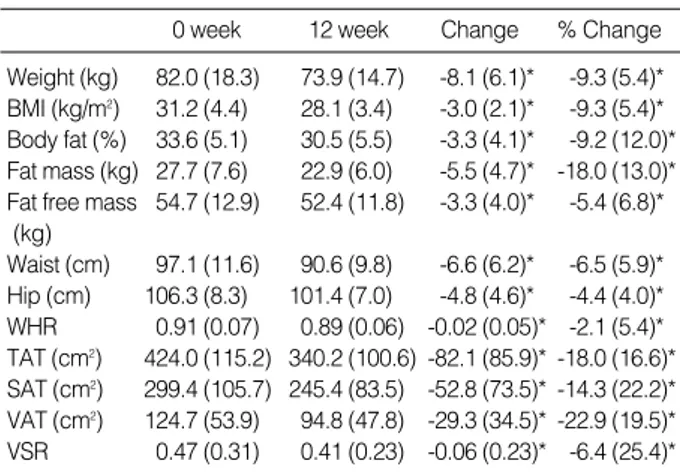
Table 1 shows the changes and the percent changes of the anthropometric variables and abdominal fat distribution after 12 weeks of weight reduction program in the study subjects.
When compared to the basal state, body weight, BMI, body fat, fat mass, and fat free mass were significantly reduced (p<
0.05). With regards to abdominal fat distribution, waist cir- cumference, hip circumference, WHR, TAT, SAT, VAT, and VSR were significantly reduced (p<0.05) as well.
Effect of weight reduction on metabolic variables
The absolute mean and percent reductions in the variables of the metabolic syndrome or insulin resistance from baseline to 12 week of weight reduction are summarized in Table 2.
Systolic and diastolic blood pressure, triglyceride, total choles- terol, LDL-cholesterol, uric acid, fasting insulin, and HOMA scores were significantly reduced (p<0.05). However, the fast- ing blood glucose and HDL-cholesterol were not significantly changed after 12 weeks of intervention compared to the base- line measurements of the study subjects.
Values are expressed as mean (SD). *p<0.05 by paired t-test.
BMI, body mass index; WHR, waist hip ratio; TAT, total adipose tissue;
SAT, subcutaneous adipose tissue; VAT, visceral adipose tissue; VSR, visceral subcutaneous fat ratio.
0 week 12 week Change % Change
Weight (kg) 82.0 (18.3) 73.9 (14.7) -8.1 (6.1)* -9.3 (5.4)*
BMI (kg/m2) 31.2 (4.4) 28.1 (3.4) -3.0 (2.1)* -9.3 (5.4)*
Body fat (%) 33.6 (5.1) 30.5 (5.5) -3.3 (4.1)* -9.2 (12.0)*
Fat mass (kg) 27.7 (7.6) 22.9 (6.0) -5.5 (4.7)* -18.0 (13.0)*
Fat free mass 54.7 (12.9) 52.4 (11.8) -3.3 (4.0)* -5.4 (6.8)*
(kg)
Waist (cm) 97.1 (11.6) 90.6 (9.8) -6.6 (6.2)* -6.5 (5.9)*
Hip (cm) 106.3 (8.3) 101.4 (7.0) -4.8 (4.6)* -4.4 (4.0)*
WHR 0.91 (0.07) 0.89 (0.06) -0.02 (0.05)* -2.1 (5.4)*
TAT (cm2) 424.0 (115.2) 340.2 (100.6) -82.1 (85.9)* -18.0 (16.6)*
SAT (cm2) 299.4 (105.7) 245.4 (83.5) -52.8 (73.5)* -14.3 (22.2)*
VAT (cm2) 124.7 (53.9) 94.8 (47.8) -29.3 (34.5)* -22.9 (19.5)*
VSR 0.47 (0.31) 0.41 (0.23) -0.06 (0.23)* -6.4 (25.4)*
Table 1.Changes of anthropometric variables and abdominal fat distribution after 12 weeks weight reduction program in 78 obese subjects
Comparison the effect of weight reduction on anthropo- metric variables and fat distribution between the subjects with or without metabolic syndrome
Table 3 shows the baseline and changes of anthropometric variables and abdominal fat distribution after 12 weeks of wei- ght reduction program in the subjects with or without meta- bolic syndrome. The age, baseline anthropometric variables,
and abdominal fat distribution were not significantly differ- ent between two groups. Also, the changes of weight, BMI, waist circumference, TAT, SAT, VAT, and VSR were not sig- nificantly different between these groups. However, individ-
Values are expressed as means (SD). *p<0.05 paired t-test.
SBP, systolic blood pressure; DBP, diastolic blood pressure; FBG, fast- ing blood glucose; TG, triglyceride; HDL-C, HDL-cholesterol; TC, total cholesterol; LDL-C, LDL-cholesterol; HOMA, homeostasis model assess- ment.
0 week 12 week Change % Change
SBP (mmHg) 130.7 (14.3) 121.0 (13.1) -9.8 (15.9)* -6.7 (12.3)*
DBP (mmHg) 77.0 (11.1) 72.6 (10.8) -4.4 (12.1)* -4.4 (16.0)*
FBG (mg/dL) 98.8 (22.1) 95.8 (16.2) -3.8 (17.1) -2.0 (13.4) TG (mg/dL) 139.8 (105.4) 126.6 (74.3) -14.4 (65.1)* -2.0 (40.3) HDL-C (mg/dL) 48.8 (12.2) 47.5 (11.2) -0.8 (7.0) -0.8 (14.4) TC (mg/dL) 205.8 (38.2) 193.0 (37.6) -13.4 (28.9)* -5.6 (13.9)*
LDL-C (mg/dL) 131.0 (33.7) 122.2 (29.9) -13.8 (27.2)* -8.0 (20.3)*
Uric acid (mg/dL) 5.5 (1.8) 5.1 (1.6) -0.6 (0.8)* -9.1 (14.0)*
Insulin ( IU /mL) 12.0 (8.6) 8.5 (6.0) -3.1 (4.8)* -20.0 (40.5)*
HOMA score 2.68 (1.89) 1.87 (1.43) -0.81 (1.16)* -21.6 (43.4)*
Table 2.Changes of metabolic variables after 12 weeks weight reduction program in 78 obese subjects
Values are expressed as means (SD). *p<0.05 by Student t-test.
BMI, body mass index; TAT, total adipose tissue; SAT, subcutaneous adipose tissue; VAT, visceral adipose tissue; VSR, visceral subcutaneous fat ratio.
With metabolic syndrome (n=33)
Without metabolic syndrome (n=45) Sex (M/F) 8/25 11/34 Baseline anthropometric variables and fat distribution
Age (yr) 38.3 (13.4) 36.5 (14.2)
Weight (kg) 84.2 (19.1) 80.4 (17.7)
BMI (kg/m2) 31.8 (4.5) 30.7 (4.3)
Body fat (%) 33.5 (5.1) 33.7 (5.2)
Waist (cm) 99.9 (10.7) 95.0 (11.8)
TAT (cm2) 439.9 (96.5) 412.2 (127.1)
SAT (cm2) 309.3 (101.4) 292.0 (109.4)
VAT (cm2) 130.6 (49.9) 120.3 (56.9)
VSR 0.50 (0.37) 0.45 (0.26)
Change of anthropometric variables and fat distribution
△Weight (kg) -8.9 (7.0) -7.5 (5.4)
△BMI (kg/m2) -3.3 (2.3) -2.8 (1.8)
△Body fat (%)* -4.5 (3.8) -2.3 (4.1)
△Waist (cm) -7.2 (7.1) -6.0 (5.5)
△TAT (cm2) -92.0 (92.9) -74.7 (80.7)
△SAT (cm2) -59.8 (85.1) -47.6 (64.0)
△VAT (cm2) -32.2 (39.0) -27.1 (30.9)
△VSR -0.09 (0.31) -0.04 (0.13)
Table 3.Comparison of the change of anthropometric variables and fat distribution in the subjects with or without metabolic syn- drome after 12 weeks weight reduction program
Values are expressed as means (SD). *p<0.05 by Student t-test.
SBP, systolic blood pressure; DBP, diastolic blood pressure; FBG, fast- ing blood glucose; TG, triglyceride; HDL-C, HDL-cholesterol; TC, total cholesterol; LDL-C, LDL-cholesterol; HOMA, homeostasis model assess- ment.
With metabolic syndrome (n=33)
Without metabolic syndrome (n=45) Sex (M/F) 8/25 11/34 Baseline metabolic variables
SBP (mmHg)* 138.4 (11.7) 125.1 (13.4)
DBP (mmHg)* 81.3 (11.6) 73.8 (9.6)
FBG (mg/dL)* 106.6 (29.6) 92.3 (9.2)
TG (mg/dL)* 185.7 (140.0) 102.4 (36.7)
HDL-C (mg/dL)* 42.6 (9.1) 53.7 (12.3)
TC (mg/dL) 208.3 (40.3) 203.7 (36.8)
LDL-C (mg/dL) 133.5 (36.2) 129.3 (32.1)
Uric acid (mg/dL) 5.9 (1.8) 5.2 (1.7)
Insulin ( IU /mL) 13.3 (8.8) 10.7 (8.3)
HOMA score 3.14 (1.82) 2.24 (1.87)
Change of metabolic variables
△SBP (mmHg)* -13.6 (15.5) -6.9 (15.7)
△DBP (mmHg)* -7.6 (12.6) -1.9 (11.2)
△FBG (mg/dL)* -9.6 (19.5) +1.2 (13.0)
△TG (mg/dL)* -29.7 (81.3) +0.03 (41.7)
△HDL-C (mg/dL) -0.3 (6.6) -1.3 (7.4)
△TC (mg/dL) -18.9 (33.7) -8.8 (23.6)
△LDL-C (mg/dL) -16.6 (33.5) -11.5 (21.1)
△Uric acid (mg/dL) -0.61 (0.93) -0.62 (0.70)
△Insulin ( IU /mL)* -4.2 (4.6) -1.7 (4.7)
△HOMA score* -1.19 (1.12) -0.35 (1.05)
Table 4.Comparison of the change of metabolic variables in the subjects with or without metabolic syndrome after 12 weeks wei- ght reduction program
SBP, systolic blood pressure; DBP, diastolic blood pressure; FBG, fast- ing blood glucose; TG, triglyceride; HDL-C, HDL-cholesterol; HOMA, homeostasis model assessment; VSR, visceral subcutaneous fat ratio;
VAT, visceral adipose tissue; SAT, subcutaneous adipose tissue.
Dependent variable Independent
variable R2(%) p-value
△SBP (mmHg) None
△DBP (mmHg) None
△FBG (mg/dL) △VSR 27.5 35.2 0.0001
△TG (mg/dL) △VSR 33.9 86.1 <0.0001
△VAT 4.7 0.36 0.0677
△HDL-C (mg/dL) None
△Insulin ( IU /mL) △Waist 14.4 0.30 0.0224
△HOMA score △Waist 18.7 0.11 0.0095
△SAT 7.3 -0.01 0.0854
Table 5.Relationship between the change of metabolic com- ponents of metabolic syndrome or insulin resistance and the change of anthropometic measurements or fat distribution after 12 weeks weight reduction program
uals with the metabolic syndrome significantly lost more body fat than those without the metabolic syndrome (p<0.05).
Comparison the effect of weight reduction on metabolic variables between the subjects with or without metabolic syndrome
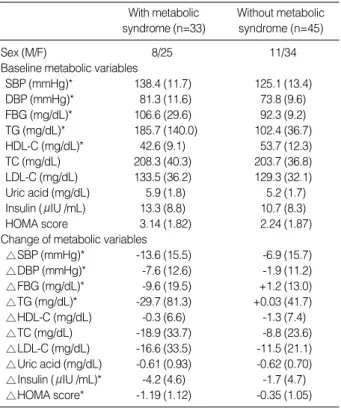
Table 4 shows baseline metabolic variables and changes of metabolic variables after 12 weeks of weight reduction pro- gram in the subjects with or without metabolic syndrome.
There were significant differences in systolic and diastolic blood pressure, fasting blood glucose, triglyceride, and HDL-choles- terol between individuals with metabolic syndrome and those without the metabolic syndrome (p<0.05). Individuals with the metabolic syndrome showed significantly greater reduc- tions in systolic and diastolic blood pressure, fasting blood glucose, triglyceride, fasting insulin and HOMA score com- pared to those without the metabolic syndrome (p<0.05).
Predictable variables for the change of metabolic compo- nents of metabolic syndrome or insulin resistance
Table 5 indicates the results of stepwise multiple regression analysis for the independent relationship between the change of metabolic components of metabolic syndrome or insulin resistance and the change of anthropometric measurements or fat distribution. The change of VSR predicted significantly the change of fasting blood glucose and triglyceride with 27.5%
and 33.9% of R2, respectively (p<0.05). The change of fast- ing insulin and HOMA score were independently related with the change of waist circumference (p<0.05).
Change of the frequency of each or clustering of metabolic component of metabolic syndrome
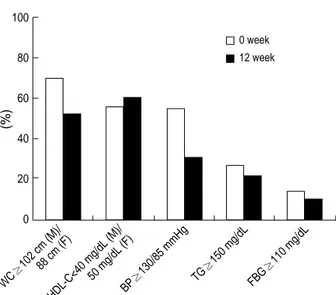
In overall, there was a reduction in the number of individ- uals who met the criteria for the metabolic syndrome after weight reduction compared with baseline. The frequency of each metabolic component of metabolic syndrome from base- line to 12 week of weight reduction were changed as follow- ing; abdominal obesity (70.5% to 52.6%), high blood pres- sure (55.1% to 30.8%), high fasting blood glucose (14.1%
to 10.3%), hypertriglyceridemia (26.9% to 21.8%), and low HDL-cholesterol (56.4% to 60.3%). The frequency of clus- tering of metabolic component of metabolic syndrome from baseline after 12 weeks of weight reduction were changed as following; one or more (89.5% to 82.1%), two or more (79.5%
to 65.4%), three or more (42.3% to 25.6%), and four or more (11.5% to 2.6%). The changes of frequency of the metabolic variables were depicted in Fig. 1 and 2.
DISCUSSION
The NCEP ATP III has identified the metabolic syndrome as a secondary target of therapy, beyond lowering cholesterol (1). A recent prospective principal component analysis showed that BMI was the central feature of the metabolic syndrome over time (10). The BMI increment was also identified as an independent modifiable risk factor of the metabolic syndrome in Koreans despite a lower prevalence of obesity (12). Weight
(%)
100
80
60
40
20
0
WC
≥102 cm (M)/88 cm (F)
HDL-C<40 mg/dL (M)/
50 mg/dL (F)
BP≥130/85 mmHg TG≥150 mg/dL FBG
≥110 mg/dL 0 week 12 week
Fig. 1.Frequency of each components of the metabolic syndrome between 0 and 12 week after weight reduction program in the study subjects. WC, waist circumference; HDL-C, HDL-cholesterol; BP, blood pressure; TG, triglyceride; FBG, fasting blood glucose.
The frequency of each component of metabolic syndrome from baseline to 12 week of weight reduction were changed as follow- ing; abdominal obesity (70.5% to 52.6%), low HDL-cholesterol (56.4% to 60.3%), high blood pressure (55.1% to 30.8%), hyper- triglyceridemia (26.9% to 21.8%), and high fasting blood glucose (14.1% to 10.3%).
(%)
100
80
60
40
20
0 RF≥1 RF≥2 RF≥3 RF≥4
0 week 12 week
Fig. 2.Frequency of clustering of metabolic component of the me- tabolic syndrome between 0 and 12 week after weight reduction program in the study subjects. RF, risk factor.
The frequency of clustering of metabolic component of metabol- ic syndrome from baseline to 12 week of weight reduction were changed as following; one or more (89.5% to 82.1%), two or more (79.5% to 65.4%), three or more (42.3% to 25.6%), and four or more (11.5% to 2.6%).
reduction may play an essential role in preventing and man- aging such metabolic syndrome. The recent Finnish Diabetes Prevention Trial (21) and the Diabetes Prevention Program (DPP) (22) have demonstrated the efficacy of even modest weight reduction, produced by modest changes in diet and physical activity, in preventing diabetes in overweight patients with impaired glucose tolerance.
Our study results indicate that average 8.1 kg weight reduc- tion induced 18.0% loss of total body fat mass and 5.4% loss of fat free mass with 6.6 cm reduction in waist circumference accompanied by 22.9% of visceral fat loss and 14.3% of sub- cutaneous fat loss. These finding are comparable with other reports on weight reduction from different countries (23, 24).
Above findings also indicate that visceral fat responds more promptly to weight reduction than subcutaneous fat. That is agreeable with other study results that visceral adipose tissue was more metabolically active and lipolytic than subcutaneous adipose tissue (25). Moreover, this study shows that moderate weight reduction (9.3% of initial body weight) would result in substantial reductions of metabolic risk factors related to the metabolic syndrome or insulin resistance. Among vari- ous metabolic variables studied, fasting insulin and HOMA score that serve as surrogate markers of insulin resistance, re- sponded more sensitively to weight reduction than any other metabolic variables.
It is observed in this study that obese patients with metabol- ic syndrome lose, at similar degrees, total heaviness (weight and BMI), and fat distribution (TAT, SAT, VAT, VSR, and waist circumference) as individuals without metabolic syn- drome. Thus, it indicates that the prognosis of obese patients even with metabolic syndrome might not be that poor if these patients try hard to lose weight. If we apply the criteria for abdominal obesity as waist circumference above 90 cm in men and 80 cm in women suggested by Asia-Pacific guidelines (26), same results were obtained.
While the differences of the changes of metabolic variables between the participants with or without metabolic syndrome were compared, the systolic and diastolic blood pressure, fast- ing glucose, triglyceride, fasting insulin, and HOMA score were significantly reduced more in the individuals with me- tabolic syndrome compared to those without it. This result indicates that there are greater metabolic benefits among the individuals with metabolic syndrome despite similar degree of weight reduction. This finding is in concordant with pre- vious studies wherein the effectiveness of weight reduction as a therapeutic strategy was particularly useful for individ- uals with abnormal levels of metabolic risk factors (27, 28).
Other studies have also shown that weight reduction improves insulin resistance (29, 30) and individuals with insulin resis- tance can lose weight as effectively as insulin sensitive indi- viduals (31).
With regards to the predictive variables for the improvement of metabolic components, the reductions of visceral-subcuta- neous fat ratio (VSR) was found to be the independent pre-
dictable variable for the improvement of fasting blood glucose and triglyceride, and the change of waist circumference was significantly related with the improvement of fasting insulin and HOMA score. This would mean that the reduction of abdominal fat distribution plays an important role in improv- ing metabolic component and insulin resistance independent of the change of weight or BMI.
After weight reduction in obese patients, the frequency of each or clustering of metabolic risk factors was significantly decreased. Compared to start of intervention of this program, the frequency of metabolic syndrome was decreased from 42.3% to 25.6% (40% reduction) after weight reduction.
Such findings bring to attention that, despite the persistence of obesity even after weight reduction, even modest weight reduction can result in clinically and statistically significant improvement of metabolic syndrome. If we apply the crite- ria of metabolic syndrome set by WHO (32), the frequency of metabolic syndrome would be lower than that would have been assessed by NCEP ATP III.
The limitations of this study are not generalizing to the nor- mal weight population and not having been able to observe the effect of weight reduction on metabolic syndrome in par- ticipants according to the compliance of weight reduction pro- gram.
In conclusion, a moderate weight reduction was associated with substantial reduction in metabolic risk factors of metabol- ic syndrome or insulin resistance in obese patients that appeared to be partially mediated by the corresponding reductions in abdominal fat distribution. The benefit of weight reduction was found to be greater among individuals with the metabol- ic syndrome than in those without the metabolic syndrome.
Future clinical research studies are needed to develop ideal methods to maintain these benefits of weight reduction in patients with the metabolic syndrome.
REFERENCES
1. NHLBI. Executive Summary of The Third Report of The National Cholesterol Education Program (NCEP) Expert Panel on Detection, Evaluation, And Treatment of High Blood Cholesterol In Adults (Adult Treatment Panel III). JAMA 2001; 285: 2486-97.
2. Lakka HM, Laaksonen DE, Lakka TA, Niskanen LK, Kumpusalo E, Tuomilehto J, Salonen JT. The metabolic syndrome and total and car- diovascular disease mortality in middle-aged men. JAMA 2002; 288:
2709-16.
3. Isomaa B, Almgren P, Tuomi T, Forsen B, Lahti K, Nissen M, Task- inen MR, Groop L. Cardiovascular morbidity and mortality associat- ed with the metabolic syndrome. Diabetes Care 2001; 24: 683-9.
4. Hauner H. Insulin resistance and the metabolic syndrome: a challenge of the new millennium. Eur J Clin Nutr 2002; 56 (Suppl 1): S25-9.
5. Hjermann I. The metabolic cardiovascular syndrome: syndrome X, Reaven’s syndrome, insulin resistance syndrome, atherothrombogenic syndrome. J Cardiovasc Pharmacol 1992; 20 (Suppl 8): S5-10.
6. Ohlson LO, Larsson B, Svardsudd K, Welin L, Eriksson H, Wilhelm- sen L, Bjorntorp P, Tibblin G. The influence of body fat distribution on the incidence of diabetes mellitus. 13.5 years of follow-up of the par- ticipants in the study of men born in 1913. Diabetes 1985; 34: 1055-8.
7. Masuda T, Imai K, Komiya S. Relationship of anthropometric indices of body fat to cardiovascular risk in Japanese women. Ann Physiol Anthropol 1993; 12: 135-44.
8. McKeigue PM, Shah B, Marmot MG. Relation of central obesity and insulin resistance with high diabetes prevalence and cardiovascular risk in South Asians. Lancet 1991; 337: 382-6.
9. Han TS, van Leer EM, Seidell JC, Lean ME. Waist circumference action levels in the identification of cardiovascular risk factors: preva- lence study in a random sample. BMJ 1995; 311: 1401-5.
10. Maison P, Byrne CD, Hales CN, Day NE, Wareham NJ. Do different dimensions of the metabolic syndrome change together over time?
Evidence supporting obesity as the central feature. Diabetes Care 2001;
24: 1758-63.
11. Korea National Statistical Office. 2000 Report of Statistics in Mortali- ty in Korean 2001.
12. Park HS. Epidemiology of metabolic syndrome among South Koreans.
Korean J Obes 2002; 11: 203-11.
13. Cha K, Chertow GM, Gonzalez J, Lazarus JM, Wilmore DW. Mul- tifrequency bioelectrical impedance estimates the distribution of body water. J Appl Physiol 1995; 79: 1316-9.
14. Ferland M, Despres JP, Tremblay A, Pinault S, Nadeau A, Moorjani S, Lupien PJ, Theriault G, Bouchard C. Assessment of adipose tissue distribution by computed axial tomography in obese women: associ- ation with body density and anthropometric measurements. Br J Nutr 1989; 61: 139-48.
15. Sjostrom L, Kvist H, Cederblad A, Tylen U. Determination of total adipose tissue and body fat in women by computed tomography, 40K, and tritium. Am J Physiol 1986; 250: E736-45.
16. American Society of Hypertension. Recommendations for routine blood pressure measurement by indirect cuff sphygmomanometry.
Am J Hypertens 1992; 5: 207-9.
17. Friedewald WT, Levy RI, Fredrickson DS. Estimation of the concen- tration of low-density lipoprotein cholesterol in plasma, without use of the preparative ultracentrifuge. Clin Chem 1972; 18: 499-502.
18. Matthews DR, Hosker JP, Rudenski AS, Naylor BA, Treacher DF, Turner RC. Homeostasis model assessment: insulin resistance and beta-cell function from fasting plasma glucose and insulin concentra- tions in man. Diabetologia 1985; 28: 412-9.
19. Korean Nutrition Society. Computerized Aided Nutritional analysis program 1998.
20. Ainsworth BE, Haskell WL, Leon AS, Jacobs DR Jr, Montoye HJ, Sallis JF, Paffenbarger RS Jr. Compendium of physical activities:
classification of energy costs of human physical activities. Med Sci
Sports Exerc 1993; 25: 71-80.
21. Tuomilehto J, Lindstrom J, Eriksson JG, Valle TT, Hamalainen H, Ilanne-Parikka P, Keinanen-Kiukaanniemi S, Laakso M, Louheranta A, Rastas M, Salminen V, Uusitupa M, Finnish Diabetes Prevention Study Group. Prevention of type 2 diabetes mellitus by changes in lifestyle among subjects with impaired glucose tolerance. N Engl J Med 2001; 344: 1343-50.
22. Knowler WC, Barrett-Connor E, Fowler SE, Hamman RF, Lachin JM, Walker EA, Nathan DM, Diabetes Prevention Program Research Group. Reduction in the incidence of type 2 diabetes with lifestyle in- tervention or metformin. N Engl J Med 2002; 346: 393- 403.
23. Fujioka S, Matsuzawa Y, Tokunaga K, Kawamoto T, Kobatake T, Keno Y, Kotani K, Yoshida S, Tarui S. Improvement of glucose and lipid metabolism associated with selective reduction of intra-abdom- inal visceral fat in premenopausal women with visceral fat obesity.
Int J Obes 1991; 15: 853-9.
24. Zamboni M, Armellini F, Turcato E, Todesco T, Bissoli L, Bergamo- Andreis IA, Bosello O. Effect of weight loss on regional body fat dis- tribution in premenopausal women. Am J Clin Nutr 1993; 58: 29-34.
25. Arner P. Differences in lipolysis between human subcutaneous and omental adipose tissues. Ann Med 1995; 27: 435-8.
26. International Obesity Task Force. Asia-Pacific perspective: redefining obesity and its treatment. Western Pacific Region. Sydney 2000.
27. Janssen I, Fortier A, Hudson R, Ross R. Effects of an energy-restric- tive diet with or without exercise on abdominal fat, intermuscular fat, and metabolic risk factors in obese women. Diabetes Care 2002; 25:
431-8.
28. Wing RR, Jeffery RW. Effect of modest weight loss on changes in cardiovascular risk factors: are there differences between men and women or between weight loss and maintenance? Int J Obes Relat Metab Disord 1995; 19: 67-73.
29. Dengel DR, Galecki AT, Hagberg JM, Pratley RE. The independent and combined effects of weight loss and aerobic exercise on blood pres- sure and oral glucose tolerance in older men. Am J Hypertens 1998;
11: 1405-12.
30. Su HY, Sheu WH, Chin HM, Jeng CY, Chen YD, Reaven GM. Effect of weight loss on blood pressure and insulin resistance in normoten- sive and hypertensive obese individuals. Am J Hypertens 1995; 8: 1067- 71.
31. McLaughlin T, Abbasi F, Carantoni M, Schaaf P, Reaven G. Differ- ences in insulin resistance do not predict weight loss in response to hypocaloric diets in healthy obese women. J Clin Endocrinol Metab 1999; 84: 578-81.
32. Alberti KG, Zimmet PZ. Definition, diagnosis and classification of diabetes mellitus and its complications. Part 1: diagnosis and clas- sification of diabetes mellitus provisional report of a WHO consul- tation. Diabet Med 1998; 15: 539-53.