Household and Housing Characteristics of Young Renters in South Korea in Relation to Housing Value Clusters
한국 청년 임차가구의 주거관 군집에 따른 가구 및 주거 특성
권현주* 이현정**
Kwon, Hyun Joo Lee, Hyun-Jeong
Abstract
The purpose of this study was to explore housing value clusters of young renters in South Korea and their relationships to household and housing characteristics reflected in the 2012 Korea Housing Survey (KHS). The 2012 KHS microdata was used as secondary data. Among the households included in the microdata, 1,196,144 young renter households (between 20 and 34 years of age) in private rental units were analyzed. The main findings are as follows. Ten rating scale items measured housing values. Eight of them were grouped into three value factors: Investment, Affordability and Cost Increase. Using these three value factors and perception of homeownership, households were classified into four clusters: Prospective Home Investor, Settled Renter, Homeowner Wannabe, and Support Needed. The current tenure types, income and expectation for next tenure types of four housing value clusters of young renters reflected Korea’s tenure ladder which has home ownership at top followed by Jeon-se rental, monthly rental with deposit and monthly rental without deposit. The households in Prospective Home Investor and Homeowner Wannabe clusters would consider home purchase in the near future. Finally, households in Support Needed Cluster would be the main target to consider in development and implementation of housing welfare policies and programs to resolve housing problems of young renters, including beginning-stage professionals.
Keywords : Housing Values, Young Renters, Cluster Analysis, Factor Analysis, 2012 Korea Housing Survey 주 요 어 : 주거관, 청년 임차자, 군집분석, 요인분석, 2012년도 주거실태조사
I. Introduction
Housing value is a popular research topic in housing studies. In developing residential properties, it is important to reflect the needs and preferences of prospective residents.
Considering the longer life expectancy of recently built residential structures and more frequent resident turnover, it is very difficult to predict the needs and preferences of all residents that the building will serve (Lee, 2013). Instead, many researchers and housing developers have explored the values, thoughts and preferences of certain populations in order to obtain ideas for residential development in the near future (An, Kang, & Jo, 2009).
Young people such as college students are considered emerging housing consumers whose thoughts and preferences for housing are distinctive from those of older people. It is therefore important to understand young people’s housing values and preferences in order to design residential properties that will meet their expectations.
This study explored the housing value clusters of young renters in South Korea and their relationships to household and housing characteristics reflected in the 2012 Korea Housing Survey (KHS) using its microdata.
II. Literature Review
1. Housing values studies of young persons
Housing values could be defined as the thoughts and opinions about residential environments and how to live in them (Lee, 2013). Diverse determinants of housing values examined in previous housing studies include socioeconomic characteristics such as gender, age, educational attainment, economic status, lifestyle (Jung & An, 2001; Lee, 2013), and sociocultural background such as nationality (Jung & An, 2001; An, Jo, & Hao, 2009; Woo et al., 2012).
**Assistant Professor, Department of Art and Design, Purdue University, USA
**Associate Professor, Department of Housing and Interior Design, Chungbuk National University, Korea
Corresponding Author: Hyun-Jeong Lee, Department of Housing and Interior Design, Chungbuk National University, 1 Choongdae- ro, Seowon-gu, Cheongju, 28644, Korea. E-mail: [email protected] This manuscript was based on the paper presented at the 2015 Conference of Asia-Pacific Network for Housing Research.
College students are the subjects of most housing value studies of young persons (Yoon & Shin, 1997; Jung & An, 2001; Lim, 2005; Kim & Kwark, 2007; Kim & Noh, 2008;
An, Jo, & Hao, 2009; An, Kang, & Jo, 2009; Bang & Hong, 2012; Woo et al., 2012; Lee, 2013) because they are considered representative of emerging young housing consumers. It was difficult to find research studies of young renters’ housing values regardless of their educational attainments or housing values.
Based on the housing value items in the 2012 KHS, housing values in this study are defined as thoughts and opinions of housing choices, options and the housing market situation.
2. 2012 Korea housing survey
This study utilized microdata of the 2012 KHS, the most recently released microdata of a national survey on housing.
The 2012 KHS includes responses from total 33,000 general households
1)sampled through a stratified sampling procedure.
When official weights were applied, there were 17,733,831 general households.
The 2012 KHS includes comprehensive information on current and previous structure and tenure types; housing costs and housing cost burdens; moving experiences; housing satisfaction; housing values; home purchase experience; future housing plans; and household information (Ministry of Land, Transport and Maritime Affairs, 2012).
Among the studies that utilized 2012 KHS microdata, Lee (2014) analyzed housing costs and housing cost burdens in the Seoul capital region of renter households headed by college graduates in their 20s. The study concluded that 64 percent of college graduate renters had to pay 30 percent or more of their household income for housing.
Lee (2015) compared housing quality and housing cost burdens of renters households headed by young persons between age 20 and 34 years by residential location and income. Lee insisted that young renters in the Seoul capital regions had worse housing conditions and heavier housing cost burdens than did young renters elsewhere.
Lee and Choi (2015) explored the housing challenges of very low-income households that were in bottom 20 percent of the income rank order among the households responding to the 2012 KHS. According to the results, Lee and Choi concluded that a large proportion of these households were suffering from a range of housing problems including undesirable tenure status, housing poverty, housing cost
burdens, dependency on external funds to pay housing costs, and dissatisfaction with housing.
3. Cluster analysis
Cluster analysis is a multivariate data analysis technique used to group objects based on their characteristics (Hair et al., 1998). Several housing studies have utilized cluster analysis.
Varady and Lipman (1994) grouped US apartment renters into six lifestyle clusters, utilizing data from the 1991 national survey of renters sponsored by the National Association of REALTORS
®: families moving up the housing ladder; lifestyle renters; recent college graduates; black renters; elderly renters;
and struggling blue-collar workers.
Lee, Goss, and Beamish (2007) conducted a mail survey of residents in high-end apartment communities in Charlotte, North Carolina, United States, and clustered the respondents four lifestyle clusters (Community, Basics, Home, Environment) and in order to explore lifestyle influences on housing preferences.
Lee and Emmel (2009) grouped low-income households in Virginia, United States, into four energy practice clusters based on their perceived energy cost burdens and level of energy saving efforts: Energy-Conscious; Motivated; Achieved; and Help Needed.
Kim and Suh (2013) administered a questionnaire survey to baby boomers in Busan, Korea, and grouped the respondents into four housing preference clusters: Location; Social;
Economic; and Physical.
III. Research Methods
1. Data and study subjects
The 2012 KHS microdata was used as secondary data for this study. The 2012 KHS microdata set was obtained from its official website on September 27, 2014.
When selecting study subjects, it was assumed that renters in public rental housing units have very little chance to incorporate their housing values into their choices for housing.
As this study analyzed the relationships between housing values and housing characteristics of young renters, renters in public housing were excluded from data analysis. In addition, young renters in this study were defined as being between 20 and 34 years of age.
There were 1,026,212 renter households in private housing units headed by persons between 20 and 34 years of age (weighted counts). Among them, 416 households that had missing housing values were excluded from data analysis.
Finally, 1,025,796 young renter households in private housing units were selected as the study subjects.
1) In statistical terminology in Korea, general households include family (related), single-person and unrelated households with five or fewer members.
2. Data analysis
Data were analyzed in three stages. In the first stage, the underlying dimensions of the young renter households’ housing values were defined using factor analysis. In the second stage, the young renter households were grouped by their housing values using cluster analysis. Finally, in the third stage, their household and housing characteristics and future housing plans were compared across the clusters. Detailed data analysis procedures will be explained when reporting the analysis findings.
For the data analysis, statistical techniques including factor analysis, cluster analysis, chi-square test of independence, independent sample t-test and one-way ANOVA were used.
IBM SPSS 21.0 was used for all data analyses.
IV. Findings
1. Overview of respondents
According to the demographic characteristics of householders
<Table 1>, 72.6 percent were male, average age was 29.96 years, and 47.4 percent had at least a college degree. Average household size was 1.99 persons, and 46.0 percent were single-person households. Based on income categories provided in the official final report of the 2012 KHS (MLTM, 2012, p. 47), 43.9 percent were low-income with a monthly income of 2,200,000 Korea Won (KRW) or less; 4,022 of these households reported zero income.
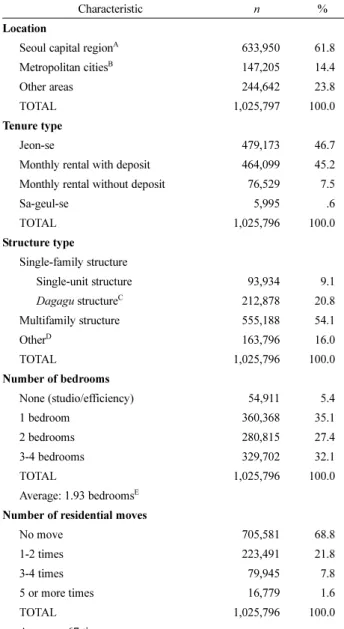
In terms of housing characteristics <Table 2>, 61.8 percent lived in the Seoul Metropolitan Areas. As for rental types, 46.7 percent were Jeon-se renters and 45.2 percent were monthly renters with deposit.
In Korea’s unique housing rental system, a Jeon-se renter pays only deposit to landlord. The landlord keeps the bank interest on the deposit instead of collecting monthly rent and returns the original amount of deposit to the renter when the lease is terminated. A Sa-geul-se renter pays several months or a year’s rent when the lease begins. Both Jeon-se and Sa-geul- se require a lump sum payment. The lump sum a Jeon-se renter pays is a deposit that is returned when the renter when moves out, but pre-paid rent a Sa-geul-se renter pays is kept as a monthly rental fee.
In Korea’s housing tenure ladder, homeownership is considered the ultimate goal. Second to the home purchase is Jeon-se rental as it is easier for the renters to save money for home purchase. Monthly rental with deposit comes next. Monthly rental without deposit or Sa-geul-se are usually associated with poorer housing quality or higher monthly rental fees than Jeon-se or monthly rental with deposit.
Households living in units that have failed to meet national
minimum housing standards or in units in basement, semi- basement or rooftop levels are defined households with housing poverty. There were 12.2 percent of young renter households in housing poverty. More than 46 percent of the young renter households had to pay 30 percent or more of their income for housing. According to the sources of housing costs, 31.4 percent received financial support from family, and 12.1 percent borrowed from financial institution or workplace.
<Table 3> summarizes housing problems and housing cost sources of young renter households.
2. Housing value factors
In the 2012 KHS, 10 items assessed housing values and opinions. The items were given as statements and respondents were asked to rate their degree of agreement to each of the ten
Table 1. Householder and Household CharacteristicsCharacteristic n %
Householder characteristics Gender
Male 744,441 72.6
Female 281,355 27.4
TOTAL 1,025,796 100.0
Age
20-24 years 109,809 10.7
25-29 years 257,364 25.1
30-34 years 658,623 64.2
TOTAL 1,025,796 100.0
Average: 29.96 years Educational attainment
High school diploma or lower 539,558 52.6
College graduate 479,639 46.8
Graduate degree or higher 6,600 .6
TOTAL 1,025,797 100.0
Household characteristics Household size
1 person 471,828 46.0
2 persons 245,401 23.9
3-4 persons 282,753 27.6
5 or more persons 25,815 2.5
TOTAL 1,025,797 100.0
Average: 1.99 persons Household incomeA
Low-income (2.2 million KRW/month or less) 450,552 43.9 Mid-income (4.1 million KRW/month or less) 459,316 44.8 High-income (more than 4.1 million KRW/month) 115,929 11.3
TOTAL 1,025,797 100.0
Average: 2,622,200 KRW/monthB
Note. Weighted counts and valid percentages are presented.
AIncome categories are from official final report of the 2012 Korea Housing Survey (MLTM, 2012, p.47). Low-income households include 4,022 households with zero income.
BAverage excluding households with zero income
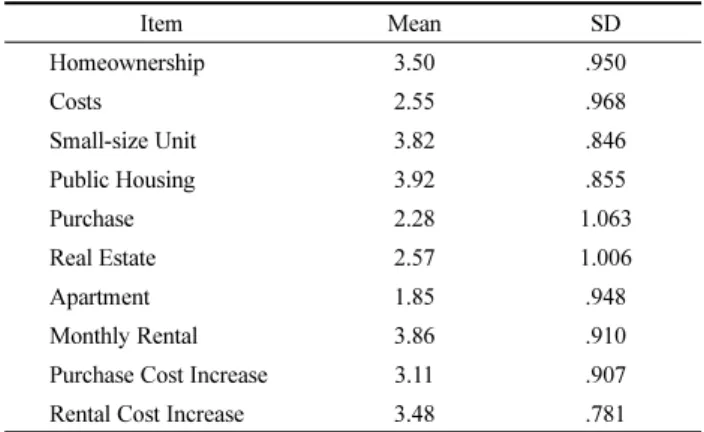
statements on a five-point scale: strongly disagree (1); disagree (2); neutral (3); agree (4); and strongly agree (5). The ten items and abbreviations to be used in further analyses and average scores are presented in <Tables 4, 5>, respectively.
In summary, young renter households tended to show a strong agreement with the needs of more public housing and small-size housing units, preference for a monthly rental over Jeon-se rental, and importance of being a homeowner. At the
same time, they showed the least agreement with statements related to preference of apartment units and their financial ability to purchase a home.
In order to group young renter households based on their housing values, factor analysis was adopted to reduce the number of variables. To explore the underlying dimensions of the young renter households’ housing values, a series of factor
Table 2. Housing CharacteristicsCharacteristic n %
Location
Seoul capital regionA 633,950 61.8
Metropolitan citiesB 147,205 14.4
Other areas 244,642 23.8
TOTAL 1,025,797 100.0
Tenure type
Jeon-se 479,173 46.7
Monthly rental with deposit 464,099 45.2
Monthly rental without deposit 76,529 7.5
Sa-geul-se 5,995 .6
TOTAL 1,025,796 100.0
Structure type
Single-family structure
Single-unit structure 93,934 9.1
Dagagu structureC 212,878 20.8
Multifamily structure 555,188 54.1
OtherD 163,796 16.0
TOTAL 1,025,796 100.0
Number of bedrooms
None (studio/efficiency) 54,911 5.4
1 bedroom 360,368 35.1
2 bedrooms 280,815 27.4
3-4 bedrooms 329,702 32.1
TOTAL 1,025,796 100.0
Average: 1.93 bedroomsE Number of residential moves
No move 705,581 68.8
1-2 times 223,491 21.8
3-4 times 79,945 7.8
5 or more times 16,779 1.6
TOTAL 1,025,796 100.0
Average: .67 times
Note. Weighted counts and valid percentages are presented.
ASeoul, Incheon and Gyeonggi province
BFive metropolitan cities except Incheon: Busan, Daejeon, Daegu, Gwangju and Ulsan.
CUnder Housing Law of Korea, a Dagagu structure is classified as a single-family structure although it contains multiple units in a single structure.
DOther types of structure include units in non-residential buildings and non-housing living quarters.
EWhen calculating average number of bedrooms, the number of bedroom of studio or efficiency was considered one although it did not have any separate bedroom.
Table 3. Housing Problems and Source of Housing Costs
Characteristic n %
Housing problem Housing povertyA
In housing poverty 124,740 12.2
Not in housing poverty 900,484 87.8
TOTAL 1,025,224 100.0
Housing cost burdenB
Burdened 465,407 46.1
Not burdened 543,797 53.9
TOTAL 1,009,204 100.0
Source of housing costs Family supportC
Received 322,349 31.4
Not received 703,448 68.6
TOTAL 1,025,797 100.0
Loan from bank or workplaceD
Borrowed 124,537 12.1
Not borrowed 901,260 87.9
TOTAL 1,025,797 100.0
Note. Weighted counts and valid percentages are presented.
AHouseholds living in basement, semi-basement or rooftop level units; or in sub-standard units failed to meet national minimum housing standards
BHouseholds spending 30 percent or more of their income for housing costs (rental costs plus other housing costs).
CWhether or not received financial support from family or other relatives to afford housing costs
DWhether or not loan from financial institution or workplace used to afford current housing costs
Table 4. Housing Value Items and Abbreviations
Item Abbreviation
One should own a housing unit. Homeownership Current housing costs are appropriate. Costs More small-size housing units should be built. Small-size Unit More public rental housing should be built. Public Housing There are sufficient amount of housing units that
I can purchase with my own finance. Purchase I prefer to make investment on real estate rather
than on financial investment products. Real Estate If possible, I prefer to live in an apartment unit. Apartment If I rent a unit, I prefer monthly rental to Jeon-se
rental. Monthly Rental
Overall housing purchase price will increase over the next 2 or 3 years.
Purchase Cost Increase Overall housing rental costs will increase over the
next 2 or 3 years. Rental Cost Increase
analyses was conducted. After several attempts, it was found that three-factor solutions using Varimax rotation method and a principal component analysis extraction method with eight items excluding Homeownership and Monthly Rental were most appropriate <Table 6>.
Four items loaded on the first factor showed items of aspiration for home purchase, real estate investment, preference for apartment homes, and no housing cost burden. It was interpreted that the items’ underlying dimensions were the financial ability to purchase a housing unit (preferably an apartment) or to invest in residential properties. The first factor was termed Investment. Inter-item reliability (Cronbach’s alpha) of the four items included in the Investment factor was .639. Although the inter-item reliability was not strong enough, it could not be improved by removing any of the items and the contents were considered sound. Thus it was decided to keep the factor with all four of the original items.
Two items loaded on the second factor were assumed to share aspirations for low-cost housing such as small-sized
housing or public housing. Thus the second factor was termed Affordability. Pearson’s correlation coefficient of the two items included in Affordability factor was .598 (p= .000).
Two items loaded on the last factor were found to share housing cost increase; the last factor was termed Cost Increase. Pearson’s correlation coefficient of the two items included in the Cost Increase factor was .522 (p= .000).
3. Housing value clusters
Young renter households were grouped according to their housing values using hierarchical cluster analysis. Regression factor scores of the three housing value factors generated through the factor analysis process, two housing value items that were not included in the final three factors (Homeowner- ship, Monthly Rental) were used as independent variables for the cluster analysis.
After review of several cluster models, a four-cluster model derived using the factors Investment, Affordability, Cost Increase and Homeownership was found to be the best fit for the study.
For cluster analysis, within-groups linkage method with squared Euclidean distance intervals was used, and independent variables were standardized by variable. Monthly Rental item was found not efficient for clustering young renter households and was therefore excluded from the final cluster analysis.
Comparisons of three housing value factors and Home- ownership item across the final four housing value clusters are summarized in <Table 7>. In one-way ANOVA, Leven’s statistics indicated that assumption of homogeneous variances was violated in all four housing value variables. Thus, the Brown-Forsythe method was adopted for the group comparisons.
The first cluster showed the highest or second-highest scores on Investment, Cost Increase and Homeownership but had a low score on Affordability. That is, young renter households grouped into the first cluster showed the strongest tendency to predict housing cost increase in the near future, to consider home purchase (preferably, an apartment home purchase) and investment in residential properties important; and not to consider the extended provision of low-cost housing as important. Households in this cluster might have saved enough money to purchase a home either for residence purpose or as an investment. Thus, the first cluster was named Prospective Home Investor. Households in this cluster comprised 31.9 percent of the total sample.
The second cluster showed the second-highest scores in the factors of Affordability and Cost Increase. However, it showed very low scores in the Homeownership and Investment factors.
In other words, young renter households classified falling into the second cluster seemed to be concerned with rental cost
Table 5. Housing Values of Young Renter Households(n=1,025,796)
Item Mean SD
Homeownership 3.50 .950
Costs 2.55 .968
Small-size Unit 3.82 .846
Public Housing 3.92 .855
Purchase 2.28 1.063
Real Estate 2.57 1.006
Apartment 1.85 .948
Monthly Rental 3.86 .910
Purchase Cost Increase 3.11 .907
Rental Cost Increase 3.48 .781
Note. Strongly disagree (1)~Strongly agree (5). Refer to Table 4 for original statements.
Table 6. Rotated Factor Loadings of Housing Values
Item Component
1 2 3
Purchase .730
Apartment .692
Costs .672
Real Estate .650
Small-size Unit .893
Public Housing .875
Purchase Cost Increase .867
Rental Cost Increase .858
Note. Rotated factor loadings of Varimax rotation method with a principal component analysis extraction method are presented. Refer to Table 4 for original statements.
Kaiser-Meyer-Olkin Measure of Sampling Adequacy (KMO)= .621 Bartlett’s test of Sphericity: χ2 (28)=1,456,182.818, p= .000
burdens or increases and to have low aspiration for home purchase or real estate investment. Thus, the second cluster was named Settled Renter. Households in this cluster comprised 26.7 percent of all study subjects.
The third cluster was characterized by having the highest scores on Affordability Factor and Homeownership item, the second highest score on Investment Factor. This cluster showed the lowest score on Cost Increase Factor. That is, young renter households include in the third cluster seemed to have positive expectation on home purchase, provision of low-cost housing units, and no big increase in housing costs in the near future.
Thus, the third cluster was named Homeowner Wannabe Cluster. Twenty three percent of the study subjects were classified into this cluster.
The last cluster showed the lowest or second lowest score on all four housing value variables. Only with the comparisons of housing value scores, young renter households in this cluster could be either hopeless or indifferent to housing matters. To clarify this cluster’s housing value, income levels
(low-, mid- or high-income) were compared across the four clusters. According to the results, this cluster was found to have the largest proportion of low-income households. Thus, the last cluster was named Support Needed. Households classified into the last cluster comprised 18.4 percent of all study subjects.
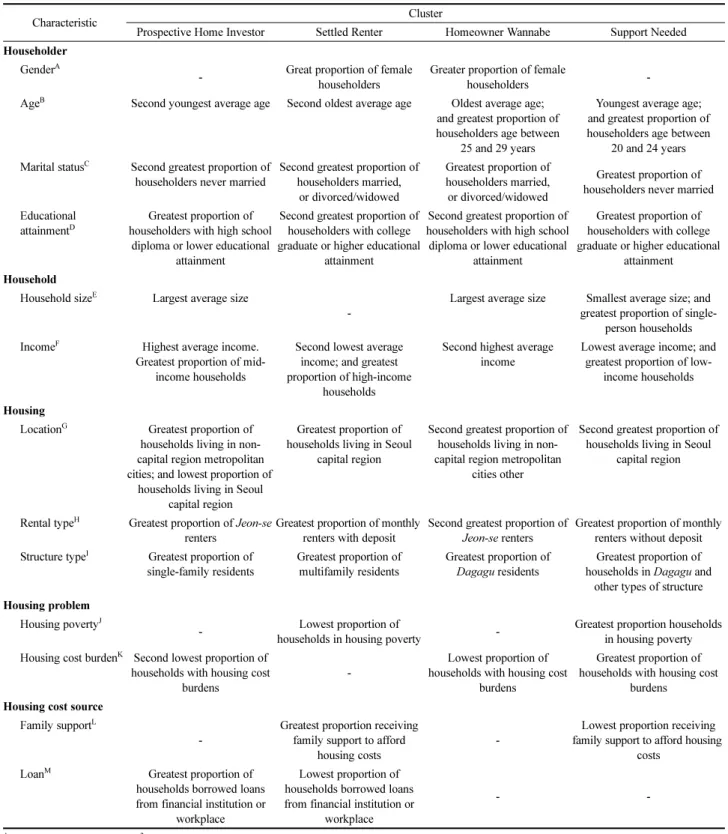
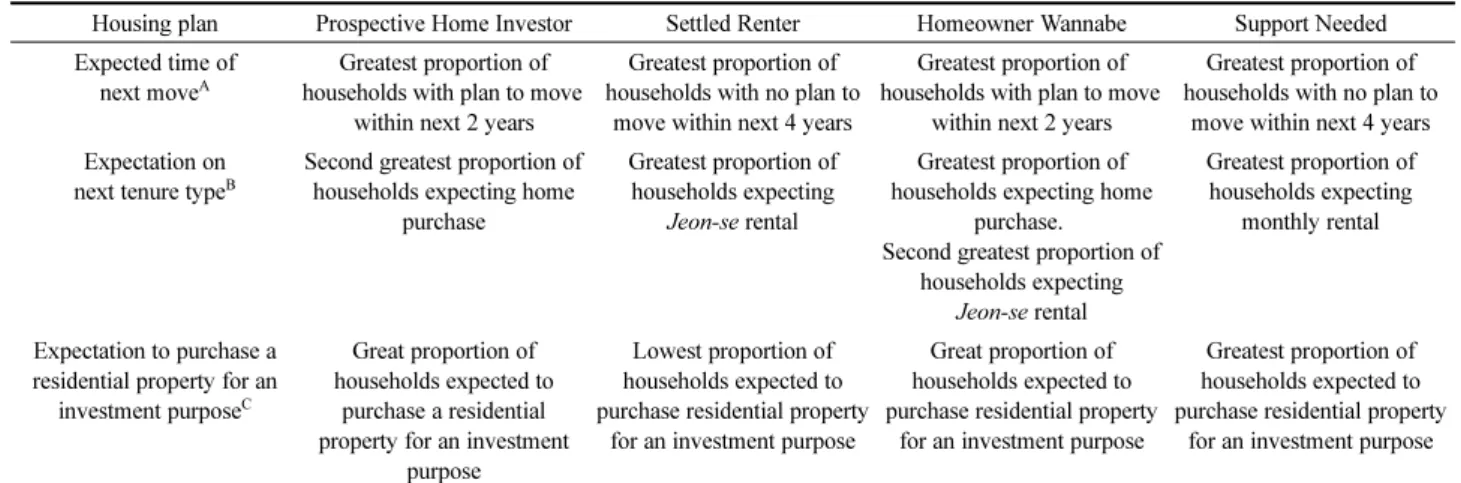
4. Characteristics and next housing plans by housing value cluster
Characteristics of the four housing value clusters were compared using a series of chi-square test of independence and one-way ANOVA. The characteristics compared were householder (gender, income, educational attainment), household (household size, income level), housing (location, rental type, structure type), housing problems (housing poverty, housing cost burden) and source of housing costs (whether or not renters received family support, whether or not they borrowed money from their financial institution or workplace).
In addition, plans for future housing were compared using chi-square tests of independence. Plans for next home included the expected date of next move, tenure type and whether or not a residential unit would be purchased as an investment. Results of the cluster comparisons are depicted in
<Tables 8, 9>.
Young renter households falling into the Prospective Home Investor Cluster had the highest average income and the largest household size. These householders have the least education. They have the highest proportion of Jeon-se renters and households living in non-capital region metropolitan cities. The cluster had the lowest proportion of households with housing cost burdens; but the largest proportion of households took out loans to afford their housing costs. The households in this cluster had great expectation for home purchase within the next two years for either residence or investment, which was consistent with their high scores in Investment and Cost Increase and Homeownership in previous analyses.
Households in the Settled Renter Cluster seemed to have a polarized distribution of household income; they have the lowest average household income but the largest proportion of high-income households. They had the highest proportion of monthly renters with deposit, multifamily housing residents, and households living in Seoul capital region. They had the highest proportion receiving family support for their housing costs. In terms of their next housing plans, they had the highest expectation for Jeon-se rental but the lowest proportion expected to move within four years. They also showed the least expectation to purchase a residential unit for investment.
Householders in Homeowner Wannabe have the oldest
Table 7. Housing Values by ClusterItem n % Mean F
Investment FactorA
Cluster 1 327,015 31.9 .21a
18,041.4***
Cluster 2 273,820 26.7 -.15c Cluster 3 235,944 23.0 .15b Cluster 4 189,017 18.4 -.33d Affordability FactorA
Cluster 1 327,015 31.9 .18 c
227,312.8***
Cluster 2 273,820 26.7 .19 b Cluster 3 235,944 23.0 .55 a Cluster 4 189,017 18.4 -1.28 d Cost Increase FactorA
Cluster 1 327,015 31.9 .90 a
294,530.5***
Cluster 2 273,820 26.7 -.09 b Cluster 3 235,944 23.0 -.88 d Cluster 4 189,017 18.4 -.33 c HomeownershipB
Cluster 1 327,015 31.9 4.00 b
432,405.6***
Cluster 2 273,820 26.7 2.36 d Cluster 3 235,944 23.0 4.13 a Cluster 4 189,017 18.4 3.52 c
Note. As Leven’s statistics indicated that all variables violated homogeneity of variance assumption, means were compared using Brown-Forsythe method. Alphabet subscripts next to means refer to homogeneous subsets by Duncan’s Posthoc tests at p<.05 (a>b>c>d). Percentages out of 1,025,796 subjects of the study are presented.
***p< .001
ARegression factor scores were compared. The greater score is, the greater level of agreement to original item was. Refer to <Table 4> and
<Table 6> for original items included in each factor.
BOriginal statement was “One should own a housing unit” measured in five-point scale ranging from “strongly disagree (1)” to “strongly agree (5).”
Table 8. Comparisons of Housing Value Clusters: Summary
Characteristic Cluster
Prospective Home Investor Settled Renter Homeowner Wannabe Support Needed Householder
GenderA
- Great proportion of female householders
Greater proportion of female
householders -
AgeB Second youngest average age Second oldest average age Oldest average age;
and greatest proportion of householders age between
25 and 29 years
Youngest average age;
and greatest proportion of householders age between
20 and 24 years Marital statusC Second greatest proportion of
householders never married
Second greatest proportion of householders married,
or divorced/widowed
Greatest proportion of householders married,
or divorced/widowed
Greatest proportion of householders never married Educational
attainmentD
Greatest proportion of householders with high school
diploma or lower educational attainment
Second greatest proportion of householders with college graduate or higher educational
attainment
Second greatest proportion of householders with high school diploma or lower educational
attainment
Greatest proportion of householders with college graduate or higher educational
attainment Household
Household sizeE Largest average size
-
Largest average size Smallest average size; and greatest proportion of single-
person households IncomeF Highest average income.
Greatest proportion of mid- income households
Second lowest average income; and greatest proportion of high-income
households
Second highest average income
Lowest average income; and greatest proportion of low-
income households
Housing
LocationG Greatest proportion of households living in non- capital region metropolitan cities; and lowest proportion of
households living in Seoul capital region
Greatest proportion of households living in Seoul
capital region
Second greatest proportion of households living in non- capital region metropolitan
cities other
Second greatest proportion of households living in Seoul
capital region
Rental typeH Greatest proportion of Jeon-se renters
Greatest proportion of monthly renters with deposit
Second greatest proportion of Jeon-se renters
Greatest proportion of monthly renters without deposit Structure typeI Greatest proportion of
single-family residents
Greatest proportion of multifamily residents
Greatest proportion of Dagagu residents
Greatest proportion of households in Dagagu and
other types of structure Housing problem
Housing povertyJ
- Lowest proportion of
households in housing poverty - Greatest proportion households in housing poverty Housing cost burdenK Second lowest proportion of
households with housing cost burdens
-
Lowest proportion of households with housing cost
burdens
Greatest proportion of households with housing cost
burdens Housing cost source
Family supportL
-
Greatest proportion receiving family support to afford
housing costs
-
Lowest proportion receiving family support to afford housing
costs
LoanM Greatest proportion of
households borrowed loans from financial institution or
workplace
Lowest proportion of households borrowed loans from financial institution or
workplace
- -
ACategories: Male, female. χ2 (3)=12,568.853, p= .000
BF=5,691.486, p=.000; Categories: 20-24 years, 25-29 years, 30-34 years. χ2 (6)=30,514.352, p= .000
CCategories: Never married, married and spouse present, divorced/widowed. χ2 (6)=18,154.477, p= .000
DCategories: High school diploma or lower, college graduate, graduate degree or higher. χ2 (6)=8,563.016, p= .000
EF=6,535.527, p=.000; Categories: 1 person, 2 persons, 3-4 persons, 5 persons or more. χ2 (9)=60,943.463, p= .000
FF=8,044.464, p=.000; Categories: Low-, mid- and high-income (MLTM, 2012, p.47). χ2 (6)=42,466.100, p= .000
GCategories: Seoul capital region, metropolitan cities, other. χ2 (6)=71,750.815, p=.000
HCategories: Jeon-se, monthly rental with deposit, monthly rental without deposit, Sa-geul-se. χ2 (9)=47,495.552, p= .000
ICategories: Single-family (single-unit), Dagagu, multifamily, other. χ2 (9)=22,414.265, p= .000
JCategories: In housing poverty, not in housing poverty. χ2 (3)=9,293.623, p= .000
KCategories: Burdened, not burdened. χ2 (3)=24,442.023, p= .000
LCategories: Received, not received. χ2 (3)=19,643.484, p= .000
MCategories: Used, not used. χ2 (3)=5,524.129, p= .000
average age; a large proportion of female householders; married, divorced or widowed householders; and householders with no more than a high school diploma. They also had the second- highest proportion of Jeon-se renters and the second-highest proportion living in the Seoul capital region. The householders tended to have the second-highest household income and the least housing cost burdens. The households in this cluster had the greatest expectation for home purchase or Jeon-se rental within the next two years. Although the households in this cluster showed the lowest expectation for housing cost increase in previous analysis to compare housing value factor scores across clusters, they were found to have relatively great expectation of purchasing a residential unit for investment.
Households in the Support Needed Cluster had the youngest average age of householders, the largest proportion of never- married householders, and the largest proportion of householders with at least a college degree. They had the smallest household size and the largest proportion of single-person households.
They tended to have the lowest income, the heaviest housing
cost burden, and the highest proportion of housing poverty.
However, they had the lowest proportion receiving family support to pay for housing. They had highest proportion of monthly renters without deposit and greatest expectation of becoming monthly renters with deposit in next housing.
Although they showed very low scores on all four housing factors, including Investment and Cost Increase, they showed the greatest expectation of purchasing residential properties as an investment.
V. Conclusions
This study explored housing values and housing characteristics of young renter households in Korea using microdata of the 2012 KHS. According to the results, four clusters with distinctive household and housing characteristics and housing plans were derived from a series of factor and cluster analyses:
Prospective Home Investor, Settled Renter, Homeowner Wannabe and Support Needed. In addition, the young renter
Table 9. Future Housing Plans by Housing Value Cluster
Housing plan Prospective Home Investor Settled Renter Homeowner Wannabe Support Needed Expected time of
next moveA
Greatest proportion of households with plan to move
within next 2 years
Greatest proportion of households with no plan to
move within next 4 years
Greatest proportion of households with plan to move
within next 2 years
Greatest proportion of households with no plan to
move within next 4 years Expectation on
next tenure typeB
Second greatest proportion of households expecting home
purchase
Greatest proportion of households expecting
Jeon-se rental
Greatest proportion of households expecting home
purchase.
Second greatest proportion of households expecting
Jeon-se rental
Greatest proportion of households expecting
monthly rental
Expectation to purchase a residential property for an
investment purposeC
Great proportion of households expected to
purchase a residential property for an investment
purpose
Lowest proportion of households expected to purchase residential property
for an investment purpose
Great proportion of households expected to purchase residential property
for an investment purpose
Greatest proportion of households expected to purchase residential property
for an investment purpose
ACategories: Within 2 years, within 3-4 years, 5 years or more or no plan to move. χ2 (6)=13,932.806, p= .000
BCategories: Purchase, Jeon-se, monthly rental, other. χ2 (15)=63,069.396, p= .000
CCategories: Expected, not expected. χ2 (3)=13,058.933, p= .000
Figure 1. Model Summary of Study Findings
households were found to have different household and housing characteristics as well as housing plans according to the housing value clusters. <Figure 1> summarizes the relationships found in this study. Households and housing characteristics together with housing situation such as housing poverty, housing cost burden and housing cost sources were found to affect a household’s housing values; housing values were found to influence future housing plans; and the household’s housing value might also have affected the choice of current housing.
The study results implied that young renters’ present housing choices and next housing plans are closely associated with their housing values. In addition, current tenure types, income and expectation for next tenure types of four housing value clusters of young renters reflected tenure ladder of Korea which has homeownership at top followed by Jeon-se rental, monthly rental with deposit and monthly rental without deposit.
Two pairs of clusters share some characteristics. The first pair consisted of the Prospective Home Investor and Homeowner Wannabe clusters. The households in those two clusters reported the highest proportion of non-capital region metropolitan city residents, Jeon-se renters and/or residents in single-family structures; highest income and lowest housing cost burdens; and the largest average household size. Most notably, households in these two clusters would consider home purchase in the near future. Thus, for successful development of new housing units for sale and marketing plans in metropolitan cities targeting young home buyers, it would be important to explore values (not limited to housing values) and preferences the households in these two clusters.
However, households in these two clusters showed distinctive characteristics in householder’s age, gender and marital status. Households in Prospective Home Investor Cluster had a greater proportion headed by never-married young persons while households in Homeowner Wannabe Cluster showed the largest proportion headed by older persons who were either divorced or widowed. In addition, Home- owner Wannabe households were found to have the highest proportion of females. For female-headed households, security and safety are very important as revealed in previous studies including the one by Lee (2013). Thus, affordable small-sized units for sale equipped with exceptional security and safety features would appeal to prospective female home buyers.
The second pair consists of Settled Renter Cluster and Support Need clusters. Households in these clusters have a greater proportion of Seoul capital region residents; and relatively higher educational attainment but lower income.
They had a stronger tendency to maintain their renter status for
several more years. For the reasons, households in these two clusters would be the main target to explore for the development of rental units and support programs.
Some of the notable differences between households in these clusters were their current tenure type, housing poverty status, and expectation for next tenure type.
It is noteworthy that households in Support Needed Cluster had the largest proportion of monthly renters without deposit, which usually is associated with poorer quality residential environment, and housing poverty. Lee (2015) insisted that young low-income renter households, especially those in Seoul capital region, had a great tendency to suffer from housing poverty. Most early-career professionals and job preparers who had low incomes would be found in the Support Needed Cluster. Thus, provision of low-cost rental units in Seoul capital regions and development of housing welfare policies and programs would be critical for housing affordability and quality. Shared housing and micro units owned and managed by public entities or non-profit organizations would enable young renters to lighten their housing cost burdens and achieve housing stability.
REFERENCES
1. An, O. H., Jo, O. M., & Hao, J. (2009). A comparative study on the housing viewpoint between Korean and Chinese university students. Journal of the Korean Housing Association, 20(4), 121-129.
2. An, O. H., Kang, H. K., & Jo, Y. M. (2009). Comparison on the time series of housing viewpoint of university student. Journal of the Korean Housing Association, 20(4), 113-120.
3. Bang, S. Y., & Hong, H. O. (2012). University students' housing value orientation and preferences about urban-life housing, Proceeding of Spring Annual Conference of KHA, 2012, 379-384.
4. Hair, J. F., Anderson, R. E., Tatham, R. L., & Black, W. C.
(1998). Multivariate data analysis (5th ed.). Upper Saddle River, NJ: Prentice Hall.
5. Jung, M. R., & An, O. H. (2001). A comparative study on the view of housing between Korean and Japanese female university students. Journal of the Korean Housing Association, 12(4), 162-171.
6. Kim, J. H., & Kwark, K. S. (2007). A study on the life style and housing satisfaction, future-housing environment preferences among the college students. Korean Journal of Human Ecology, 16(3), 651-664.
7. Kim, M. H., & Noh, S. H. (2008). Housing values and satisfaction among university students in Gwangju and the Chonnam area. Journal of the Korean Housing Association, 19(4), 11-20.
8. Kim, Y. J., & Suh, J. R. (2013). The study on housing preference according to the aging of baby boomers. Journal of the Residential Environment Institute of Korea, 11(2),
37-49.
9. Lee, H. J., Goss, R. C., & Beamish, J. O. (2007). Influence of lifestyle on housing preferences of multifamily housing residents. Housing and Society, 34(1), 11-30.
10. Lee, H. J. (2013). College students' housing values, expectations and considerations for housing in their 20s:
Centered on Chungbuk Province. International Journal of Human Ecology, 14(1), 71-85.
11. Lee, H. J. (2014). Housing costs of young college graduate renters in capital region reflected in the 2012 Korea Housing Survey. International Journal of Human Ecology, 15(2), 93-104.
12. Lee, H. J. (2015). Comparisons of young renter households’ housing situation by locations reflected in the 2012 Korea Housing Survey. Journal of the Korean Housing Association, 26(1), 81-90.
13. Lee, H. J., & Choi, B. S. (2015). Housing challenges of very low-income households reflected in the 2012 Korea Housing Survey. 2015 APNHR Conference Book, 245.
14. Lee, H. J., & Emmel, J. M. (2009). Energy practice clusters of Virginia limited-resource households. Housing and Society, 36(2), 171-194.
15. Lim, H. K. (2005). The life style and dwelling preferences of the university students. Korean Journal of Human Ecology, 14(6), 1047-1058.
16. Ministry of Land, Transport and Maritime Affairs. (2012).
2012년도 주거실태조사: 연구보고서 [2012 Korea Housing Survey: Final report]. 주거누리 [Joo-geo-noo-ri]. Retrieved from http://hnuri.go.kr/stat/stat_byYearSearchViewPage.do 17. Varady, D. P., & Lipman, B. J. (1994). What are renters
really like? Results from a national survey. Housing Policy Debate, 5, 491-531.
18. Woo, B., Park, A. R., Lee, K. H., & Lee, H. J. (2012).
Comparison of housing values and housing consideration of Korean and Chinese college students. Journal of the Korean Society of Plant and Environmental Design, 8(1), 33-39.
19. Yoon, J. W., & Shin, H. J. (1997). A study the housing value of the university student in Taegu. Journal of the Korean Housing Association, 8(3), 131-139.
Received: May, 12, 2015 Revised: July, 12, 2015 Accepted: July, 20, 2015