Motives, Strategies and Patterns of Foreign Direct Investment The Case of Japanese :
and Korean Firms
Kang-H. Park
Southeast Missouri State University, U.S.A.
and Kansai Gaidai University, Japan
Yong-Taek Lim
Kunsan National University, Korea
목 차
. Introduction
Ⅰ
. Trend in Japanese and Korean FDI Outflow
Ⅱ References
Abstract
Abstract
This paper is to study globalization motives and strategies of Japanese and Korean industries by analyzing the causes and patterns of foreign direct investment (FDI) of the firms of the two countries during the 1980s and 1990s. First we develop a FDI function from the profit maximizing model of firms. Then we use regression analysis to determine internally driving-out factors and externally-inducing factors. Japanese FDI strategy has gone through three different stages; from natural resource-seeking investment in the 1950s and 1960s to market-expansion investment in the 1970s and 1980s and to a combination of cost-reducing (low-cost labor-seeking) investment and market-penetrating investment in the 1990s. On the other hand, Korean FDI behavior has gone through four different stages; from the learning stage with small investments in the 1970s, to natural resource-seeking investment in the early and mid 1980s, to the growth stage in the late 1980s and the early 1990s, to the maturity stage of the mid and late 1990s. The last two stages were characterized by a combination of cost-reducing investment and market-seeking investment. As a late comer, Korea began its FDI two decades later than Japan, but caught up the patterns of Japanese FDI by the mid 1990s and is in a competing position with Japan.
Our findings show that both Japanese FDI and Korean FDI in Asia and other developing countries tendto be in labor-intensive sectors where their firms are losing their comparative advantages at home. The main motive for FDI into these regions is low-cost resource seeking. On the other hand, both Japanese FDI and Korean FDI in the U.S. and Europe tend to be knowledge-intensive sectors where Japanese and Korean firms attempt to internalize transaction and information costs by globalizing its production. The main motive for FDI into these regions is market-seeking. Firms in both countries have increased their investments in Mexico and Western and Eastern Europe in order to penetrate large economic blocs such as the EU and NAFTA area. Korean firms are more aggressive in expanding into new and untested markets than are their counterpart in Japan. Evidence of this can be seen in the scarcity of Japanese FDI and abundance of Korean FDI in Eastern Europe and China.
Key Words:FDI, Natural Resource-seeking Investment, Market-expansion Investment, Cost-reducing Investment, Low-cost Labor-seeking Investment, Market-penetrating Investment
. Introduction
Ⅰ
The purpose of this paper is to study globalization strategies of Japanese and Korean industries by analyzing the causes and patterns of foreign direct investment (FDI) of firms in both countries. There have been many studies done on FDI by the U.S. firms or into the U. S. (Woodward & Rolfe, 1993, Kumar, 1994, Loree &
Guisinger, 1995, and Grosse & Trevino, 1996, just to name a few). Even though Japan has been a major player in FDI, only a few studies have been done on Japanese FDI. The peak of Japanese FDI outflow occurred in 1989 when it climbed to the first place in the world. Since the 1991 the collapse of its real estate and stock markets Japanese FDI dwindled gradually to the sixth place in the world in 2000. Among these few studies done on Japanese FDI, they are mainly limited to either Japanese FDI in the U.S. (Georgiou & Weinhold, 1992, Mann, 1993, and Azrak & Wynne, 1995) or in the EC (Heitger & Stehn, 1990, and Thomsen, 1993, Yamada
& Yamada, 1996). More recently Japanese FDI in other individual countries such as Canada or China has bee analyzed (Deng, 1997, Rong, 1999, Delios & Ensign, 2000, Zhou, 2002). Instead of analyzing Japanese FDI activities in one or two individual countries, this study analyzes global investment activities of Japanese firms, covering Japanese FDI in 65 countries. However, Korea, being a new player in FDI, few studies have been done on Korean FDI outflow.
FDI here is defined as the flow of capital from a foreign country to a host country to establish production or service facilities and to conduct business activities. Therefore, FDI is different from a portfolio investment whose main purpose is to earn dividends and capital gains with no significant control over ownership. FDI is also distinguished from re-investment out of profits or investment financed through overseas loans by subsidiary firms. In the next section, an overview of Japanese and Korean FDI outflow by region and sector is presented. In section 3, the factors inducing Japanese and Korean FDI to a host country are examined. The last section evaluates the overall performance of Japanese and Korean FDI outflow and draws some lessons from their experience.
. Trend in Japanese and Korean FDI Outflow
Ⅱ
1. Japan
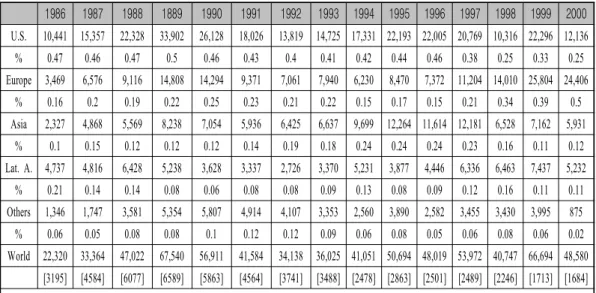
Table 1 shows Japanese FDI outflow from 1986 to 2000 by region. Even though there were some activities during the 1950s, 1960sand 1970s, Japanese FDI outflow was insignificant in the amount and also as a share in world total FDI until the 1980s when the Japanese economy began to accumulate trade surpluses and foreign
reserves. While Japanese FDI had increased substantially during the 1980s, it reached its peak at $67.5 billion in 1989, and then began dropping throughout 1990sas the bubbled Japanese economy burst out in 1990.
Bottoming out at $34.1 billion in 1992, it was on a recovery path until 1997 when the Asian financial crisis occurred. However, after just one year setback in 1998, Japanese FDI resurged thanks to mergers and acquisition spree as a survival strategy in the age of global competition. Japanese FDI suddenly jumped from $40.7 billion in 1998 to $66.7 billion in 1999. This surge is mainly attributable to M&As in the food sector involving Japan Tobacco in the U.K. and the Netherlands. A similar trend can be found in Japanese FDI cases. With rapid increase during the 1980s, the number of Japanese FDI cases peaked to 6,589 cases in 1989. In recent years, the number of Japanese FDI cases has declined continuously while the Japanese FDI amounts have increased during the same period, indicating a growth in the average size of FDI amounts.
Table 1. Japanese FDI Outflow by Region (in $ million)
1986 1987 1988 1889 1990 1991 1992 1993 1994 1995 1996 1997 1998 1999 2000 U.S. 10,441 15,357 22,328 33,902 26,128 18,026 13,819 14,725 17,331 22,193 22,005 20,769 10,316 22,296 12,136
% 0.47 0.46 0.47 0.5 0.46 0.43 0.4 0.41 0.42 0.44 0.46 0.38 0.25 0.33 0.25
Europe 3,469 6,576 9,116 14,808 14,294 9,371 7,061 7,940 6,230 8,470 7,372 11,204 14,010 25,804 24,406
% 0.16 0.2 0.19 0.22 0.25 0.23 0.21 0.22 0.15 0.17 0.15 0.21 0.34 0.39 0.5
Asia 2,327 4,868 5,569 8,238 7,054 5,936 6,425 6,637 9,699 12,264 11,614 12,181 6,528 7,162 5,931
% 0.1 0.15 0.12 0.12 0.12 0.14 0.19 0.18 0.24 0.24 0.24 0.23 0.16 0.11 0.12
Lat. A. 4,737 4,816 6,428 5,238 3,628 3,337 2,726 3,370 5,231 3,877 4,446 6,336 6,463 7,437 5,232
% 0.21 0.14 0.14 0.08 0.06 0.08 0.08 0.09 0.13 0.08 0.09 0.12 0.16 0.11 0.11
Others 1,346 1,747 3,581 5,354 5,807 4,914 4,107 3,353 2,560 3,890 2,582 3,455 3,430 3,995 875
% 0.06 0.05 0.08 0.08 0.1 0.12 0.12 0.09 0.06 0.08 0.05 0.06 0.08 0.06 0.02
World 22,320 33,364 47,022 67,540 56,911 41,584 34,138 36,025 41,051 50,694 48,019 53,972 40,747 66,694 48,580 [3195] [4584] [6077] [6589] [5863] [4564] [3741] [3488] [2478] [2863] [2501] [2489] [2246] [1713] [1684]
FDI cases in parentheses. Others include Oceania, Canada, Africa, and Middle East. Source Ministry of Finance, Japanese Government:
Geographically, Japanese FDI in the U.S. has always been the highest until 1997 with its share in Japan's total FDI outflow ranging from a low of 38% to a high of 50% in 1989. Japanese FDI in Europe shows a U-curve pattern. Europe remained the second highest recipient of Japanese FDI until 1993. Japanese FDI in Europe at $14.3 billion in 1990 was twice as high as that invested in Asia at $7.1 billion. However, Japanese FDI in Europe declined since 1989, bottoming out in 1994 at $6.2 billion, slipping behind Japanese FDI in Asia, then surpassing Japanese FDI in Asia in 1998 after the Asian financial crisis and then surpassing the U.S. in 1999. Japanese FDI in Europe at $24.4 billion in 2000 was twice as high as that invested in the U.S. and almost
5 times higher than that invested in Asia. In 1994 Japanese FDI in Asia at $9.7 billion surpassed Japanese FDI in Europe and Asia remained as the second largest recipient of Japanese FDI until 1997. Particularly noteworthy is that Japanese FDI in China and ASEAN continued to be brisk, reaching its peak in China in 1995 at $4.4and in ASEAN in 1997 at $5.7 billion. Japanese FDI in four NIEs (South Korea, Taiwan, Hong Kong, and Singapore) was around $3.5billion in 1995-1997.
However, the Asian financial crisis of 1997-98 resulted in a drastic reduction in Japanese FDI, and Japanese FDI in Asia since the Asian financial crisis has remained at one half of the pre-crisis level. Asia's share of Japan's FDI changed from its peak of 24 percent in 1994-96 to meager 11 percent in 1999 and 12percent in 2000. Japanese FDI in four NIEs (South Korea, Taiwan, Hong Kong, and Singapore) decreased from over $3 billion in the past few years to $1.7 billion in 1999. Japanese FDI in Vietnam, India and other Asian countries, though small in its size, experienced an increase in recent years. In 1994, Japanese FDI in Latin America recovered to the previous peak level of $5.2 billion achieved in 1989, and it continued to grow to the level of
$7.4 billion in 1999. On the other hand, Japanese FDI in Africa and other parts of world has steadily declined after reaching its peak in 1990 and stood at less than $1 billion in 2000.
From the data, a shift of Japanese FDI strategy can be detected. Japanese firms increased their investments in Europe during the 1980s, particularly the late 1980s, as a market-seeking investment in preparation for the formation of a unified single European market in 1992. For example, Japan's two dominant export industries, electronics and transport equipment, have been subject tovarious restrictions from both the U.S. and Europe including voluntary export restraints, antidumping penalties, and rules of origin. Many Japanese firms have invested in the U.S. and Europe in order to circumvent these barriers. However, domestic wage increases and yen appreciation in 1990s forced them to concentrate their investments in Asia as a resource-seeking investment until 1997 when the Asian financial crisis occurred. Importance of Africa as either a production site or market has diminished over time.
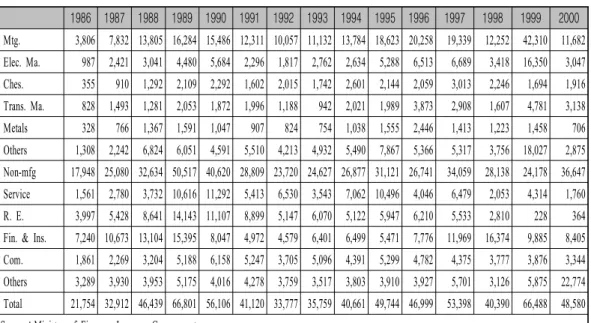
Table 2 shows Japanese FDI outflow from 1986 to 1994 by sector. In examining Japanese FDI by sector, the non-manufacturing sectors such as banking/insurance, commerce, real estate, and service, have dominated Japanese FDI outflows. Japanese FDI outflow in non-manufacturing sectors has exceeded Japanese FDI outflow in manufacturing sectors by three to one ratio. Three main sectors in non-manufacturing have been service, real estate, and finance & insurance. Japanese FDI in both real estate and finance & insurance reached its peak in 1989 at
$14.1 billion and 15.4 billion respectively. However, Japanese FDI in real estate has continuously declined to the level of $.4 billion in 2000. Many Japanese firms suffered very large losses in real estate deals in the U.S.and other countries. A new sector gaining popularity among Japanese firms is transportation service where $21.9 billion was invested in 2000. Three main sectors in manufacturing have been electric machinery, chemicals and transportation machinery. However, there has been increasing investment in a new sector, non-electrical machinery, with $1.9 billion in 2000.
Table 2 . Japanese FDI Outflow by Sector (in $ Million)
1986 1987 1988 1989 1990 1991 1992 1993 1994 1995 1996 1997 1998 1999 2000 Mtg. 3,806 7,832 13,805 16,284 15,486 12,311 10,057 11,132 13,784 18,623 20,258 19,339 12,252 42,310 11,682 Elec. Ma. 987 2,421 3,041 4,480 5,684 2,296 1,817 2,762 2,634 5,288 6,513 6,689 3,418 16,350 3,047 Ches. 355 910 1,292 2,109 2,292 1,602 2,015 1,742 2,601 2,144 2,059 3,013 2,246 1,694 1,916 Trans. Ma. 828 1,493 1,281 2,053 1,872 1,996 1,188 942 2,021 1,989 3,873 2,908 1,607 4,781 3,138 Metals 328 766 1,367 1,591 1,047 907 824 754 1,038 1,555 2,446 1,413 1,223 1,458 706 Others 1,308 2,242 6,824 6,051 4,591 5,510 4,213 4,932 5,490 7,867 5,366 5,317 3,756 18,027 2,875 Non-mfg 17,948 25,080 32,634 50,517 40,620 28,809 23,720 24,627 26,877 31,121 26,741 34,059 28,138 24,178 36,647 Service 1,561 2,780 3,732 10,616 11,292 5,413 6,530 3,543 7,062 10,496 4,046 6,479 2,053 4,314 1,760 R. E. 3,997 5,428 8,641 14,143 11,107 8,899 5,147 6,070 5,122 5,947 6,210 5,533 2,810 228 364 Fin. & Ins. 7,240 10,673 13,104 15,395 8,047 4,972 4,579 6,401 6,499 5,471 7,776 11,969 16,374 9,885 8,405 Com. 1,861 2,269 3,204 5,188 6,158 5,247 3,705 5,096 4,391 5,299 4,782 4,375 3,777 3,876 3,344 Others 3,289 3,930 3,953 5,175 4,016 4,278 3,759 3,517 3,803 3,910 3,927 5,701 3,126 5,875 22,774 Total 21,754 32,912 46,439 66,801 56,106 41,120 33,777 35,759 40,661 49,744 46,999 53,398 40,390 66,488 48,580 Source Ministry of Finance, Japanese Government:
Heitger and Stehn (1990) attributed the pattern of dominance of non-manufacturing FDI over manufacturing FDI to its complementarity to Japanese exports. However, Japanese FDI in the manufacturing sectors has steadily increased over time from 16 percent of total FDI in 1986 to 43 percent in 1996. This change in investment patterns could be partly explained by increasing profits of overseas operation in manufacturing sectors and decreasing profits of overseas operation in non-manufacturing sectors in the last several years. According to Thomsen (1993), much of the investment by Japanese manufacturing firms in Europe relates to market-access, particularly by firms in the transport equipment and electronics sectors. The only exception is the chemical and pharmaceutical sectors where the main motive for investment is more likely to gain access to European technology and skills. On the other hand, many Japanese firms began to invest in the U.S. during the 1960s and 1970s for technology sourcing(Caves, 1982). In recent decades, Japanese FDI in the U.S. tends to be in both market-seeking and resource-seeking (mainly technology).
The data related to Japanese FDI do not give a full picture of global investment activities by Japanese firms for two reasons - reinvestment and third country investment. First, Japanese FDI figures do not include reinvestments financed by local loans taken out overseas or internal profits. In recent years, reinvestment has been increasing and now surpasses FDI originated from Japan in some regions and sectors. For example, Japanese manufacturing subsidiaries in Asia, particularly in the ASEAN countries, have enjoyed higher profits thanks to booming economies and are vigorously reinvesting in capital equipment out of their retained earnings
and locally borrowed fundsuntil 1997. Second, there is an increasing trend of third country investments.
Traditionally, overseas subsidiaries remitted funds directly to their parent companies in Japan. As a part of globalization strategy, many Japanese firms established regional headquarters (for example, New York, London, Frankfurt, Hong Kong, and Singapore). With this change in Japanese globalization strategy, overseas subsidiaries located in regional headquarters increased their remittance to third countries to establish their own subsidiaries.
Three most active regional headquarters are Hong Kong, Singapore, and the U.S. The leading sites for third country investment by Singapore-based Japanese affiliates are the ASEAN countries such as Indonesia, Thailand, and Philippines, whereas China is the main site of third country investment by Hong Kong-based Japanese affiliates. According to JETRO, Hong Kong-based Japanese affiliates have been investing in China to take advantage of inexpensive labor costs and its giant market in view of the 1997 reversion of Hong Kong, while Singapore-based Japanese affiliates mostly gave as reasons for third country investment the desire to meet the demand in the host country. On the other hand, Japanese affiliates in the U.S. have established their presence all over the world; third country investments by the U.S.-based Japanese affiliates include Canada, Mexico, Europe, 4 NIEs and the ASEAN countries.
2. Korea
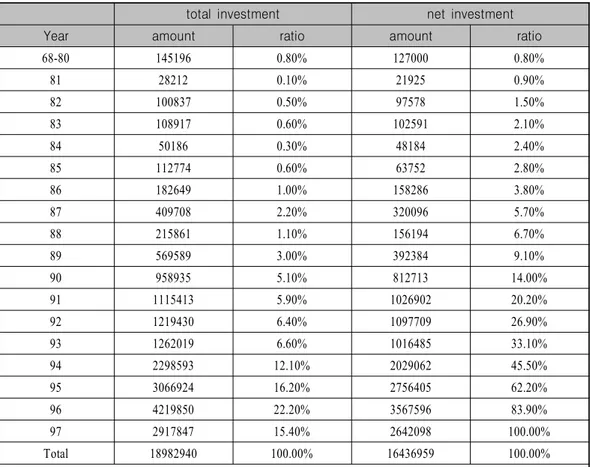
Korean FDI of $4.2 billion in 1996 amounts to only 1.3% of world total FDI of $332 billion in the same year. However, Korean FDI draws our attention because of the rate at which it expands; it increased about 4.4 times from $.96 billion in 1990 to $4.2 billion in 1996 while world total FDI increased only about 1.4 times from $234 billion to $332 billion during the same period. Table 3 shows the historical trend ofKorean FDI from 1968 to 1997. Even though there was a slow-down in Korean FDI in the early 1990s, Korean FDI has increased substantially since 1993. This was mainly due to deregulation policy and liberalization of investment abroad by Korean government. Korean FDI, which began with the forest development investment to Indonesia by Korea South Development Co. in 1968, can be classified into four stages or periods according to characteristics and motives of investment.
During the first period - 1968 through 1981 - Korean FDI amounted to about $ 173 million with the trade sector as leader, followed by forestry, construction, and manufacturing. In this period the average size per project was very small, about $550,000 and $455,000 respectively, on the basis of total and net investment. The second stage from 1982 to 1987 was mainly for natural resource seeking. Thanks to the policy of the Korean government, which had recognized the importance of securing resources after the second oil crisis in 1979, Korean FDI increased rapidly since 1982. The average annual investment surpassed $100 million for the six years from 1982 to 1987, and the total investment of $965 million during the second stage was 5.6 times as
much as the total investment of $ 173 million up to 1981. The average amount per project reached at 2.9 million in this second stage. Particularly, the amount per project in 1987 amounted to $4.5 million, which was attributable to heavy investment by the mining sector whose share in FDI was 52%.
Table 3. Korean Net FDI Outflow by Year (US $1,000)
total investment net investment
Year amount ratio amount ratio
68-80 145196 0.80% 127000 0.80%
81 28212 0.10% 21925 0.90%
82 100837 0.50% 97578 1.50%
83 108917 0.60% 102591 2.10%
84 50186 0.30% 48184 2.40%
85 112774 0.60% 63752 2.80%
86 182649 1.00% 158286 3.80%
87 409708 2.20% 320096 5.70%
88 215861 1.10% 156194 6.70%
89 569589 3.00% 392384 9.10%
90 958935 5.10% 812713 14.00%
91 1115413 5.90% 1026902 20.20%
92 1219430 6.40% 1097709 26.90%
93 1262019 6.60% 1016485 33.10%
94 2298593 12.10% 2029062 45.50%
95 3066924 16.20% 2756405 62.20%
96 4219850 22.20% 3567596 83.90%
97 2917847 15.40% 2642098 100.00%
Total 18982940 100.00% 16436959 100.00%
Source Overseas Investment Information System, The Export-Import Bank of Korea:
The third stage from 1988 to 1993 can be called "growth stage," which was an important period in Korean FDI. Korean companies encouraged by the Korean government began to accelerate the overseas investment because, since the middle of the 1980s, the Korean currency, Won, had been appreciating, labor costs in Korea had jumped, and trade pressures and frictions in the world had been on the rise. In this period, labor-intensive companies, which lost their competitiveness in the domestic and world markets, could not avoid moving their production bases to foreign countries which had low wages or rents. At the same time, the large conglomerate companies, which had led the Korean exports, pushed the pedal to direct overseas investment in order to secure
their markets in advanced countries. This period is characterized by a combination of cost-reducing investment and market-penetrating investment.
During the 1988-1993 period, there were a total of 2,400 project investments in the amount of $5.3 billion.
This was an increase of more than 4 times as much as FDI of the second period. Since the latter half of the 1980s, Korean FDI in the manufacturing sector has risen most significantly, and it amounted to above $1 billion every year since 1991. The investment in this period shot up about 600 percent from 1988 to 1993. However, the average investment per project declined continuously from $2.84 million in 1990 to $1.56 million in 1994 in spite of continuous increase in the number of projects and the total FDI amount. This was because small investments to Southeast Asia and China increased drastically from 302 projects in 1990 to 1627 projects in 1994.
1994 was a turning point in Korean FDI history because the Korean government changed its FDI policy from a system requiring government approval for most of FDI to a system allowing free investment abroad except for a few listed sectors. This change was made in response to changing world environment, that is, increasing globalization of the world and intensifying regional blocs. So, the fourth period began from 1994. Following the change in the Korean government's FDI policy, Korean FDI increased rapidly, reaching $3.58 billion in 1994 and $8.49 billion in the two-year period of 1994-1995. FDI alone in this two-year period almost matched the total FDI up to 1993. Korean FDI from 1994 to 1996 accounts for 60 percent of the total investment up to the end of 1996.
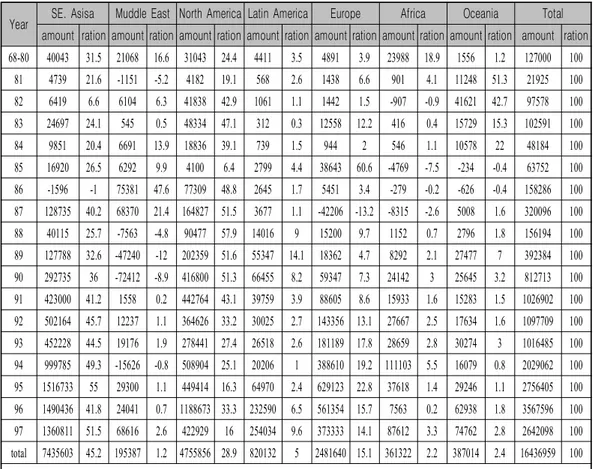
Table 4 shows Korean FDI from 1968 to 1997 by region. Until 1980, Southeast Asia, North America, and Africa were the major regions invested, but after 1981 the importance of Africa as either a resource site or production site has diminished. On the other hand, Oceania has emerged as a new major region invested up to 1984. Geographically, Korean FDI in Southeast Asia, except for 1988 when $1.6 million liquidation was recorded, has usually been the highest in the 1990s with its share in Korea's total FDI of 51.5% in 1997.
Particularly, Investment in this region showed an explosive rise since 1994 due to heavy investment to China.
North America used to be the most invested region in the 1980s. However North America yielded the lead to Southeast Asia since 1992.
Europe has remained the third highest recipient of Korean FDI with a continuous rise since 1988.Korean FDI in Europe surpassed that in North America in 1994 just for one year. Korean FDI in Middle East, which peaked at the amount of $75.4 million and 47.6% share of total in 1986, reached at a considerable amount in the middle of the 1980s thanks to the resource-seeking investment in mining and crude oil, but since the late 1980s it decreased rapidly.
Table 4. Korean Net FDI Outflow by Year/Region(US $1,000)
Year SE. Asisa Muddle East North America Latin America Europe Africa Oceania Total amount ration amount ration amount ration amount ration amount ration amount ration amount ration amount ration 68-80 40043 31.5 21068 16.6 31043 24.4 4411 3.5 4891 3.9 23988 18.9 1556 1.2 127000 100
81 4739 21.6 -1151 -5.2 4182 19.1 568 2.6 1438 6.6 901 4.1 11248 51.3 21925 100 82 6419 6.6 6104 6.3 41838 42.9 1061 1.1 1442 1.5 -907 -0.9 41621 42.7 97578 100 83 24697 24.1 545 0.5 48334 47.1 312 0.3 12558 12.2 416 0.4 15729 15.3 102591 100
84 9851 20.4 6691 13.9 18836 39.1 739 1.5 944 2 546 1.1 10578 22 48184 100
85 16920 26.5 6292 9.9 4100 6.4 2799 4.4 38643 60.6 -4769 -7.5 -234 -0.4 63752 100 86 -1596 -1 75381 47.6 77309 48.8 2645 1.7 5451 3.4 -279 -0.2 -626 -0.4 158286 100 87 128735 40.2 68370 21.4 164827 51.5 3677 1.1 -42206 -13.2 -8315 -2.6 5008 1.6 320096 100 88 40115 25.7 -7563 -4.8 90477 57.9 14016 9 15200 9.7 1152 0.7 2796 1.8 156194 100 89 127788 32.6 -47240 -12 202359 51.6 55347 14.1 18362 4.7 8292 2.1 27477 7 392384 100 90 292735 36 -72412 -8.9 416800 51.3 66455 8.2 59347 7.3 24142 3 25645 3.2 812713 100 91 423000 41.2 1558 0.2 442764 43.1 39759 3.9 88605 8.6 15933 1.6 15283 1.5 1026902 100 92 502164 45.7 12237 1.1 364626 33.2 30025 2.7 143356 13.1 27667 2.5 17634 1.6 1097709 100 93 452228 44.5 19176 1.9 278441 27.4 26518 2.6 181189 17.8 28659 2.8 30274 3 1016485 100 94 999785 49.3 -15626 -0.8 508904 25.1 20206 1 388610 19.2 111103 5.5 16079 0.8 2029062 100 95 1516733 55 29300 1.1 449414 16.3 64970 2.4 629123 22.8 37618 1.4 29246 1.1 2756405 100 96 1490436 41.8 24041 0.7 1188673 33.3 232590 6.5 561354 15.7 7563 0.2 62938 1.8 3567596 100 97 1360811 51.5 68616 2.6 422929 16 254034 9.6 373333 14.1 87612 3.3 74762 2.8 2642098 100 total 7435603 45.2 195387 1.2 4755856 28.9 820132 5 2481640 15.1 361322 2.2 387014 2.4 16436959 100 Source Overseas Investment Information System, The Export-Import Bank of Korea:
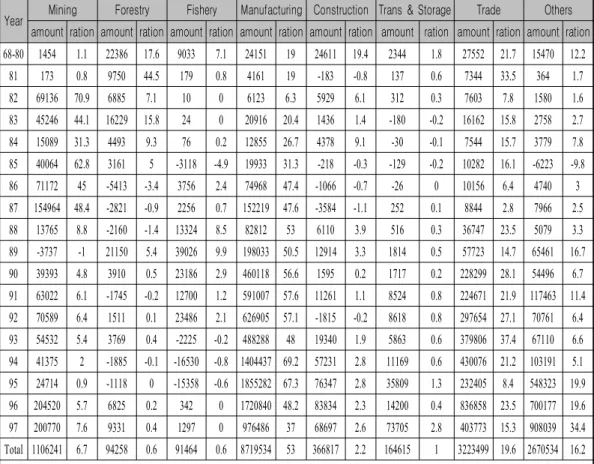
Table 5 shows Korean FDI from 1968 to 1997 by industry. Up to 1980, trade, manufacturing, construction and forestry with a share of 20% or so respectively dominated Korean FDI outflows. Investment in mining rose explosively from 1982 to 1987 and once again in 1996 and 1997 in order to secure domestically scant resources from Canada, Australia, and others. Korean FDI in the manufacturing sector has increased continuously over time from 20 percent of total FDI in 1983 to 48 percent in 1996. The manufacturing sector has maintained the top since 1986. Korean FDI in trade has ranked the second with a continuous rise since 1988. Korean FDI in forestry was active up to 1980 and has been inactive since then. The greater part of investment in fishery was made for the five-year period from 1988 through 1992 and since then has gone through liquidation.
Even though Korean firms invested in over 100 countries, FDI exceeding $100 million in outstanding amount are limited to 28 countries and investment in these 28 countries accounts for 90 percent of total FDI.
Furthermore, the share of two counties, USA and China, amounted to about 50 percent of total FDI with the
peak of 60.3% in 1996. During the 1990s, investment to most of advanced countries - the U.S., U.K., Hong Kong, Japan, and Canada - has increased until 1996, but decreased in 1997, while investment to developing and less developed countries shows the opposite. Korean FDI to Indonesia amounted to about 30% respectively of total in mining and forestry sectors, and that to China reached over 30.2% and 35% respectively of total in manufacturing and construction.
Table 5 . Korean Net FDI Outflow by Year/Industry(US $1,000)
Year Mining Forestry Fishery Manufacturing Construction Trans & Storage Trade Others amount ration amount ration amount ration amount ration amount ration amount ration amount ration amount ration 68-80 1454 1.1 22386 17.6 9033 7.1 24151 19 24611 19.4 2344 1.8 27552 21.7 15470 12.2
81 173 0.8 9750 44.5 179 0.8 4161 19 -183 -0.8 137 0.6 7344 33.5 364 1.7
82 69136 70.9 6885 7.1 10 0 6123 6.3 5929 6.1 312 0.3 7603 7.8 1580 1.6
83 45246 44.1 16229 15.8 24 0 20916 20.4 1436 1.4 -180 -0.2 16162 15.8 2758 2.7 84 15089 31.3 4493 9.3 76 0.2 12855 26.7 4378 9.1 -30 -0.1 7544 15.7 3779 7.8 85 40064 62.8 3161 5 -3118 -4.9 19933 31.3 -218 -0.3 -129 -0.2 10282 16.1 -6223 -9.8
86 71172 45 -5413 -3.4 3756 2.4 74968 47.4 -1066 -0.7 -26 0 10156 6.4 4740 3
87 154964 48.4 -2821 -0.9 2256 0.7 152219 47.6 -3584 -1.1 252 0.1 8844 2.8 7966 2.5 88 13765 8.8 -2160 -1.4 13324 8.5 82812 53 6110 3.9 516 0.3 36747 23.5 5079 3.3 89 -3737 -1 21150 5.4 39026 9.9 198033 50.5 12914 3.3 1814 0.5 57723 14.7 65461 16.7 90 39393 4.8 3910 0.5 23186 2.9 460118 56.6 1595 0.2 1717 0.2 228299 28.1 54496 6.7 91 63022 6.1 -1745 -0.2 12700 1.2 591007 57.6 11261 1.1 8524 0.8 224671 21.9 117463 11.4 92 70589 6.4 1511 0.1 23486 2.1 626905 57.1 -1815 -0.2 8618 0.8 297654 27.1 70761 6.4 93 54532 5.4 3769 0.4 -2225 -0.2 488288 48 19340 1.9 5863 0.6 379806 37.4 67110 6.6 94 41375 2 -1885 -0.1 -16530 -0.8 1404437 69.2 57231 2.8 11169 0.6 430076 21.2 103191 5.1 95 24714 0.9 -1118 0 -15358 -0.6 1855282 67.3 76347 2.8 35809 1.3 232405 8.4 548323 19.9 96 204520 5.7 6825 0.2 342 0 1720840 48.2 83834 2.3 14200 0.4 836858 23.5 700177 19.6 97 200770 7.6 9331 0.4 1297 0 976486 37 68697 2.6 73705 2.8 403773 15.3 908039 34.4 Total 1106241 6.7 94258 0.6 91464 0.6 8719534 53 366817 2.2 164615 1 3223499 19.6 2670534 16.2 Source Overseas Investment Information System, The Export-Import Bank of Korea:
The share of FDI to these 28 countries out of total FDI amounts to 90 percent on the whole, but varies very much with industries. For example, the weights in mining, forestry, and fishery are much less (74.9%, 40.2%, and 45.4% respectively) than the overall average of 90% while those in trade, transportation & storage, and manufacturing are a little more (95.4%, 92.2%, and 91.3% respectively) than the average. This indicates that the investment for resource-seeking is more diversified than that for market-seeking or cost-reducing.
Early Korean FDI has been typically small investments while more recent investments tend to be of large scale. Investments of larger size (over $10 million) have been made to Europe, Middle East, Latin America, and Africa, while investments of all size have been done relatively equally to Southeast Asia, North America, and Oceania. 76 percent of Korean FDI is in the form of majority ownership. The equity participation ratio of 100%
accounts for 49 percent of Korean FDI, and this ratio between 50% and 99% accounts for 29 percent of Korean FDI.
3. Determinants of Japanese and Korean FDI Outflow
The FDI function can be derived from the profit maximization theory of a firm. Following Nickell (1979) and Mann (1993), a typical firm maximizes profits choosing the optimal price and quantity.
= P(Q) Q(K,L) - c(r,w) Q(K,L),(1) π
where r (capital rental) and w (wage rate) are unit costs of K and L respectively. This function also determines the optimal capital stock and labor input. By assuming that FDI reflects the change from an initial capital stock (K0) to the optimal capital stock, the profit maximizing investment function (FDI in this case) can be derived from the differentiation of the profit function.
FDI = g {µ + (1- ) Kψ 0 l/ w +ε ψ ε/ K0 r}, (2)
where µ is exogenous changes in demand, ψ= dQ K/dK Q indicates the economies of scale, and = dQ P/dPε Q is the price elasticity of demand. Exchange rate fluctuations can affect FDI through their influence on the price elasticity of demand and economies of scale. This simplified FDI function can be expanded to include other effects such as tax effect and market integration effect to reflect the more complex reality.
1) Japan
The following expanded regression model is constructed for empirically analyzing Japan. FDI = h (W, R, PCGNP, EX, T, PI, D1, D2, LAN), (3)
where FDI is the dollar values of direct investment flows in manufacturing sectors to each country (in
$million), PCGNP (per capita GNP in log) measures the market size or economies of scale, R is the real rate of interest, obtained by the nominal interest rate minus inflation rate, W is the average wage rate (in log), EX measures the changes in the exchange rate, T is the income tax rate, and PI is the political instability index.
D1is a dummy variable representing the EC market, D2 is a dummy variable representing the NAFTA market, and LAN is a dummy variable representing English-speaking countries including former English-speaking colonies.
Data on income tax rates are obtained from the various issues of International Tax Summaries. PI is operationalized by deaths from political violence (in log) obtained from The World Handbook of Political and Social Indicators. Although there are various indicators of political instability such as armed attacks, riots, and political strikes, the variable, "deaths from political violence" is chosen as a proxy variable for PI because it represents not only the incidence of political unrest but also the intensity and magnitude of such unrest better than other variables. Data on PCGNP, EX, R and W are obtained from International Financial Statistics and UN Statistical Yearbook.
This model is estimated with Japanese FDI outflow data over the period of 1986-2000. Since FDI outflows into individual countries vary drastically from year to year, the cumulative FDI flows for the period of 1986-2000 are used in this study. For the independent variables, either their averages or mid-point year (1994) figures are used except for PI for which only the 1970s figures are available. Japanese FDI outflow figures are available for 65 countries from the Ministry of Finance. Some studies have used a conditional logit model to determine the location selection. However, by limiting the variance of FDI to that of a dichotomous variable, this approach does not explain how large FDI flows are going to each country. Therefore, we apply the OLS regression with the dollar values of FDI as the dependent variable. Our model is comparable to the eclectic paradigm. According to the eclectic paradigm by Dunning (1988, 1995) which is commonly used in empirical studies of FDI, the propensity to engage in foreign production is influenced by the combination of ownership specific advantages (e.g., intangible assets such as know-how, brand name and superior management), and internalization advantages (e.g., savings in transaction and information costs by FDI over trade and licensing), and location-specific advantages (e.g., cheaper input prices, infrastructure provisions, language and political stability). Since our dependent variable is the aggregate FDI flows going into each country instead of FDI by each firm, our model does not have the variables representing ownership-specific advantages. However, location-specific advantages are represented by W, R and LAN, and internalization advantages are represented by PCGNP, D1 and D2. The variables, T, PI, and EX may represent both location and internalization advantages.
Market-seeking FDI flows, i.e., the investments oriented mainly to a host country's domestic markets are expected be affected by PCGNP, the presence of market integration and political stability, while resource-seeking FDI flows, i.e., export-oriented investments will be largely determined by W and T. With globalization of financial markets and the high degree of mobility of financial capital, R is not expected to be a significant variable.
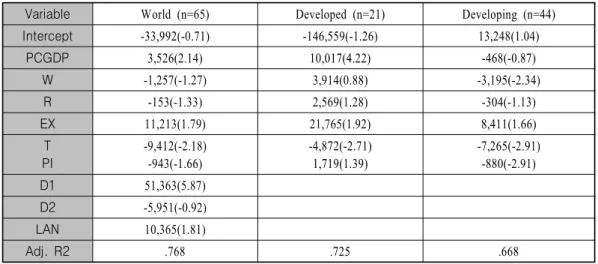
The regression equations explaining the variation in Japanese FDI across countries are presented in Table 6 for three different sets of data - world, developed countries, and developing countries. For the world data set, three variables - PCGNP, T, and D1 - are significant at the 1 percent or 5 percent levels, while other three variables - EX, PI and LAN - are significant at the 10 percent levels. The remaining three variables, W and R, and D2,
turn out to be insignificant. The insignificance of R is expected with the high mobility of financial capital, but the insignificance of W is a surprise.
Table 6. Regression Equations Explaining Determinants of Japanese FDI
Variable World (n=65) Developed (n=21) Developing (n=44)
Intercept -33,992(-0.71) -146,559(-1.26) 13,248(1.04)
PCGDP 3,526(2.14) 10,017(4.22) -468(-0.87)
W -1,257(-1.27) 3,914(0.88) -3,195(-2.34)
R -153(-1.33) 2,569(1.28) -304(-1.13)
EX 11,213(1.79) 21,765(1.92) 8,411(1.66)
T PI
-9,412(-2.18) -943(-1.66)
-4,872(-2.71) 1,719(1.39)
-7,265(-2.91) -880(-2.91)
D1 51,363(5.87)
D2 -5,951(-0.92)
LAN 10,365(1.81)
Adj. R2 .768 .725 .668
t values in parentheses
Japanese FDI in Asia and other developing countries tends to be in labor-intensive sectors where Japanese firms are losing its comparative advantage at home. Therefore, the main motive for Japanese FDI into these regions is low-cost resource-seeking. As opposed to this, Japanese FDI in the developed countries, that is, the U.S. and Europe, tends to be in technology-intensive sectors where Japanese firms attempt to internalize transaction and information costs by globalizing its production. The main motive for Japanese FDI into these regions is market-seeking together with technology-sourcing. Scale intensity is not significant for Japanese FDI in the world or any region.
Woodward and Rolfe (1993) found labor costs to be a significant influence on export-oriented investment by the U.S. On the other hand, Loree and Guisinger (1995) obtained no significance of the wage rate for the U.S.
overall FDI. They explained that the net effect of wages may be washed out because the data not only contain industries that are seeking relatively low-wages and low skill personnel (manufacturing concentrated) but also industries that require relatively high-skill high-wage personnel (high technology). That seems to be the case with Japanese FDI for the world data set.
The variable W stands out and the variable PCGNP becomes insignificant when the U.S. and EC countries are excluded from the sample. PCGNP becomes more important and W shows a positive relationship with FDI flows when the developing countries are excluded from the sample. Therefore, it is not desirable to pool the data of
both developed and developing countries in analyzing Japanese FDI behaviors. Two distinguishing patterns of Japanese FDI can be observed from these regression results; marketing-seeking and technology-seeking FDI flows into the U.S. and Europe and low-cost resource-seeking FDI flows into the developing countries. The variable PI seems to be immaterial for Japanese FDI into the developed countries because political instability is nonexistent or geographically limited, if any (e.g. Northern Ireland). The importance of the variable LAN is mainly due to the dominance of the U.S. and U.K. shares in Japanese total FDI.
2) Korea
The following regression model is constructed for empirically analyzing the Korean case.
FDI = f (PPPGNP, W, R, EX, ED, T, D1, D2, LAN), (4)
where FDI is the dollar values of direct investment flows in manufacturing sectors to each country (in $ million), PPPGNP ($ billion), which is GNP expressed in purchasing power parity, measures the market size or economies of scale, W is the average wage rate, R is the real rate of interest, obtained by the nominal lending rate minus inflation rate, EX measures the changes in the exchange rate, T is the weighted mean tariff rate on manufactured products. To accurately measure real market size, PPPGNP instead of GNP is used for this study.
W is measured by a proxy variable, per capita GNP($) expressed in PPP. ED is the gross enrollment ratio in secondary education. D1 is a dummy variable representing the EC market, D2 is a dummy variable representing the NAFTA market, and LAN is a dummy variable representing English-speaking countries including former English-speaking colonies.
PPPGNP is included in the model to represent the size of the host country's market. This variable is an important variable in making market-seeking FDI. W reflects the labor cost of the host country whereas ED indicates the quality of labor. Cost-reducing FDI is considerably affected by these variables. R represents the opportunity cost of financing FDI in the host country, whereas EX represents of the level of foreign exchange risk. T can be a critical variable in determining whether Korean firms export or make FDI. D1 and D2 are included in the model to measure the effect of formation of the trade blocs while LAN is included to see whether English-speaking makes any differences in the advance of Korean firms. Korean FDI figures are available for more than 100 countries from the Export-Import Bank of Korea. However, our sample size is limited to 72 due to missing values on some independent variables. Data on GNP, EX, R and W are obtained from World Development Indicators 2000 CD-ROM.
This model is estimated with Korean FDI data over the period of 1994-1997, the period of the most active Korean FDI. We did not include later years because Korean FDI was critically affected by the 1998 Asian financial crisis. Since FDI flows into individual countries vary drastically from year to year, the cumulative FDI
flows for the period of 1994-1997 are used in this study. For the independent variables, either their averages or mid-point year (1996) figures are used. Some studies have used a conditional logit model to determine the location selection. However, by limiting the variance of FDI to that of a dichotomous variable, this approach does not explain how large FDI flows are going to each country. Therefore, we apply the OLS regression with the dollar values of FDI for the dependent variable. Underlying assumption of this study and its model is that there exists some optimal level of FDI in each host country. This study tries to identify not only the choice of location but also the optimal level of FDI in each host country. This aspect differentiates this study from other locational choice models.
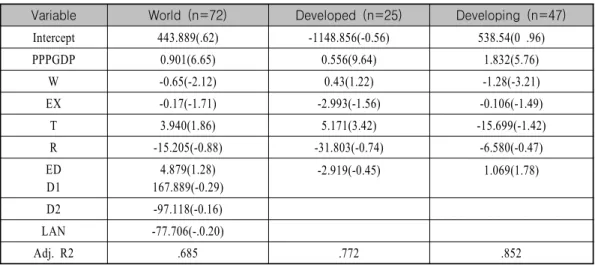
The regression equations explaining the variation in Korean FDI across countries are presented in Table 7 for three different sets of data, - world, advanced countries, and less advanced countries. For the world data set, two variables, PPPGNP and W, are statistically significant at the one percent or five percent levels, while other two variables, EX and T, are significant at the 10 percent level. The remaining variables - D1, D2, ED, LAN and R - turn out to be statistically insignificant. All significant variables have expected signs; Larger market size and higher tariff rate have positive effect on Korean FDI to the host country, while higher wage rate and more volatile exchange rate discourage Korean FDI flows into the host country.
The insignificance of R is expected with globalization of financial markets and the high degree of mobility of financial capital in recent years. The negative sign and the insignificance of D1, and D2 indicate that Korean FDI has not necessarily aimed at breaking through the two major economic blocs. This finding is in contrast to Japanese FDI (See Park, 2003). The variable ED, though insignificant, has an expected positive sign; the higher the level of education of the host country, the more Korean FDI. Since lower coefficient of determination (R2) is expected because of the nature of cross-sectional data, adjusted R2 of .685 is indicative of a good fit of the model.
Three variables, D1, D2 and LAN, are deleted for the regressions on the two subsets of the data because of their disappointing results from the regression on the whole data set. For the data set of advanced countries, the variable W is no longer significant, while the variable T (tariff) changes from the significance at the 10 percent level to the significance at the one percent level. This finding implies that Korean FDI into the advanced countries are mainly marketing-seeking and technology-seeking FDI so that the tariff rate matters, but the wage rate does not. The significance of PPPGNP indicates that Korean firms consider the size of market as an important factor in determining their investment abroad into advanced countries. Loree and Guisinger (1995) also obtained no significance of the wage rate for the U.S. overall FDI.
For the data set of less advanced countries, the variable W stands out as a significant variable, and the significance of variable T diminishes. The variable ED changes from an insignificant coefficient to a significant one. Korean FDI into less advanced countries is mainly to take advantage of lower labor costs, not to secure
local markets. Since the motive for such FDI is not for local market creation and expansion, tariff rates do not play an important role in determining Korean FDI into less advanced countries. Two distinctive patterns of Korean FDI can be derived from the regression results; low-cost resource-seeking FDI flow into less advanced countries and marketing-seeking and technology-seeking FDI flows into advanced countries including the U.S.
and Europe. Therefore, it may not be desirable to use a pooled data of both advanced countries and less advanced countries in explaining Korean FDI behaviors.
Table 7. Regression Equations Explaining Determinants of Korean FDI
Variable World (n=72) Developed (n=25) Developing (n=47)
Intercept 443.889(.62) -1148.856(-0.56) 538.54(0 .96)
PPPGDP 0.901(6.65) 0.556(9.64) 1.832(5.76)
W -0.65(-2.12) 0.43(1.22) -1.28(-3.21)
EX -0.17(-1.71) -2.993(-1.56) -0.106(-1.49)
T 3.940(1.86) 5.171(3.42) -15.699(-1.42)
R -15.205(-0.88) -31.803(-0.74) -6.580(-0.47)
ED D1
4.879(1.28) 167.889(-0.29)
-2.919(-0.45) 1.069(1.78)
D2 -97.118(-0.16)
LAN -77.706(-.0.20)
Adj. R2 .685 .772 .852
t values in parentheses
3) Conclusion
Japanese FDI strategy has gone through three different stages; from natural resource-seeking investment in the 1950s and 1960s to market-expansion investment in the 1970s and 1980s to a combination of cost-reducing (low-cost labor-seeking) investment and market-penetrating investment in the 1990s. During the 1950s and 1960s, Japanese FDI was very limited in its number and size due to Japan's weak economy after the Second World War and trade deficit problem. Japan's limited FDI during these two decades was concentrated on resource development to supplement its resource-poor economy. As Japanese economy grew stronger and gained international competitiveness in the 1970s and 1980s, its trade surplus swelled, promoting a surge in FDI. To circumvent trade frictions including voluntary exports restraint, Japan FDI in the developed countries rose drastically during this period. In 1989, the U.S. and Europe accounted for 70 percent of Japan's total FDI. All three major Japanese automobile makers, Toyota, Nissan, and Honda, made their presence in the U.S. in the
1980s. Some of Japanese FDI went to Asia, primarily, East Asia, to take advantage of low-cost production. As the 1990s rolled around, a change was seen in Japanese FDI strategy due to the appreciation of Japanese yen.
Japanese FDI was made in Asia to offset higher domestic production costs, and investment in the U.S. and Europe to deal with a resurgence of regional economic integration.
In evaluating the performance of Japanese FDI, higher profitability has been achieved by overseas operations on the whole than domestic operations. The average ratio of ordinary profit to sales from overseas operations for the period of 1989-1993 was 3.88 percent for all industry and 4.46 percent for manufacturing compared to the profit rate from domestic operations of 2.24 percent for all industry and 3.4 percent for manufacturing. Japanese FDI as a way of diversifying investment by Japanese firms paid off well and partially offset decline in domestic profits due to recession in Japan. Particularly noteworthy is the high profitability obtained by Japanese subsidiaries in Asia. Investment efficiency measured by the ratio of net profit after tax to capital in manufacturing averaged at 14.3 percent in Asia for the five year period from 1989 to 1993 compared to -3.4 percent in the U.S. and -5.3 percent in Europe. This explains not only why active Japanese FDI continues in Asia but also why reinvestment far exceeds direct investment in Asian manufacturing ($5,445 million vs. $3,859 million in 1993). However, the scantiness of Japanese FDI in Eastern Europe indicates that Japanese firms are less aggressive in expanding into new and untested markets than their counterparts in Korea.
A breakdown of sales of Japanese foreign affiliates by sector in manufacturing shows that transport equipment and electrical machinery accounted for more than 50 percent of the total sales. Transport equipment is the major sector in the U.S.; electrical machinery dominates in Asia; and in Europe, three sectors, transport equipment, electrical machinery, and chemicals, are evenly represented. A change in sales patterns of Japanese foreign affiliates can be observed. Traditionally Japanese FDI into North America and Europe was for local market sales while Japanese FDI into Asia was for export-oriented production. Recently Japanese subsidiaries in any region tend to serve three markets - the Japanese domestic market, the local market in a host country, and export sales to a third country. Japanese subsidiaries in Asia are most active in serving all three markets equally whereas sales of Japanese subsidiaries in the North America and Europe are still dominantly in their respective local markets.
Korean FDI behavior has gone through four different stages; from the learning stage with small investments in the 1970s, to natural resource-seeking investment in the early and mid 1980s, to the growth stage in the late 19980s and the early 1990s, to the maturity stage of the mid and late 1990s. The last two stages are characterized by a combination of cost-reducing investment and market-seeking investment. During the 1970s Korean FDI was very limited in its number and size due to Korea's relatively week economy and its trade deficit problem. As Korean economy grew stronger and gained international competitiveness in the 1980s, its trade balance changed from deficits to surpluses, promoting FDI outflows.