Development of a Microsatellite Marker Set for the Individual Identification and Parentage Verification of Korean Native Black Goats
Sang-Hoon Lee
1†, Ho-Chan Kang
2†, Sung-Soo Lee
1, Jinwook Lee
1, Eun-Ho Kim
2, Hyun-Cheol Myung
2, Kwan-Woo Kim
1* and Hyun-Tae Lim
2,3*
1Animal Genetics Resources Research Center, National Institute of Animal Science, RDA, Hamyang 50000, Korea
2Department of animal science, Gyeongsang National University, Jinju 52828, Korea
3Institute of Agriculture and Life Science, Gyeongsang National University, Jinju 52828, Korea Received September 3, 2020 /Revised September 22, 2020 /Accepted October 7, 2020
The Korean native black goat (Capra hircus coreanae) is the goat species to be officially registered in Korea under the Food and Agriculture Organization. The object of this study is to establish a set of microsatellite (MS) markers for the individual identification and parentage verification of goats. In this study, we analyzed alleles of MS markers in crosses between Korean native black goats and crossbred goats (n=304 animals), and, based on the diversity of alleles for each marker, we selected 11 MS mark- ers for individual identification and parentage verification. Using these 11 MS markers, the proba- bilities of different individuals with the same genotype being found within random and half-sib mat- ing populations were 5.58×10
-10and 1.15×10
-7, respectively. The parentage verification accuracy was 0.999996 when information about the parents was available and 0.999833 with no information. Thus, even given the total rearing population of 576,150 animals in South Korea, we concluded that these markers could be used for the individual identification and parentage verification of goats. Moreover, by analyzing the genetic relationships between the four lines of Korean native black goats and the crossbred goats, we verified the genetic characteristics of Korean native black goats, confirming their conservation value as a unique genetic resource.
Key words : Goat, identification, microsatellite marker, multiplex PCR, parentage test
†Authors contributed equally.
*Corresponding authors
*Tel : +82-55-772-1945, Fax : +82-55-772-1949 E-mail : [email protected] (Hyun-Tae Lim) Tel : +82-55-960-3540, Fax : +82-55-960-3590 E-mail : [email protected] (Kwan-Woo Kim)
This is an Open-Access article distributed under the terms of the Creative Commons Attribution Non-Commercial License (http://creativecommons.org/licenses/by-nc/3.0) which permits unrestricted non-commercial use, distribution, and reproduction in any medium, provided the original work is properly cited.
서 론
국내 재래흑염소는 국립축산과학원 가축유전자원센터에서 보존하는 장수, 통영 및 당진 축군 3계통과 경상대학교 부속 동물사육장에서 보존하고 있는 경상대 축군 1계통이 국제연 합 식량농업기구(FAO)에서 운영하는 가축다양성정보시스템 (DAD-IS, http://www.fao.org/home/en/)에 등록되어 총 4 계통이 유지되고 있다.
농림축산식품부 농업경영체 등록정보 조회 서비스 (AGRIX, http://uni.agrix.go.kr/)에서 제공하는 정보에 의하 면 국내 사육 염소의 규모는 2016년에 398,487두, 2019년에 576,150두로 귀농·귀촌 인구의 증가와 가축사육 농가들의 축종 전환 등으로 사육 규모가 증가하고 있으며, 점점 전업화 되어
가고 있다[16].
하지만 1990년대에 있었던 World Trade Organization (WTO) 협약 이후, 해외 염소의 수입 품종이 도입되어[28], 재래흑염소 사육농가에서 육량증대를 위해 해외 대형 육용 염소 품종과의 교배가 이루어져 재래흑염소만의 특징을 잃어가는 추세이다 [16].
국내에서 염소고기가 과거에는 주로 약용으로 이용되었던 것이 염소고기의 소비패턴이 다변화되어 탕, 전골, 구이 등으 로 소비 형태도 변화되고 있으며, 건강식품으로도 주목 받고 있다 [18]. 또한 농림축산검역본부에서 제공하는 자료에 의하 면 2019년에 수입된 염소고기는 1,207,981.3 kg이며, 국내에서 도축된 염소고기는 1,256,175.6 kg으로 조사되었으며 매년 수 입물량과 도축물량이 증가되고 있는 추세이다. 또한, 2018년 에 국립농산물품질관리원은 원산지를 속인 염소고기 적발업 체의 수가 2017년 대비 0건에서 20건으로 늘었다고 보고하였 으나, 아직 염소의 혈통등록 시스템과 염소고기 유통시스템 등이 아직 구축되어 있지 않아 향후 수입산 염소고기의 일부 가 국내산으로 둔갑되어 소비될 수도 있을 것으로도 예상된 다. 따라서 소비자들에게 흑염소 품종에 대한 차별화 전략과 국내 토종 재래흑염소의 브랜드화를 위하여 명확한 개체식별 분석 기술 개발이 필요한 실정이다.
염소의 유전적 다양성은 microsatellite [6-8], mitochondrial
DNA [8-29], functional genes [12-24], 그리고 genome-wide SNPs [13, 22, 23] 등의 분자 표지인자의 여러 유형으로 평가되 고 있다. 그 중 microsatellite (MS) marker는 일정 염기서열이 반복되는 특징을 이용해 유전적 다양성 평가에 활용되어 왔으 며, Polymerase Chain Reaction (PCR) 방법 중에 여러 개의 marker를 혼합하는 multiplex PCR 방법으로 간편하고 효율적 으로 대립유전자형 분석이 가능하다. 이와 같은 방법으로 포 유류, 어류 등의 다수의 동물들을 대상으로 하는 집단유전학 분야에서 유전적 다양성을 통한 계통 간 및 계통 내의 유전적 다양성과 연관성 분석에 중요한 DNA marker로 활용되고 있 다[1, 3, 4, 9, 14, 17, 20].
이에 본 연구는 MS marker를 활용한 대립유전자형 분석을 통해 marker별 대립유전자형의 출현빈도를 토대로 marker 별 다형성과 동일개체 출현확률 및 친자감정률 추정을 통해 재래 흑염소의 개체식별과 친자확인이 가능한 MS marker set을 선 발하고자 본 연구를 수행하였다.
재료 및 방법
공시동물
본 실험에 사용한 염소는 농촌진흥청 국립축산과학원 가축 유전자원센터에서 사육하고 있는 재래흑염소인 당진 계통 71 두, 장수 계통 89두, 통영 계통 116두와 경상대학교 부속 동물 사육장에서 사육하고 있는 재래흑염소인 경상대 계통 15두 및 농가에서 사육하고 있는 외래교잡종 13두로 총 304두이고, 이들로부터 추출한 genomic DNA를 시료로 이용하였으며, 공 시동물은 농촌진흥청 국립축산과학원의 동물실험계획서에 의거 동물보호법 및 국립축산과학원 동물시험 윤리위원회에 서 승인된 동물실험방법(승인번호: 2019-320)에 따라 수행되 었다.
MS marker의 선발
본 연구에 사용된 MS marker는 National Center for Bio- technology Information (NCBI; https://www.ncbi.nlm.nih.
gov/)에 보고된 염소 MS marker와 선행 연구 결과를 바탕으 로 29종을 선발하였다.
PCR 조성 및 MS marker 분석
MS marker set에 적용할 MS marker를 선발하기 위하여, 수집한 염소 304두의 genomic DNA 중에 273두의 genomic DNA를 이용하여 29종의 MS marker의 기초 분석을 실시하였 다. MS marker의 PCR은 template DNA 2 μl (100 ng/μl), 10×buffer 2.5 μl, 10 mM dNTP 1.5 μl, MS marker primer (10 pmol/μl) 각각 1 μl, Taq DNA polymerase 0.2 μl (Genet- bio, Korea)에 증류수를 첨가하여 최종 부피를 25 μl로 조정한 다음 반응하였다. PCR 조건은 95℃에서 10분간 변성을 실시한
후 94℃에서 30초간 denaturation, MS marker 별 annealing 온도에 따라 57~63℃에서 30초간 annealing, 72℃에서 MS marker에 따라 30초에서 45초 간 extension 과정을 40회 반복 하였으며 72℃에서 5분간 신장시킨 후에 8℃에서 종료하였다.
PCR 산물은 자동염기서열 분석장치(ABI-3130xl, Applied Biosystems, USA)를 이용하여 크기별로 분류되도록 전기영동 하고, GeneScan version 5 (Applied Biosystems, USA)를 이용 하여 크기와 표식자의 종류별로 분류한 후 Microsoft Excel (Microsoft, USA)을 이용하여 자료를 취합하였다. MS marker 29종의 allele frequency, 다형성지수인 heterozygosity (H
e)와 Polymorphism Information Content (PIC) 등의 기초분석은 CERVUS Ver. 3.0.7 [19]을 이용하여 수행하였고, 그 결과를 바탕으로 재래흑염소 개체 및 친자확인을 위한 primer set을 구성하였다.
Multiplex PCR 조성 및 MS marker 분석
Multiplex PCR은 template DNA 2 μl (100 ng/μl), 10×buf- fer 3 μl, 10 mM dNTP 2.5 μl, MS marker primer mixture 8.25 μl (10 pmol /μl), HotStart (HS) Taq 1.25 Unit (Genetbio, Korea) 에 증류수를 첨가하여 최종 부피를 25 μl로 조정한 다 음 반응하였으며, PCR 조건은 95℃에서 15분간 denaturation 을 실시한 후 94℃에서 60초간 denaturation, 60℃에서 75초간 annealing, 72℃에서 60초간 extension을 10회 반복하였으며, 94℃에서 60초간 denaturation, 59℃에서 75초간 annealing, 72℃에서 60초간 extension을 10회 반복하였다. 그리고 94℃에 서 60초간 denaturation, 58℃에서 75초간 annealing, 72℃에 서 60초간 extension을 25회 반복한 후 65℃에서 30분간 신장 시킨 후에 8℃에서 종료하였다. Multiplex PCR 산물은 자동염 기서열 분석장치(Applied Biosystems, USA)를 이용하여 크기 별로 분류되도록 전기영동하고, GeneScan version 5 (Applied Biosystems, USA)를 이용하여 크기와 표식자의 종류별로 분 류한 후 Microsoft Excel (Microsoft, USA)을 이용하여 자료를 취합하였다.
통계 분석
Microsoft Excel을 이용하여 취합한 자료를 바탕으로, MS
marker들의 allele frequency, H
e와 PIC 등의 기초분석은
CERVUS Ver. 3.0.7 [19]을 이용하여 수행하였고, D
A유전적
거리지수 matrix의 추정과 대립유전자의 분포를 분석 프로그
램에 이용하기 위한 입력 자료 형태의 변환은 Microsatellite
Analyzer (MSA) Ver. 4.05 [7]를 이용하여 수행하였다[21]. 계
통 간의 D
A유전적 거리지수 matrix는 Neighbor-Joining (NJ)
방법[27]으로 계통 유연관계 tree를 추정하였고, NJ tree의 분
절점에 대한 확률 추정치는 1,000회 반복된 boostrap resam-
pling 방법을 이용하여 수행하였다. 최종적으로 NJ tree의 구
축과 모식화는 PHYLIP Ver. 3.695 package [10]를 이용하여
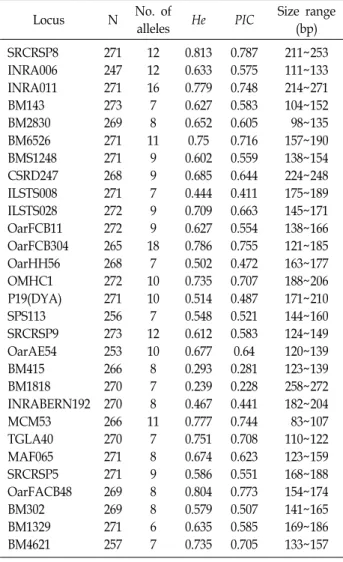
Table 1. Basic analysis of single PCR for each microsatellite markers
Locus N No. of
alleles He PIC Size range (bp) SRCRSP8
INRA006 INRA011 BM143 BM2830 BM6526 BMS1248 CSRD247 ILSTS008 ILSTS028 OarFCB11 OarFCB304 OarHH56 OMHC1 P19(DYA) SPS113 SRCRSP9 OarAE54 BM415 BM1818 INRABERN192 MCM53 TGLA40 MAF065 SRCRSP5 OarFACB48 BM302 BM1329 BM4621
271 247 271 273 269 271 271 268 271 272 272 265 268 272 271 256 273 253 266 270 270 266 270 271 271 269 269 271 257
12 12 16 7 8 11
9 9 7 9 9 18
7 10 10 7 12 10 8 7 8 11
7 8 9 8 8 6 7
0.813 0.633 0.779 0.627 0.652 0.75 0.602 0.685 0.444 0.709 0.627 0.786 0.502 0.735 0.514 0.548 0.612 0.677 0.293 0.239 0.467 0.777 0.751 0.674 0.586 0.804 0.579 0.635 0.735
0.787 0.575 0.748 0.583 0.605 0.716 0.559 0.644 0.411 0.663 0.554 0.755 0.472 0.707 0.487 0.521 0.583 0.64 0.281 0.228 0.441 0.744 0.708 0.623 0.551 0.773 0.507 0.585 0.705
211~253 111~133 214~271 104~152 98~135 157~190 138~154 224~248 175~189 145~171 138~166 121~185 163~177 188~206 171~210 144~160 124~149 120~139 123~139 258~272 182~204 83~107 110~122 123~159 168~188 154~174 141~165 169~186 133~157
Table 2. Basic analysis of 11 microsatellite markers of goat uti- lized in this study
Locus N No. of
alleles
Size range (bp)
Fluorescence- Dye BM4621
BM1329 INRA011
304 304 304
7 6 16
133~157 169~186 214~271
FAM
BM2830 BM6526 SRCRSP8
304 304 304
8 11 12
98~135 157~190 211~256
VIC
MAF065 SRCRSP5 CSRD247
304 304 304
8 9 9
110~160 164~191 219~253
NED
BM302 P19(DYA)
304 304
8 10
141~165
171~210 PET
수행하였으며[30], 추정법에 의한 F-통계량(F
ST, F
IT, F
IS및 pairwise-F
ST)은 FSTAT Ver. 2.9.4 [11]과 GENEPOP Ver. 4.7.3 [25]를 사용하여 얻었다. F-통계량 추정치에 대한 유의성 검정 은 Goudet [11]의 방법에 의하여 permutation test를 수행하였 으며, 계산된 확률값(P)는 type Ⅰ error를 줄이기 위하여 Bon- ferroni 방법을 적용하여 보정하였다. 추정된 F
ST, FIS의 값에 근거하여 무작위 교배집단과 반형매 교배집단에서의 동일개 체 출현확률과 친자감정 확률은 API-CALC Ver. 1.0 [2]을 이 용하여 추정하였다.
결과 및 고찰
개체식별과 친자확인을 위한 MS marker 선발
MS marker 별 allele frequency, 다형성지수 heterozygosity (H
e)와 Polymorphism Information Content (PIC) 등의 기초 분석 결과를 Table 1에 나타내었다. 가장 많은 allele을 나타낸 marker는 OarFCR304로 18개의 allele이 확인되었으며, H
e및
PIC가 가장 높은 것으로 확인된 MS marker는 SRCRSP8로
각각 0.829, 0.805로 확인되었다. 임 등[17]에 따르면 다수의 allele이 발현되더라도 allele의 출현빈도가 편향될 수 있다고 보고하였는데, OarFCR304는 다수의 allele이 발현되었지만 특 정 allele에 집중되어 marker의 다형성을 대변하는 H
e, PIC 값 은 SRCRSP8에서 더 높은 것으로 확인되어 이는 allele의 개수 와 빈도에 따른 추정 계산식에 의한 것으로 판단된다.
기초 분석 결과를 토대로 29종의 MS marker 중에서 PCR 조건, 산물의 크기 등 분석의 효율성 및 유전적 다형성 식별력 이 높은 11종의 MS marker를 선발하여[5, 8, 15, 26, 31], Touch down 방식의 multiplex PCR 조건을 확립한 후에 개체식별 및 친자확인에 활용할 MS marker set를 최종 선발하였다 (Table 2). Multiplex PCR에 의한 PCR 산물을 분석한 결과를 Fig. 1에 나타내었다.
선발된 11종 MS marker 개체식별 및 친자감정률 추정 추정된 F-통계량을 바탕으로 무작위 교배집단과 반형매 교 배집단이라 가정하고 MS marker 유전자형의 동일개체 출현 확률(probability of identity; PI와 probability of identity from half sibs; PI
harf-sibs)과 친자감정 확률(probability of parent ex- clusion when both parents are unconfirmed; PE
pu와 proba- bility of paternity exclusion; PE)을 추정한 결과를 Table 3에 나타내었다. 전체 11개의 MS marker를 사용할 경우 PI와
PIhalf-sibs의 추정값은 각각 5.58×10
-10, 1.15×10
-7이며, 이 값은 재 래흑염소 및 외래교잡종간의 집단을 적은 두수의 종모축들의 절대적인 유전적 기여에 의한 반형매 집단으로 가정하더라도 재래흑염소와 외래교잡종의 사육은 2019년 농림축산식품부 에 따르면 576,150두가 사육되고 있어 동일한 유전자형을 가 진 개체가 출현할 확률은 없는 것으로 판단된다.
11개 MS marker를 이용하여 친자감정을 실시할 경우 부모
정보가 있는 친자감정률(PE)은 0.999996, 부모의 정보가 없을
경우 친자감정률(PE
pu)은 0.999833으로 국내에 사육되는 576,150
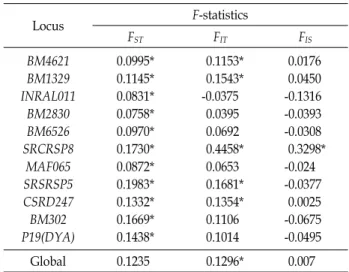
Table 4. Results of F-statistics of each microsatellite marker us- ing this study
Locus F-statistics
FST FIT FIS
BM4621 BM1329 INRAL011
BM2830 BM6526 SRCRSP8
MAF065 SRSRSP5 CSRD247 BM302 P19(DYA)
0.0995*
0.1145*
0.0831*
0.0758*
0.0970*
0.1730*
0.0872*
0.1983*
0.1332*
0.1669*
0.1438*
0.1153*
0.1543*
-0.0375 0.0395 0.0692 0.4458*
0.0653 0.1681*
0.1354*
0.1106 0.1014
0.0176 0.0450 -0.1316 -0.0393 -0.0308 0.3298*
-0.024 -0.0377
0.0025 -0.0675 -0.0495
Global 0.1235 0.1296* 0.007
* p<0.01
Fig. 1. Results of fluorescence marker analysis of multiplex PCR using ABI-3130xl.
두뿐만 아니라 추후 사육 개체가 증가하더라도 친자감정이 가능할 것으로 판단된다.
Table 3. The probability of identitiy (PI), the probability of iden- tity from half sibs (PIharf-sibs), probability of parent ex- clusion when both parents are unconfirmed (PEpu) and probability of paternity exclusion (PE) calculations of microsatellite marker genotypes based on F-statistics
Selected by PI PIhalf-sibs PEpu PE
11 MS 5.58×10⁻¹⁰ 1.15×10⁻⁷ 0.999833 0.999996
재래흑염소 계통별 근친도 분석
MS marker 별 F-통계량인 F
ST, F
IT, F
IS값은 Table 4에 작성하 였다. F
IS는 이형접합체의 감소 정도를 나타내는 척도로 근친 도 정도를 확인할 수 있는 지수이며, 양의 값은 근친도의 존재 를 음의 값은 근친도가 존재하지 않음을 내포한다. F
ST는 유전 적 부동(genetic drift)에 의한 부분 모집단의 이형접합체 감소 추이를 나타내는 고정 지수이며, F
IT는 전체집단에 대한 개체 들의 모든 근친도 값을 내포하는 지수로 F-통계량을 통하여 집단간 유전변이와 집단 내 개체들의 근친도를 파악한다. MS marker 별 계통 간 유전적 분화 정도를 나타내는 F
ST추정치는 0.1983에서 0.0758로 낮은 수치를 나타내었으며, 각 MS marker 에 대하여 유의적으로 계통 별 유전적 분화가 존재함을 확인할 수 있었다. 또한 개별 MS marker의 F
IS추정값에서 SRCRSP8
은 이형접합체 감소에 대하여 유의적인 것으로 확인하였다.
재래흑염소와 외래교잡종 간 계통분석
국내 재래흑염소 4종의 계통과 외래교잡종간 D
A유전적 거
리지수와 Pairwide-F
ST를 추정한 결과를 Table 5에 나타내었
다. D
A유전적 거리지수와 Pairwide-F
ST추정치 모두에서 가장
가까운 유전적 거리 지수를 나타내는 계통은 장수와 통영 계
DJ JS TY GG FG Fig. 2. Neighbor-joining tree method between the Korean native
black goat line and the foreign crossbred line using DA
genetic distance index analysis results. DJ : Dang-jin line, JS : Jang-su line, TY : Tong-yeong line, GG : Gyeongsang national university line, FG : Foreign crossbred line.
Table 5. DA genetic distance (above diagonal) and pairwise-FST (below diagonal) between the Korean native black goat line and the foreign crossbred line
Population DJ JS TY FG GG
DJ JS TY FG GG
0.1202*
0.1349*
0.1770*
0.2012*
0.3660
0.0598*
0.2084*
0.1037*
0.3611 0.2745
0.2440*
0.1520*
0.5909 0.5997 0.6228
0.2978*
0.4810 0.3777 0.4197 0.6865
* p<0.01
DJ : Dang-jin line, JS : Jang-su line, TY : Tong-yeong line, FG : Foreign crossbred line, GG : Gyeongsang National University line.
통으로 두 계통은 경상대 계통과 추정 유전적 거리지수가 가 까운 것으로 확인되었으며, 이는 지리적으로 인접한 것과 일 치하는 결과를 나타내었다. D
A유전적 거리지수를 토대로 PHYLIP ver. 3.695 package를 이용하여 NJ tree 모식화 결과 유전적 거리지수에서 확인한 것과 동일하게 장수 계통과 통영 계통이 하나의 그룹화 되는 것을 확인할 수 있었으며, 외래교 잡종은 국내 재래흑염소 계통과 확연히 다른 그룹으로 분류되 는 것을 확인할 수 있었다(Fig. 2).
본 연구의 결과를 바탕으로 11개의 MS marker set를 활용 한다면 재래흑염소 4계통(당진, 장수, 통영, 경상대) 및 농가에 서 사육중인 교잡종 염소에 대한 개체식별과 친자확인뿐만 아니라 계통간의 식별 또한 가능할 것으로 판단되어 국내 고 유의 토종 재래흑염소에 대한 개체관리, 육종, 개량 및 유전자 원 보존 기반 구축에 활용 될 수 있을 것으로 판단된다.
감사의 글
본 논문은 농촌진흥청 연구사업(PJ01431502)의 지원과 국 립축산과학원 전문연구원 과정 지원 사업에 의해 수행된 것입 니다.
The Conflict of Interest Statement
The authors declare that they have no conflicts of interest with the contents of this article.
References
1. Achmann, R., Curik I., Dovc, P., Kavar, T., Bodo, I., Habe, F., Marti, E., Solkner, J. and Brem, G. 2004. Microsatellite diversity, population subdivision and gene flow in the Lipizzan horse. Anim. Genet. 35, 285-292.
2. Ayres, K. L. and Overall, A. D. J. 2004. API-CALC 1.0: a computer program for calculating the average probability of identity allowing for substrucure, inbreeding and the presence of close relatives. Mol. Ecol. Notes 4, 315-318.
3. Ayub, Q., Mansoor, A., Ismail, M., Khaliq, S., Mohyuddin, A., Hameed, A., Mazhar, K., Rehman, S., Siddiqi, S., Papaioan- nou, M., Piazza, A., Cavalli-Sforza, L. L. and Mehdi, S. Q.
2003. Reconstruction of human evolutionary tree using pol- ymorphic autosomal microsatellites. Am. J. Phys. Anthropol.
122, 259-268.
4. Borrell, Y. J., Pineda, H., McCarthy, I., Vazquez, E., Sanchez, J. A. and Lizana, G. B. 2004. Correlations between fitness and heterozygosity at allozyme and microsatellite loci in the Atlantic salmon, Salmo salar L. Heredity 92, 585-593.
5. Bulut, Z., Kurar, E., Ozsensoy, Y., Altunok, V. and Nizam- lioglu, M. 2016. Genetic diversity of eight domestic goat populations raised in Turkey. Biomed. Res. Int. 2016, 2830394.
6. Câmara, T. S., Nunes, J. F., Diniz, F. M., Silva, G. R. and Araújo, A. M. 2017. Genetic diversity and relatedness be- tween Canindé and British Alpine goat breeds in Northeast- ern Brazil accessed by microsatellite markers. Genet. Mol.
Res. 16, https://doi. org/10.4238/gmr16019569.
7. Dieringer, D. and Schltterer, C. 2003. Microsatellite analyser (MSA): a platform independent analysis tool for large mi- crosatellite data sets. Mol. Ecol. Notes 3, 167-169.
8. E, G. X., Zhao, Y. J., Chen, L. P., Ma, Y. H., Chu, M. X., Li, X. L., Hong, Q. H., Li, L. H., Guo, J. J., Zhu, L., Han, Y. G., Gao, H. J., Zhang, J. H., Jiang, H. Z., Jiang, C. D., Wang, G. F., Ren, H. X., Jin, M. L., Sun, Y. Z., Zhou, P.
and Huang, Y. F. 2018. Genetic diversity of the Chinese goat in the littoral zone of the Yangtze river as assessed by micro- satellite and mtDNA. Ecol. Evol. 8, 5111-5123.
9. Fang, M., Hu, X., Jiang, T., Braunschweig, M., Hu, L., Du, Z., Feng, J., Zhang, Q., Wu, C. and Li, N. 2005. The phylog- eny of Chinese indigenous pig breeds inferred from micro- satellite markers. Anim. Genet. 36, 7-13.
10. Felsenstein, J. 2004. A package of programs for inferring
phylogenies (version 3.63). Available from http://evolution.
gs.washington.edu/phylip.html.
11. Goudet, J. 2001. FSTAT, a program to estimate and test gene diversities and fixation indices (version 2.9.3). Available from http://www.unil.ch/izea/software/fstat.html.
12. Gowane, G. R., Akram, N., Misra, S. S., Prakash, V. and Kumar, A. 2018. Genetic diversity of Cahi DRB and DQB genes of caprine MHC class Ⅱ in Sirohi goat. J. Genet. 97, 483-492.
13. Ilie, D. E., Kusza, S., Sauer, M. and Gavojdian, D. 2018.
Genetic characterization of indigenous goat breeds in Roma- nia and Hungary with a special focus on genetic resistance to mastitis and gastrointestinal parasitism based on 40 SNPs.
PLoS One 13, e0197051.
14. Jakse, J., Satovic, Z. and Javornik, B. 2004. Microsatellite var- iability among wild and cultivated hops (Humulus lupulus L.). Genome 47, 889-899.
15. Kim, J. Y., Jeong, S., Kim, K. H., Lim, W. J., Lee, H. Y. and Kim, N. 2019. Discovery of genomic characteristics and se- lection signature in Korean indigenous goats through com- parison of 10 goat breeds. Front. Genet. 10, 699.
16. Kim, K. W., Lee, J., Jeon, D., Lee, S. S., Kim, S. and Lee, S. H. 2019. Application of artificial insemination and preg- nancy diagnosis kit for Korea native black goats. JKAIS. 20, 446- 451.
17. Lim, H. T., Min, H. S., Moon, W. G., Lee, J. B., Kim, J. H., Cho, I. C., Lee, H. K., Lee, Y. W., Lee, J. G. and Jeon, J.
T. 2005. Analysis and selection of microsatellites markers for individual traceability system in Hanwoo. J. Anim. Sci.
Technol. 47, 491-500.
18. Lee, S. H., Lee, J., Jeon, D., Lee, S. S., Kim, S. and Kim, K. W. 2019. Morphological characteristics and growth per- formance of Korean native black goats. JKAIS. 20, 149-155.
19. Marshall, T. C., Slate, J., Kruuk, L. E. B. and Pemberton, J. M. 1998. Statistical confidence for likelihood-based pater- nity inference in natural populations. Mol. Ecol. 7, 639-655.
20. Metta, M., Kanginakudru, S., Gudiseva, N. and Nagaraju, J. 2004. Genetic characterization of the Indian cattle breeds, Ongole and Deoni (Bos indicus), using microsatellite markers - a preliminary study. BMC. Genet. 5, 16.
21. Nei, M. 1972. Genetic distance between populations. Am.
Nat. 106, 283-292.
22. Nicoloso, L., Bomba, L., Colli, L., Negrini, R., Milanesi, M., Mazza, R., Sechi, T., Frattini, S., Talenti, A., Coizet, B., Chessa, S., Marletta, D., D'Andrea, M., Bordonaro, S., Ptak, G., Carta, A., Pagnacco, G., Valentini, A., Pilla, F., Ajmone-Marsan, P.
and Crepaldi, P. Italian Goat Consortium. 2015. Genetic di- versity of Italian goat breeds assessed with a medium-den- sity SNP chip. Genet. Sel. Evol. 47, 62.
23. Onzima, R. B., Upadhyay, M. R., Mukiibi, R., Kanis, E., Groenen, M. A. M. and Crooijmans, R. P. M. A. 2018.
Genome-wide population structure and admixture analysis reveals weak differentiation among Ugandan goat breeds.
Anim. Genet. 49, 59-70.
24. Pitarch, J. L., Raksa, H. C., Arnal, M. C., Revilla, M., Martínez, D., Fernández de Luco, D., Badiola, J. J., Goldmann, W. and Acín, C. 2018. Low sequence diversity of the prion protein gene (PRNP) in wild deer and goat species from Spain. Vet.
Res. 49, 33.
25. Raymond, M. and Rousset, F. 1995. GENEPOP (version 1.2):
population genetics software for exact tests and ecumeni- cism. J. Heredity 86, 248-249.
26. Rout, P. K., Thangraj, K., Mandal, A. and Roy, R. 2012.
Genetic variation and population structure in Jamunapari goats using microsatellites, mitochondrial DNA, and milk protein genes. Scientific World Journal 2012, 618909.
27. Saitou, N. and Nei, M. 1997. The neighbor-joining method:
a new method for reconstructing phylogenetic trees. Mol.
Biol. Evol. 4, 406-425.
28. Son, Y. 1999. Production and uses of Korean native black goat. Small Ruminant Res. 34, 303-308.
29. Tarekegn, G. M., Tesfaye, K., Mwai, O. A., Djikeng, A., Dessie, T., Birungi, J., Osama, S., Zergaw, N., Alemu, A., Achieng, G., Tutah, J., Mutai, C., Njuguna, J. and Mwacharo, J. M. 2018. Mitochondrial DNA variation reveals maternal origins and demographic dynamics of Ethiopian indigenous goats. Ecol. Evol. 8, 1543-1553.
30. Weir, B. S. and Hill, W. G. 2002. Estimating F-statistics. Annu.
Rev. Genet. 36, 721-750.
31. Wang, G. Z., Chen, S. S., Chao, T. L., Ji, Z. B., Hou, L., Qin, Z. J. and Wang, J. M. 2017. Analysis of genetic diversity of Chinese dairy goats via microsatellite markers. J. Anim.
Sci. 95, 2304-2313.
초록:재래흑염소 개체식별과 친자확인을 위한 Microsatellite Marker Set 개발
이상훈
1†․강호찬
2†․이성수
1․이진욱
1․김은호
2․명철현
2․김관우
1*․임현태
2,3*
(1농촌진흥청 국립축산과학원 가축유전자원센터, 2경상대학교 농업생명과학대학 축산학과, 3경상대학교 농업생명
과학연구원)