Impact of Reconstructed Gridded Product of Global Wind/Wind-stress Field derived by Satellite Scatterometer Data
*Makoto Koyama, Kunio Kutsuwada, and Naoki Morimoto School of Marine Science and Technology, Tokai University, 3-20-1, Orido, Shimizu, Shizuoka 424-8610, Japan
E-mail: [email protected] / [email protected] Tel.: +81-54-337-0196 / Fax : +81-54-336-1434
Abstract:
The advent of high resolution products of surface wind and temperature derived by satellite data has permitted us to investigate ocean and atmosphere interaction studies in detail. Especially the Kuroshio extension region of the western North Pacific is considered to be a key area for such studies. We have constructed gridded products of surface wind/wind stress over the world ocean using satellite scatterometer (Qscat/SeaWinds), available as the Japanese Ocean Flux data sets with Use of Remote sensing Observation (J-OFURO). Using new data based on improved algorithm which have been recently delivered, we are reconstructing gridded product with higher spatial resolution. Intercom- parison of this product with the previous one reveals that there are some discrepancies between them in short-period and high wind-speed ranges especially in the westerly wind region. The products are validated by not only comparisons with in-situ measurement data by mooring buoys such as TAO/TRITON in the tropical Pacific and the Kuroshio Extension Observation (KEO) buoys, but also intercomparison with numerical weather prediction model (NWPM) products (the NRA-1 and 2). Our products have much smaller mean difference in the study areas than the NWPM ones, meaning higher reliability compared with the NWPM products.
Using the high resolution products together with sea surface temperature (SST) data, we examine a new type of relationship between the lower atmosphere and upper ocean in the Kuroshio Extension region. It is suggested that the spatial relation between the wind speed and SST depends upon, more or less, the surrounding oceanic condition.
KEY WORDS: scatterometer, wind-stress products, Kuroshio Extension
1. Introduction
Since the beginning of 1990s, satellite scatterometer has supplied surface wind vectors on the open ocean continuously to us. In particular, the SeaWinds on board QuikSCAT (Qscat/SeaWinds) has given them over the almost whole ocean with highly spatial reso- lution from July in 1999 to the present, and has made air-sea interaction studies develop drastically (e.g.
Chelton, 2003; Xie, 2004; Nonaka and Xie, 2003).
We have constructed gridded products of surface wind/wind-stress vectors over the world ocean using the scatterometer data, and they have been available as the Japanese Ocean Flux data sets with Use of Remote-sensing Observation (J-OFURO) data set, together with heat flux components, in our web site (http://dtsv.scc.u-tokai.ac.jp/j-ofuro/). Our previous studies have investigated their reliabilities through
comparisons with in-situ measurements by moored buoys on open ocean (Kasahara et al., 2003; Kutsu- wada et al., 2004), and revealed that the Qscat product has relatively high reliability compared with numeri- cal weather prediction model (NWPM) products (NRA-1 & 2). Recently, the Kuroshio Extension Observatory (KEO) buoy permitted us to make similar validation study in the mid- and high-latitudes where there had been few moored buoys using (Kutsuwada et al., 2006).
In this study, using the Qscat/SeaWinds swath data based on the new algorithm provided by the NASA Physical Oceanography Distributed Active Archive Center (PO.DAAC) at the Jet Propulsion Laboratory (See PODAAC website), we reconstruct gridded pro- ducts of wind/wind-stress over the world ocean.
We will validate these reconstructed products by
comparison with in-situ data and intercomparison with the NWPMs. Another examination will be made for the air-sea interaction in the Kuroshio Extension region by spatial correlations between this surface wind product and sea surface temperature (SST).
2. Data
2.1. Gridded wind/wind-stress products
In reconstruction of gridded products of surface wind/wind-stress vectors, we use the swath data of the Qscat/SeaWinds which have been delivered by the PO-DAAC/JPL. We call this new product as Qscat/J- OFURO v2, relative to v1 for our previous one. The products cover the whole ocean (60°N-80°S) and have spatial and time resolutions of 1°x 1°grid and one day.
Construction procedures are the same as those in Kutsuwada (1998) and Kubota et al.(2002). We also use gridded products of Qscat/SeaWinds which have been supplied by the Institut Francais de Recherche pourl’Exploitation de la Mer (IFREMER).
The NWPM product has been supplied by the National Center for Environmental Prediction Nation- al Center for Atmospheric Research (NCEP/ NCAR) reanalysis(http://www.cdc.noaa.gov/cdc/data.ncep.rea nalysis.surfaceflux.html) (Kalnay et al., 1996). Ano- ther product has been available by the NCEP-Depart- ment of Energy (DOE) as the NCEP reanalysis-2 (http://www.cdc.noaa.gov/cdc/data.ncep.reanalysis2.g aussian.html). They have temporal and spatial resolu- tions of 6 hours and 2.5°x 2.5°, respectively. The wind stress is calculated from each 6-hourly wind using the drag coefficient based on Large and Pond (1981).
These are referred to as NRA-1 and 2.
2.2. In-situ measurement (moored buoys) data
Time series of surface wind are used for validation of our products. One is obtained by a moored buoy (144.5°E, 32.3°N) in the Kuroshio Extension region deployed by the NOAA/Pacific Marine Environmental Laboratory (PMEL; chief scientist: Dr. Meghan Cro- nin). The other is obtained by the Tropical Atmo- sphere and Ocean(TAO) buoys in the tropical Pacific (McPhaden et al., 1998) (http://www.pmel. noaa.gov/
tao/index.shtml). Hourly or 10-minute wind, air-temp- erature and humidity are used to calculate 10-m wind by the procedure based on the similar procedure to that for the KEO buoy.
Winds by these buoy measurements are converted into 10m level and then daily-averaged wind stress is
calculated using the new procedure (LKB-3) depend- ing upon atmospheric stability (Liu et al., 1979).
2.3. Sea surface temperature (SST) data
To investigate the air-sea interaction mechanism in the Kuroshio Extension region, we use the following SST product with high spatial resolution. This is derived by the Tropical Rainfall Measuring Mission (TRMM) Microwave Imager (TMI), and has spatial resolution of 0.25° over the whole tropical region every 3 days. Gridded products with different time resolution (daily, 3-day, weekly and monthly) from 1997 to the present are available in the website of the Remote Sensing Systems (http://www.ssmi.com/tmi/
tmi_browse.html). In this study, daily products are used to construct monthly and annual mean averages.
3. Result
3.1. Validation of gridded wind products
When we compare in mean and standard deviation (SD) fields by our two Qscat/J-OFURO products (v1 and v2), we can find significant difference in the SD distribution especially in the northern portion of west- erly wind region, even if there are little discrepancies in the mean field. Distribution of the Root-Mean-- Square difference(RMSD) between two products (not shown) exhibits values exceeding 2.0 m s-1 in this region. However, the RMSD for low-pass filtered (3- month running mean) time series are smaller than 0.4 m s-1 in the whole region, suggesting significant discrepancies in the short-period range between the two products.
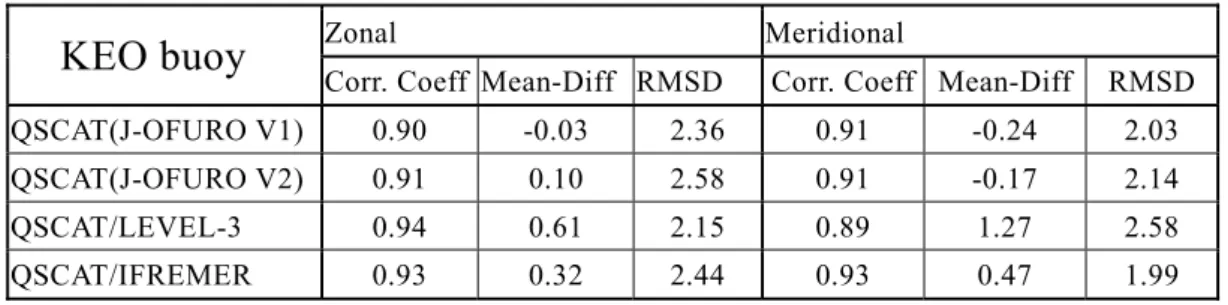
In validations for our products by comparison with the KEO and TAO buoy measurements, statistical values (mean and RMS differences and correlations) are listed in Table 1 and 2, respectively.
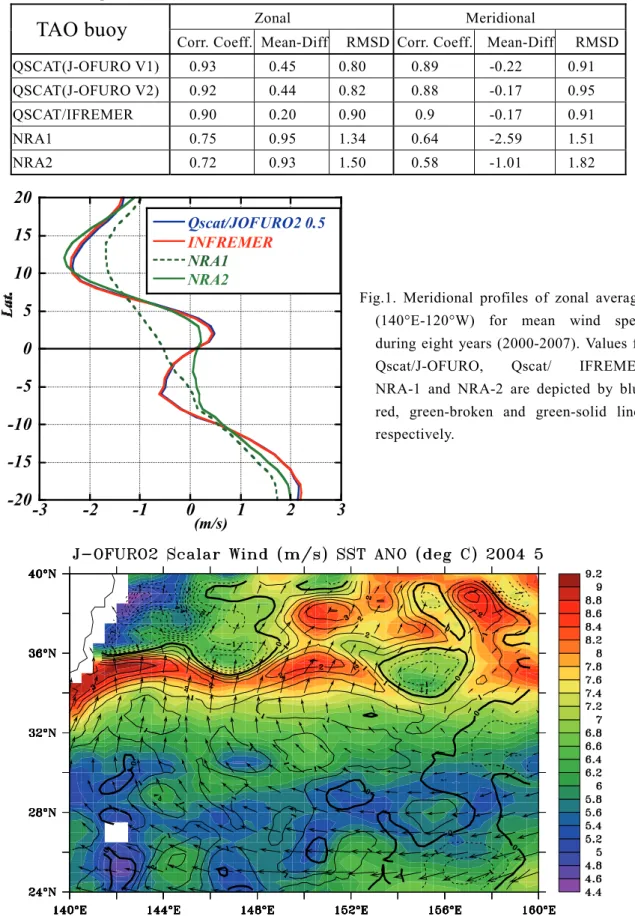
The values for our two products have no significant differences between v1 and v2, meaning that they have almost similar reliabilities. On the other hand, the NWPM products have larger mean differences not only for the KEO buoy but also for the TAO buoys, especially in the meridional components, than the Qscat’s. The meridional wind components by various products are averaged zonally (140°E-140°W) and their meridional profiles are compared (Fig. 1). In this comparison, the NWPM products have different magnitudes from the Qscat’s, which means that the NWPMs have less reliabilities than the Qscats.
4.2. Investigation of air-sea interaction in the
Kuroshio Extension region
To examine a new type of air-sea interaction (Xie, 2004; Nonaka and Xie, 2003), we focus the Kuroshio Extension region because highly active air-sea coupling is considered to be occurred in this region.
In daily SST field with the high resolution (0.25°
x0.25°) by the TRMM/TMI data, anomalies are derived by removing zonal means of meridional gradient, probably due to the effect of differential heating. Spatial correlation is calculated between the wind speed and SST for each month during our study period (Jun 2002–Dec 2007). Significant positive cor- relations are found in the Kuroshio Extension region in some months, and an example of them is shown in Fig.2, showing the linkage between high wind speed (colors) and positive SST anomaly (contours) and vice versa. These spatial correlation features may be related to the meteorological condition with synoptic to basin-scale around the region. Further examination will be made for this problem.
Acknowledgements
This study was financially supported by the Japan Aerospace Exploration Agency.
References
Chelton, D.B., M.G. Schlax, M.H. Freilich and R.F Milliff, 2004. Satellite measurements reveal persist- ent small scale features in ocean winds, Science, 303, 978-983.
Kalnay, E., and Coauthors, 1996. The NCEP/ NCAR 40-Year Reanalysis Project, Bull. Amer. Meteor.
Soc., 77, 437-471.
Kasahara, M., K. Kutsuwada, K. Aoki and S. Takeda, 2003. Construction and validation of gridded surface wind/wind-stress product over the world ocean using satellite scatterometer data, J. School Mar. Sci. Tech., 1(1), 79-92. (in Japanese with English abstract)
Kubota, M., N. Iwasaka, S. Kizu, M. Konda, and K.
Kutsuwada, 2002. Japanese Ocean Flux Data Sets with Use of Remote Sensing Observations (J- OFURO). J. Oceanogr. 58, 213-225.
Kutsuwada, K., 1998. Impact of wind/wind stress field in the North Pacific constructed by ADEOS/
NSCAT data. J Oceanogr. 54, 443- 456.
Kutsuwada, K., M. Kasahara and K. Aoki, 2004.
Gridded surface wind-stress product over the world ocean constructed by satellite scatterometer data and its comparison with NWP products, Proc. Pan Ocean Remote-sensing Conference 2004, 68(2), 348-354.
Kutsuwada, K, N. Morimoto and M. Koyama, 2006.
Validation study of gridded product of surface wind/ wind-stress derived by satellite scatterometer data in the western North Pacific using Kuroshio Extension Observatory Buoy, Proc. PORSEC 2006.
Large, W.G. and S. Pond, 1982. Sensible and latent heat flux measurements over the ocean, J. Phys.
Oceanogr., 12, 464-482.
Liu, W. T, K. B. Katsaros and J. A. Businger, 1979.
Bulk parameterization of the air-sea exchange of heat and water vapor including the molecular constraints at the interface, J. Atmos. Sci., 36, 1722-1735.
McPhaden, M.J. and & Coauthors, 1998. The Tropical Ocean-Global Atmosphere observing system: A decade of progress, J.Geophys.Res., 103(C7), 14169- 14240.
Nonaka, M. and S.-P. Xie, 2003. Covariations of sea surface temperature and wind over the Kuroshio and its extension: Evidence for ocean-to-atmosphere feedback, J. Climate, 16, 1405-1413.
Xie, S.-P., 2004. Satellite observations of cool ocean- atmosphere interaction, Bull. Amer.Meteor. Soc., 196, 195-208.
Table 1. Statistical values in comparison with KEO buoy wind measurements Units for mean and root-mean-square (RMS) differences are m s-1.
Zonal Meridional
KEO buoy
Corr. Coeff Mean-Diff RMSD Corr. Coeff Mean-Diff RMSD QSCAT(J-OFURO V1) 0.90 -0.03 2.36 0.91 -0.24 2.03
QSCAT(J-OFURO V2) 0.91 0.10 2.58 0.91 -0.17 2.14
QSCAT/LEVEL-3 0.94 0.61 2.15 0.89 1.27 2.58
QSCAT/IFREMER 0.93 0.32 2.44 0.93 0.47 1.99
Table 2. Statistical values in comparison with TAO buoy wind measurements. Units for mean and root-mean-square (RMS) differences are m s-1.
Zonal Meridional
TAO buoy
Corr. Coeff. Mean-Diff RMSD Corr. Coeff. Mean-Diff RMSD QSCAT(J-OFURO V1) 0.93 0.45 0.80 0.89 -0.22 0.91 QSCAT(J-OFURO V2) 0.92 0.44 0.82 0.88 -0.17 0.95
QSCAT/IFREMER 0.90 0.20 0.90 0.9 -0.17 0.91
NRA1 0.75 0.95 1.34 0.64 -2.59 1.51
NRA2 0.72 0.93 1.50 0.58 -1.01 1.82
-3 -2 -1 0 1 2 3
-20 -15 -10 -5 0 5 10 15 20
Qscat/JOFURO2 0.5 INFREMER
NRA1 NRA2
(m/s)
Fig.2. Distributions of Qscat/J-OFURO wind speed (colors) and TMI SST anomaly (contours) in May 2004.
Fig.1. Meridional profiles of zonal averages (140°E-120°W) for mean wind speed during eight years (2000-2007). Values for Qscat/J-OFURO, Qscat/ IFREMER, NRA-1 and NRA-2 are depicted by blue, red, green-broken and green-solid lines, respectively.