https://doi.org/10.4174/astr.2018.95.4.183 Annals of Surgical Treatment and Research
Prognostic influence of 3-dimensional tumor volume on breast cancer compared to conventional 1-dimensional tumor size
Ki-Tae Hwang1, Wonshik Han2, Sang Mok Lee3, Jaewoo Choi4, Jongjin Kim1, Jiyoung Rhu2, Young A Kim5, Dong-Young Noh2
1Department of Surgery, Seoul Metropolitan Government - Seoul National University Boramae Medical Center, Seoul, Korea
2Department of Surgery, Seoul National University College of Medicine, Seoul, Korea
3Gangdong Seoul Surgical Clinic, Seoul, Korea
4Hongseong Medical Center, Hongseong, Korea
5Department of Pathology, Seoul Metropolitan Government - Seoul National University Boramae Medical Center, Seoul, Korea
INTRODUCTION
Cancer staging plays a pivotal role in the battle against cancer. First and foremost, staging provides cancer patients
and their physicians with critical information and guidelines for understanding the prognosis, the likelihood of survival, the relevant timelines, and the best treatment approach. Developing and improving the cancer staging systems is a never-ending Reviewed
January February March April May June July August September October November December
Received December 28, 2017, Revised April 22, 2018, Accepted June 1, 2018
Corresponding Author: Ki-Tae Hwang
Department of Surgery, Seoul Metropolitan Government - Seoul National University Boramae Medical Center, 39, Boramae-Gil, Dongjak-gu, 20 Boramae-ro 5-gil, Dongjak-gu, Seoul 07061, Korea
Tel: +82-2-870-2275, Fax: +82-2-831-2826 E-mail: kiterius@snu.ac.kr
ORCID code: https://orcid.org/0000-0001-6597-3119
Copyright ⓒ 2018, the Korean Surgical Society
cc Annals of Surgical Treatment and Research is an Open Access Journal. All articles are distributed under the terms of the Creative Commons Attribution Non- Commercial License (http://creativecommons.org/licenses/by-nc/4.0/) which permits unrestricted non-commercial use, distribution, and reproduction in any medium, provided the original work is properly cited.
Purpose: The prognostic influence of 3-dimensional tumor volume (Tv) on breast cancer compared to conventional 1-dimensional tumor size (T) was investigated.
Methods: Analysis was performed on a cohort of 8,996 primary breast cancer patients who were initially diagnosed with TNM stage I–III. Tumor size was defined as the maximum tumor dimension, and Tv was calculated by the equation of (4π × r1 × r2 × r3)/3; r1, r2, and r3 were defined as half of the largest, intermediate, and shortest dimension of the tumor, respectively. Tv was classified into Tv1, Tv2, and Tv3 according to the cut off values of 2.056 cm3 and 20.733 cm3.
Results: The survival curves according to both the T and Tv categories were clearly differentiated (all P <0.001), as were those for staging by T and Tv (all P < 0.001). In T1 and T2 tumors, the Tv1 group showed superior survival over the Tv2 group (T1, P < 0.001; T2, P = 0.001). Univariate and multivariate analysis both indicated that Tv was a significant prognostic factor (both P < 0.001). The receiver operating characteristic curve showed that the area under the curves were 0.712 (P <
0.001) for Tv and 0.699 (P < 0.001) for T. Positive correlations were observed between the number of positive nodes and T (coefficient = 0.325; P < 0.001), and between the number of positive nodes and Tv (coefficient = 0.321; P < 0.001).
Conclusion: Tv classification works well for predicting the prognosis of breast cancer, and it is a better predictor than conventional T classification in several aspects. Further studies are needed to validate the practical usefulness of Tv classification in clinical settings.
[Ann Surg Treat Res 2018;95(4):183-191]
Key Words: Breast neoplasms, Prognosis, Survival analysis, Tumor burden
process [1]. Currently, the TNM classification system developed by the American Joint Committee on Cancer (AJCC) is the most widely accepted cancer staging system. The AJCC published its first cancer staging manual in 1977 [2], with the most recent version, the 8th edition, published in 2016 [1,3].
Regarding breast cancer, the T category is based primarily on the size of the invasive component of the cancer and the maximum size of a tumor focus is used as an estimate of disease volume. The largest contiguous dimension of a tumor focus is used, and small satellite foci of noncontiguous tumor are not added to the size. Invasive breast cancer has 3 T categories: T1: the tumor ≤ 20 mm at its greatest dimension, T2: the tumor > 20 mm but ≤ 50 mm at its greatest dimension, and T3: the tumor > 50 mm at its greatest dimension [1]. The cut off values of 20 mm and 50 mm have been adopted since the 1st edition of the AJCC manual was published, and there have been no changes regarding these cut off values to date.
Our hypothesis is that 3-dimensional tumor volume (Tv) might be a more appropriate measurement of tumor burden than the conventional 1-dimensional tumor measurement approach, though the T1 approach is more convenient than Tv in clinical settings. We hypothesized that Tv will improve the accuracy of in prognosis prediction in breast cancer patients compared to conventional T1 method.
The application of Tv as a prognostic indicator was applied in previous research focused on various types of malignant tumors including: colorectal cancer [4], esophageal cancer [5], laryngeal cancer [6], hepatocellular carcinoma [7,8], lung cancer [9], renal cell carcinoma [10], gastric cancer [11,12], malignant melanoma [13], thyroid cancer [14], and others [15-19]. Several papers have reported the prognostic advantages of applying Tv to breast cancer cases [20-27]. In these studies the Tv’s were calculated from images generated by mammography [20], breast MRI [21,22,24,25,27] or PET-CT scans [23,26]. No studies were found that calculated the Tv by microscopically determined pathologic tumor size.
The institutions involved in this study have accumulated Tv data from cases of primary invasive breast cancer measured by microscopic assessment dating from 1995. In this study, we aimed to investigate the prognostic advantages of using Tv to stage breast cancer as compared to those of using conventional T1 staging methods.
METHODS
Patients
Primary breast cancer patients who received curative surgery at Seoul Metropolitan Government - Seoul National University Boramae Medical Center and Seoul National University Hospital were participated in this study. Initially, pool of the subjects was 20,226. Two-hundred ninety-nine patients who received
curative surgeries after December, 2016 were excluded. Another 306 patients with no information on operation dates were excluded. Also excluded were 8,909 patients without sufficient Tv information, and 146 patients with initial stage IV diagnoses.
We further excluded 1,340 patients who received neoadjuvant systemic chemotherapy, 32 patients with initial diagnoses of T4 tumors, and 6 patients with malignant phyllodes tumors.
We also excluded 192 patients with insufficient information for study analysis. The final number of subjects was 8,996 after excluding 11,230 patients.
The Institutional Review Boards (IRBs) approved this study (26-2016-86, Seoul Metropolitan Government - Seoul National University Boramae Medical Center; J-1608-136-787, Seoul National University Hospital). Informed consent was waived from IRB.
Definitions of clinicopathological parameters
Patients’ ages were defined as the age at the time of diagnosis for primary breast cancer. The TNM staging was described according to the 7th edition of the AJCC.
Definition and classification of T and Tv
The T and Tv data were obtained from the final postoperative pathologic reports in the medical records. T was defined as the maximum tumor dimension and was recorded to the nearest millimeter. Tv was calculated by the equation of (4π × r1 × r2
× r3)/3, under the assumption that these measurements are the semi-axes of a prolate spheroid. The values of r1, r2, and r3 were defined as the half of the largest, intermediate, and shortest dimension of the tumor, respectively. All of r1, r2, and r3 were recorded to the nearest millimeter. The T category of the primary tumor was determined by pathologic measurement as T1 (tumor ≤ 20 mm in its greatest dimension), T2 (tumor > 20 mm but ≤ 50 mm in its greatest dimension), and T3 (tumor >
50 mm in its greatest dimension) according to the 8th edition of the AJCC Cancer Staging Manual. In this study, the Tv category of the primary tumor was determined by 2 cutoff values; the mean of Tv values for T = 2.0 cm (n = 874, mean = 2.056 cm3) and the mean of Tv values for T = 5.0 cm (n = 81, mean = 20.733 cm3). Accordingly, Tv was classified into 3 categories; Tv1 (Tv ≤ 2.056 cm3), Tv2 (Tv > 2.056 cm3 but ≤ 20.733 cm3), and Tv3 (Tv >20.733 cm3).
Statistical analyses
Data were presented as frequency and percentage for categorical variables. The Kaplan-Meier method was used for the estimation of survival rates and log-rank tests were used to determine the significance of differences between 2 or more survival curves. The χ2 values of log-rank test were used to compare the statistical powers of clinicopathological parameters. The Cox proportional hazards model was used
for univariate and multivariate analysis. The hazard ratio (HR) was calculated according to a cutoff value of a 95% confidence interval (CI). We used the Pearson correlation coefficient to evaluate bivariate correlation between T and Tv and positive nodes. We carried out receiver operating characteristic (ROC) curve analysis to illustrate the performance of T and Tv regarding overall survival rates, and calculated the value of the area under the curve (AUC). Time duration of overall survival were defined as the time from operation to death from any cause. All statistical analyses were carried out using IBM SPSS Statistics ver. 20.0 (IBM Co., Armonk, NY, USA). All tests were 2-sided and we regarded the results of statistical analyses as significant when the P-value was less than 0.05.
RESULTS
Clinicopathological characteristics
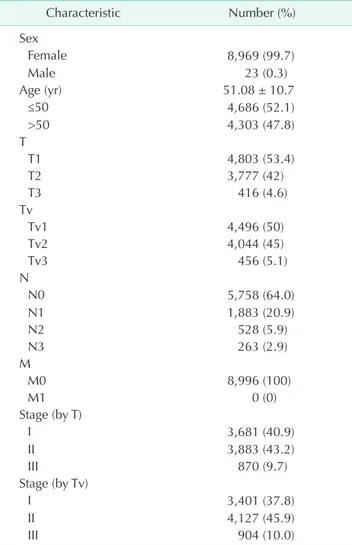
The total number of subjects was 8,996. Female patients were 8,969 (99.7%) and male patients were 23 (0.3%). The mean age was 51.1 ± 10.7 years (range, 19–93 years). Operation dates were between September 25, 1995 and December 31, 2015. The mean follow-up period was 72.1±42.8 months (range, 0–253 months). The total number of deaths during this period was 626 (7.0%). The mean size of T and Tv were 2.3 ± 1.5 cm (range, 0.1–17.0 cm) and 6.0 ± 20.9 cm3 (range, 0.001–1,005.3 cm3), respectively. The clinicopathological characteristics of the study subjects are summarized in Table 1. The subject numbers of T1, T2, and T3 tumors were 4,803 (53.4%), 3,777 (42.0%), and 416 (4.6%), respectively, and those of the Tv1, Tv2, and Tv3 tumors were 4,496 (50.0%), 4,044 (45.0%), and 456 (5.1%), respectively.
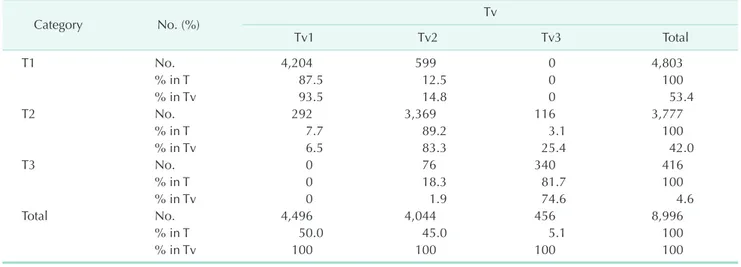
The proportions of stages I, II, and III by T were 40.9%, 43.2%, and 9.7%, respectively, and the proportions of stages I, II, and III by Tv were 37.8%, 45.9%, and 10.0%, respectively. Of the 4,803 T1 tumors, 4,204 (87.5%) were Tv1 tumors, and 599 (12.5%) were Tv2 tumors. Of the 3,777 T2 tumors, 3,369 (89.2%) were Tv2 tumors, and 292 (7.7%), and 116 (3.1%) were Tv1 and Tv3 tumors, respectively. Of the 416 T3 tumors, 340 (81.7%) were Tv3 tumors, and 76 (18.3%) were Tv2 tumors (Table 2).
Survival analysis
The survival curves according to both T and Tv were well separated (all P < 0.001). All of the χ2 values by log-rank test for Tv were larger than those of T, respectively (Fig. 1A, B).
The survival curves according to both conventional stage by T and new stage by Tv were also well separated (all P < 0.001).
The χ2 values between stages I and II, and between stages I and III by Tv were larger than those of conventional stages by T, respectively (Fig. 1C, D). Fig. 2A depicts the survival curves according to the combination of T and Tv. The T1 & Tv1 group showed the best survival rate and the T3 & Tv3 group showed the worst survival rate. Grossly, the survival curves could be
classified into 3 groups according to Tv rather than T; the first group with T1 & Tv1 and T2 & Tv1, the second groups with T1
& Tv2, T2 & Tv2, and T3 & Tv2, and the third group with T2 &
Tv3 and T3 & Tv3. Although the survival rate of the T2 & Tv1 group seemed to be higher than that of the T1 & Tv2, there was no statistically significantly difference between them (Fig. 2B). In T1 and T2 tumors, the Tv1 group showed superior survival to that of the Tv2 group (log-rank test; P < 0.001, P = 0.001 respectively) (Fig. 3A, B). Although the T1 group showed a higher survival rate than that of the T2 group in Tv2 tumors (log-rank test; P < 0.001) (Fig. 3C), there was no difference between them in terms of the Tv1 tumors (Fig. 3D). The χ2 value between Tv1 and Tv2 in T2 tumors (χ2=12.0) (Fig. 1B) was larger than the χ2 value between T1 and T2 in Tv2 tumors (χ2=10.2) (Fig. 1D).
Table 1. Baseline characteristics of the study subjects (n = 8,996)
Characteristic Number (%)
Sex
Female 8,969 (99.7)
Male 23 (0.3)
Age (yr) 51.08 ± 10.7
≤50 4,686 (52.1)
>50 4,303 (47.8)
T
T1 4,803 (53.4)
T2 3,777 (42)
T3 416 (4.6)
Tv
Tv1 4,496 (50)
Tv2 4,044 (45)
Tv3 456 (5.1)
N
N0 5,758 (64.0)
N1 1,883 (20.9)
N2 528 (5.9)
N3 263 (2.9)
M
M0 8,996 (100)
M1 0 (0)
Stage (by T)
I 3,681 (40.9)
II 3,883 (43.2)
III 870 (9.7)
Stage (by Tv)
I 3,401 (37.8)
II 4,127 (45.9)
III 904 (10.0)
Values are presented as number (%) or mean ± standard devi- ation.
Tv, tumor volume.
Table 2. Subjects distribution according to T and Tv categories
Category No. (%) Tv
Tv1 Tv2 Tv3 Total
T1 No. 4,204 599 0 4,803
% in T 87.5 12.5 0 100
% in Tv 93.5 14.8 0 53.4
T2 No. 292 3,369 116 3,777
% in T 7.7 89.2 3.1 100
% in Tv 6.5 83.3 25.4 42.0
T3 No. 0 76 340 416
% in T 0 18.3 81.7 100
% in Tv 0 1.9 74.6 4.6
Total No. 4,496 4,044 456 8,996
% in T 50.0 45.0 5.1 100
% in Tv 100 100 100 100
Tv, tumor volume.
T1 T2 T3
50 100 150 200 250 300 1.0
0.8
0.6
0.4
survivalOverall 0.2
0 0
Follow-up (mo) P < 0.001, 2= 153.8 P < 0.001, 2= 42.9 P < 0.001, 2= 253.6 (T1 & T3)
50 100 150 200 250 300 1.0
0.8
0.6
0.4
survivalOverall 0.2
0 0
Follow-up (mo) Tv1
Tv2 Tv3
P < 0.001, 2= 160.3 P < 0.001, 2= 45.9 P < 0.001, 2= 285.3 (Tv1 & Tv3)
A B
50 100 150 200 250 300 1.0
0.8
0.6
0.4
survivalOverall 0.2
0 0
Follow-up (mo)
50 100 150 200 250 300 1.0
0.8
0.6
0.4
survivalOverall 0.2
0 0
Follow-up (mo)
C D
P < 0.001, 2= 396.3 (stage I&III) P < 0.001, 2= 77.0 P < 0.001, 2= 154.5 Stage I (by T)
II III Stage (by T) Stage (by T)
P < 0.001, 2= 411.6 (stage I&III) P < 0.001, 2= 93.8 P < 0.001, 2= 152.1 Stage I (by Tv)
II III Stage (by Tv) Stage (by Tv)
Fig. 1. Overall survival curves according to T category (A), Tv category (B), Stage by T (C), and Stage by Tv (D). Tv, tumor volume.
T1 & Tv1 (n = 4152) T1 & Tv2 (n = 594) T2 & Tv1 (n = 289) T2 & Tv2 (n = 3326) T2 & Tv3 (n = 115) T3 & Tv2 (n = 75) T3 & Tv3 (n = 338)
50 100 150 200 250 300 1.0
0.8
0.6
0.4
survivalOverall 0.2
0 0
Follow-up (mo)
50 100 150 200 250 1.0
0.8
0.6
0.4
survivalOverall 0.2
0 0
Follow-up (mo) T2 & Tv1 T1 & Tv2
P = 0.201
A B
**
*
**
**
Fig. 2. Overall survival curves according to the combination of T and Tv category (A), and the survival curves for the T2 & Tv1 group and the T1 & Tv2 group (B).
Tv, tumor volume. *No statistical significance between the 2 sur- vival curves.
Cox regression analysis
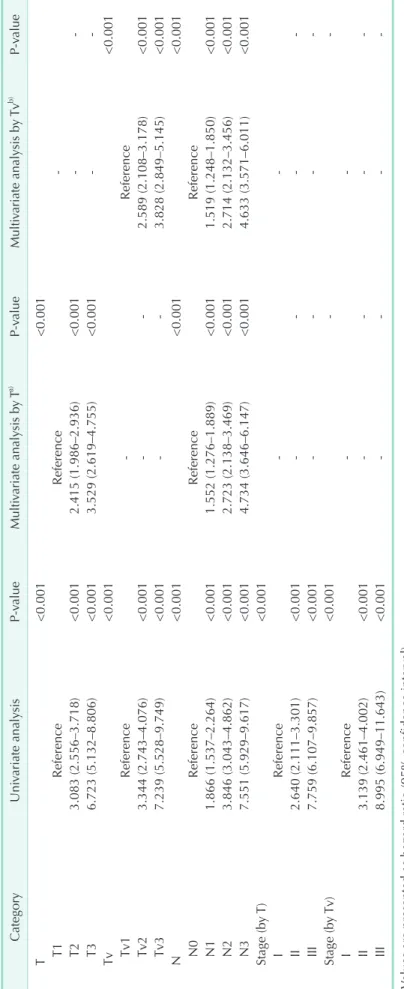
Univariate analysis demonstrated that both the T and Tv categories were significant prognostic factors (both P < 0.001) (Table 3). The HRs of the Tv categories were larger than those of the T categories, respectively; the HRs of T2 and T3, with reference to T1 were 3.083 and 6.723, and the HRs of Tv2 and Tv3 with reference to Tv1 were 3.344 and 7.239, respectively. Tv stage groups also showed larger HRs when compared to those of T stage groups; the HRs of stage II (by T) and stage III (by T) with reference to stage I (by T) were 2.640 and 7.759, and the HRs of stage II (by Tv) and stage III (by Tv) with reference to stage I (by Tv) were 3.319 and 8.995, respectively. The HRs of the N categories are also described in Table 3. Multivariate analysis showed that Tv was still an independent prognostic factor as well as T after adjusted with N category.
ROC curve analysis
ROC curve analysis of overall survival rates showed that the AUCs of Tv and T were 0.712 (95% CI, 0.691–0.732; P <
0.001) and 0.699 (95% CI, 0.679–0.719; P < 0.001), respectively (Supplementary Fig. 1).
Correlation analysis
Positive correlations were observed between the number of positive nodes and conventional 1-dimensional tumor size (coefficient = 0.325; P < 0.001) (Supplementary Fig. 2A) and between the number of positive nodes and 3-dimensional Tv (coefficient = 0.321; P < 0.001) (Supplementary Fig. 2B).
DISCUSSION
The AJCC TNM staging system has become the global standard for gathering, communicating, and exchanging cancer information worldwide and is widely used by clinicians, the surveillance community, registrars, researchers, the medical industry, patient advocates, and cancer patients [1]. This system classifies cancers by the size and extent of the primary tumor (T), the involvement of regional lymph nodes (N), and the presence or absence of distant metastases (M), supplemented in recent years by evidence-based prognostic and predictive factors. Conventionally, maximum 1-dimensional tumor size has been used as the only criterion for T classification in breast cancer since the 1st edition of AJCC TNM staging system.
We hypothesized that 3-dimensional Tv might be a more appropriate method for determining primary tumor burden than 1-dimensional T, and as a result, Tv would be a superior prognostic factor than T. In this study, we tried to evaluate the prognostic influence of 3-dimensional Tv on breast cancer compared to conventional 1-dimensional T. This study not only revealed that Tv classification works well in the prognostication of breast cancer, but it also demonstrated that it is a better prognosticator than conventional 1-dimensional T classification in several aspects.
Both conventional 1-dimensional T classification and 3-dimensional Tv classification were efficient prognostic factors in breast cancer. However, the results of the Kaplan- Meier estimator and the log-rank test (Fig. 1) used in this study showed that Tv is a more powerful prognosticator than
1.0
0.8
0.6
0.4
survivalOverall 0.2
0 0
Follow-up (mo)
50 100 150 200 250 50 100 150 200 250 300
1.0
0.8
0.6
0.4
survivalOverall 0.2
0 0
Follow-up (mo)
A B
1.0
0.8
0.6
0.4
survivalOverall 0.2
0 0
Follow-up (mo)
1.0
0.8
0.6
0.4
survivalOverall 0.2
0 0
Follow-up (mo)
C D
50 100 150 200 250 50 100 150 200 250
Tv1 Tv2 P < 0.001 T1
Tv1 Tv2
P = 0.001 ( 2= 12.0) T2
T1 T2 P = 0.181
Tv1 Tv2
T1 T2
P = 0.001 ( 2= 10.2)
Fig. 3. Overall survival curves for Tv1 and Tv2 in T1 tumors (A) and T2 tumors (B), ant the survival curves for T1 and T2 in Tv1 tumors (C) and Tv2 tumors (D). Tv, tumor volume.
Table 3. Univariate and multivariate analyses for T and Tv classification CategoryUnivariate analysisP-valueMultivariate analysis by Ta) P-valueMultivariate analysis by Tvb) P-value T<0.001<0.001 T1ReferenceReference- T23.083 (2.556–3.718)<0.0012.415 (1.986–2.936)<0.001-- T36.723 (5.132–8.806)<0.0013.529 (2.619–4.755)<0.001-- Tv<0.001<0.001 Tv1Reference-Reference Tv23.344 (2.743–4.076)<0.001--2.589 (2.108–3.178)<0.001 Tv37.239 (5.528–9.749)<0.001--3.828 (2.849–5.145)<0.001 N<0.001<0.001<0.001 N0ReferenceReferenceReference N11.866 (1.537–2.264)<0.0011.552 (1.276–1.889)<0.0011.519 (1.248–1.850)<0.001 N23.846 (3.043–4.862)<0.0012.723 (2.138–3.469)<0.0012.714 (2.132–3.456)<0.001 N37.551 (5.929–9.617)<0.0014.734 (3.646–6.147)<0.0014.633 (3.571–6.011)<0.001 Stage (by T)<0.001 IReference-- II2.640 (2.111–3.301)<0.001---- III7.759 (6.107–9.857)<0.001---- Stage (by Tv)<0.001-- IReference-- II3.139 (2.461–4.002)<0.001---- III8.995 (6.949–11.643)<0.001---- Values are presented as hazard ratio (95% confidence interval). Tv, tumor volume. a) T category was adjusted with N category, and vice versa. b) Tv category was adjusted with N category, and vice versa.
conventional T. Although all of the P-values were less than 0.001 in the T1, T2, and T3 groups and in the Tv1, Tv2, and Tv3 groups, the χ2 values of the Tv categories were larger than those of the T categories. Similar findings were observed in stage by T and stage by Tv. Although previous studies have reported the prognostic roles of Tv in various solid cancers, a considerably smaller number of studies have been performed on breast cancer. All of these papers calculated the Tv of primary breast cancer by using images generated by mammography’s, PET- CT’s, and breast MRI’s. This study is the first paper to report the prognostic influence of Tv on breast tumors as calculated microscopically in 3-dimensions. Atkinson et al. [20] reported the relationship between primary Tv at detection, the number of positive nodes, and the probability of the time until the first distant metastasis occurred and was examined in a group of 2,663 women with breast cancer. The time until metastasis was shown to decrease and the probability of metastasis increase as Tv and the number of nodes increased was shown. Tv was calculated from mammography’s; tumor length and width were recorded for each patient and Tv was calculated under the assumption that these measurements were the axes of a prolate spheroid. Several papers reported the impact of metabolic Tv measured by PET-CT on the prognosis of breast cancer. Kim et al. reported that the metabolic Tv of primary tumors was associated with shorter disease free survival periods and shorter overall survival periods by performing univariate analysis on the PET-CT data of 53 operable primary breast cancer patients.
Son et al. [26] reported that univariate and multivariate analyses indicated that nonsurvivors had a higher mean metabolic Tv according to PET-CT’s than survivors who had distant metastasis at the time of initial diagnosis. Several papers reported the prognostic impact of Tv determined by breast MRI’s on patients who received neoadjuvant chemotherapy [21,22,24,25,27]. Partridge et al. [21] reported the impact of breast Tv determined by MRI measurements for the prediction of response to neoadjuvant chemotherapy and recurrence-free survival using 62 breast cancer patients undergoing neoadjuvant chemotherapy and concluded that MRI-determined Tv was more predictive of recurrence free survival than T1, suggesting that volumetric changes measured using MRI may provide a more sensitive assessment of treatment efficacy. Akazawa et al. [22] reported the prognostic effect of reduction in total Tv measured with 3D-MRI for locally-advanced breast cancer patients, treated with primary chemotherapy, using data from 51 patients with locally advanced breast cancer treated with four cycles of docetaxel before surgery. The results revealed that the patients whose total Tv decreased by 75% or more after neoadjuvant chemotherapy showed significantly better prognoses than others, while tumor size measured with calipers, ultrasonography, and 2-dimensional MRI showed no significant relationship to patient prognosis.
In this study, we hypothesized that the T2 & Tv1 groups would show a lower survival rate than that of the T1 & Tv2 group according to conventional T classification. Although, the survival curves showed a tendency for a better prognosis of T2 & Tv1 than of T1 & Tv2, there was no statistical significance (Fig. 2). The number of subjects in the 2 groups might not have been sufficient to show statistical significance (n = 289 for T2
& Tv1, n = 594 for T1 & Tv2). Although our study did not show superior survival rates in T2 & Tv1 as compared to T1 & Tv2, the survival rates of T2 & Tv1 were, at least, not inferior to those of T1 & Tv2. There was also no statistical significance regarding overall survival between T3 & Tv2 and T2 & Tv3, and the number of subjects in each group were 75 and 115, respectively.
We hope that further study with an increased number of subjects will prove our hypothesis.
Subgroup analysis of T1, T2, Tv1, and Tv2 revealed that Tv classification had a greater prognostic prediction value for breast cancer than T classification. The Tv1 group showed superior survival rates than Tv2 for T1 and T2 tumors. On the contrary, there was no statistical significance between the T1 and T2 groups for Tv1 tumors. Su et al. [9] analyzed 274 patients with stage I non-small cell lung cancer who had received preoperative chest computed tomography scans with complete resection and Tv was semiautomatically measured from chest computed tomography scans by using an imaging software program. They reported that patients with tumor diameters ≤ 2 cm and 2–3 cm were stratified into 2 groups with significantly different DFS and OS on the basis of Tv, but Tv was not a significant factor in the patient group with tumor diameters > 3 cm. Our study also showed that Tv was a significant prognostic factor in T1 and T2, but lost its significance with T3 tumors (data not shown).
Insufficient numbers of subjects was likely responsible for the outcome of this study, so further study is needed to prove the hypothesis.
Univariate analysis demonstrated that the HR’s of Tv categories were larger than those of T categories. The HR’s of staging by Tv categories were also larger than those of stages by T categories. These findings could be indirect evidences for the usefulness of Tv classification over conventional T classification.
Tv was a significant independent prognostic factor as well as T and N according to the results of the multivariate analysis.
Su et al. [9] reported that although Tv and the greatest tumor diameter were significant factors per univariate analysis, only Tv was an independent prognostic factor per multivariate analysis in stage I non-small cell lung cancer. Jorns et al. [10]
reported that Tv was a significant independent prognostic factor for cancer specific survival in T1 clear cell renal cell carcinoma.
They estimated the Tv using three tumor dimensions recorded in pathology reports and the equation for the volume of an ellipsoid; π/6 (length × width × height). Jiang et al. [11] and Liu et al. [12] reported that the TvNM staging system may be
more reliable than the conventional TNM staging system for prognostic assessment using TNM stages I–III gastric cancer patients who underwent curative gastrectomy.
Although ROC curve analysis of overall survival rates showed a slightly higher AUC value for Tv compared to T1, the difference was too small to be clinically significant (AUC = 0.712 for Tv, AUC = 0.699 for T). Su et al. [9] reported similar results in stage I, non-small cell lung cancer. The ROC curves for predicting overall survival showed that the AUC of Tv and the greatest tumor diameter were 0.645 (95% CI, 0.569–0.721; P = 0.001) and 0.641 (95% CI, 0.565–0.718; P = 0.001), respectively.
Correlation analysis showed almost the same Pearson correlation coefficient values between tumor size and Tv of positive node numbers. We could not observe the differences between the T and Tv categories for prognostication power in the subgroup analyses according to N categories (data not shown).
Although this study demonstrated the practical usefulness of Tv classification compared to conventional T classification, it had several limitations. First, the number of subjects was not sufficient to achieve the statistically significant results, particularly in the subgroup analyses. The most important finding was that the T2 & Tv1 groups showed a tendency towards superior survival prediction compared to the T1 & Tv2 groups, but there was no statistical difference. Second, although we tried to select the best cutoff points for the Tv categories,
they were still arbitrary. More effort may be needed to find the best cut off values which could better reveal the superiority of Tv classification over conventional T classification. Third, we could not analyze breast cancer specific survival due to the unavailability of information. Last, this study showed the potential clinical usefulness of Tv compared to T classification, but the clinical benefit of Tv over conventional T classification in terms of prognostication was not big enough to urge its immediate clinical application. Further validation studies are needed to accumulate more evidence to support the results of this study.
In conclusion, Tv classification works well for predicting the prognosis of breast cancer patients. According to the results, it is a better predictor than conventional T classification in several aspects. Further studies are needed to validate the practical usefulness of Tv classification in clinical settings.
CONFLICTS OF INTEREST
No potential conflict of interest relevant to this article was reported.
SUPPLEMENTARY MATERIALS
Supplementary Figures can be found via https://www.astr.
or.kr/src/sm/astr-95-183-s001.pdf.
REFERENCES
1. Amin MB, Edge SB, Greene FL, Compton CC, Gershenwald JE, Brookland RK, et al.
AJCC cancer staging manual. 8th ed. New York: Springer; 2017.
2. American Joint Committee for Cancer Staging and End Results Reporting.
Manual for staging of cancer. Chicago (IL):
American Joint Committee; 1977.
3. Amin MB, Greene FL, Edge SB, Compton CC, Gershenwald JE, Brookland RK, et al. The Eighth Edition AJCC Cancer Staging Manual: continuing to build a bridge from a population-based to a more
"personalized" approach to cancer staging.
CA Cancer J Clin 2017;67:93-9.
4. Bhooshan N, Sharma NK, Badiyan S, Kaiser A, Moeslein FM, Kwok Y, et al.
Pretreatment tumor volume as a prog- nostic factor in metastatic colorectal
cancer treated with selective internal ra dia tion to the liver using yttrium-90 resin microspheres. J Gastrointest Oncol 2016;7:931-7.
5. Chen Y, Zhang Z, Jiang G, Zhao K. Gross tumor volume is the prognostic factor for squamous cell esophageal cancer patients treated with definitive radiotherapy. J Thorac Dis 2016;8:1155-61.
6. Timmermans AJ, Lange CA, de Bois JA, van Werkhoven E, Hamming-Vrieze O, Hilgers FJ, et al. Tumor volume as a prognostic factor for local control and overall survival in advanced larynx cancer. Laryngoscope 2016;126:E60-7.
7. Li MX, Zhao H, Bi XY, Li ZY, Huang Z, Han Y, et al. Total tumor volume predicts survival following liver resection in patients with hepatocellular carcinoma.
Tumour Biol 2016;37:9301-10.
8. Hwang S, Song GW, Lee YJ, Kim KH, Ahn CS, Moon DB, et al. Multiplication of tumor volume by two tumor markers is a post-resection prognostic predictor for solitary hepatocellular carcinoma. J Gastro intest Surg 2016;20:1807-20.
9. Su XD, Xie HJ, Liu QW, Mo YX, Long H, Rong TH. The prognostic impact of tumor volume on stage I non-small cell lung cancer. Lung Cancer 2017;104:91-7.
10. Jorns J, Thiel DD, Lohse CM, Williams A, Arnold ML, Cheville JC, et al. Three- dimensional tumour volume and cancer- specific survival for patients undergoing nephrectomy to treat pT1 clear-cell renal cell carcinoma. BJU Int 2012;110:956-60.
11. Jiang N, Deng JY, Ding XW, Liu Y, Liang H.
Tumor volume as a prognostic factor was
superior to the seventh edition of the pT classification in resectable gastric cancer.
Eur J Surg Oncol 2015;41:315-22.
12. Liu Z, Gao P, Liu S, Zheng G, Yang J, Sun L, et al. Tumor volume increases the predictive accuracy of prognosis for gastric cancer: a retrospective cohort study of 3409 patients. Oncotarget 2017;8:18968- 78.
13. Voss B, Wilop S, Jonas S, El-Komy MH, Schaller J, von Felbert V, et al. Tumor volume as a prognostic factor in resectable malignant melanoma. Dermatology 2014;
228:66-70.
14. Lim ST, Jeon YW, Suh YJ. The prognostic values of preoperative tumor volume and tumor diameter in T1N0 papillary thyroid cancer. Cancer Res Treat 2017;49:890-7.
15. Taran SJ, Taran R, Batra M, Ladia DD, Bhandari V. Survival with concurrent temozolomide and radiotherapy in pediatric brainstem glioma with relation to the tumor volume. J Pediatr Neurosci 2015;10:341-5.
16. Lin CS, de Oliveira Santos AB, Silva EL, de Matos LL, Moyses RA, Kulcsar MA, et al. Tumor volume as an independent predictive factor of worse survival in patients with oral cavity squamous cell carcinoma. Head Neck 2017;39:960-4.
17. Meyer CP, Hansen J, Boehm K, Tilki D, Abdollah F, Trinh QD, et al. Tumor volume improves the long-term prediction
of biochemical recurrence-free survival after radical prostatectomy for localized prostate cancer with positive surgical margins. World J Urol 2017;35:199-206.
18. Davis KS, Lim CM, Clump DA, Heron DE, Ohr JP, Kim S, et al. Tumor volume as a predictor of survival in human papil- lomavirus-positive oropharyngeal cancer.
Head Neck 2016;38 Suppl 1:E1613-7.
19. Chen MK, Chen TH, Liu JP, Chang CC, Chie WC. Better prediction of prognosis for patients with nasopharyngeal car- cinoma using primary tumor volume.
Cancer 2004;100:2160-6.
20. Atkinson EN, Brown BW, Montague ED. Tumor volume, nodal status, and metastasis in breast cancer in women. J Natl Cancer Inst 1986;76:171-8.
21. Partridge SC, Gibbs JE, Lu Y, Esserman LJ, Tripathy D, Wolverton DS, et al.
MRI measurements of breast tumor volume predict response to neoadjuvant chemotherapy and recurrence-free sur- vival. AJR Am J Roentgenol 2005;184:
1774-81.
22. Akazawa K, Tamaki Y, Taguchi T, Tanji Y, Miyoshi Y, Kim SJ, et al. Potential of reduction in total tumor volume mea- sured with 3D-MRI as a prognostic factor for locally-advanced breast cancer patients treated with primary chemo therapy.
Breast J 2008;14:523-31.
23. Kim J, Yoo SW, Kang SR, Cho SG, Oh JR,
Chong A, et al. Prognostic significance of metabolic tumor volume measured by (18)F-FDG PET/CT in operable primary breast cancer. Nucl Med Mol Imaging 2012;46:278-85.
24. Jafri NF, Newitt DC, Kornak J, Esserman LJ, Joe BN, Hylton NM. Optimized breast MRI functional tumor volume as a biomarker of recurrence-free survival following neoadjuvant chemotherapy. J Magn Reson Imaging 2014;40:476-82.
25. Newitt DC, Aliu SO, Witcomb N, Sela G, Kornak J, Esserman L, et al. Real-time measurement of functional tumor volume by MRI to assess treatment response in breast cancer neoadjuvant clinical trials:
validation of the aegis SER software platform. Transl Oncol 2014;7:94-100.
26. Son SH, Lee SW, Jeong SY, Song BI, Chae YS, Ahn BC, et al. Whole-body metabolic tumor volume, as determined by (18) F-FDG PET/CT, as a prognostic factor of outcome for patients with breast cancer who have distant metastasis. AJR Am J Roentgenol 2015;205:878-85.
27. Hylton NM, Gatsonis CA, Rosen MA, Lehman CD, Newitt DC, Partridge SC, et al. Neoadjuvant chemotherapy for breast cancer: functional tumor volume by MR imaging predicts recurrence-free survival-results from the ACRIN 6657/
CALGB 150007 I-SPY 1 TRIAL. Radiology 2016;279:44-55.
Supplementary Fig. 1. Receiver operating characteristic curves for T and Tv regarding overall survival. AUC, area under the curve; Tv, tumor volume.
Supplementary Fig. 2. Two-dimensional scatter plots and Pearson correlation analyses to depict correlations between the number of positive nodes and tumor size (A) and between the number of positive nodes and tumor volume (B).