Obesity Fact Sheet in Korea, 2020: Prevalence of Obesity by Obesity Class from 2009 to 2018
Ga Eun Nam1, Yang-Hyun Kim1, Kyungdo Han2, Jin-Hyung Jung3, Eun-Jung Rhee4, Won-Young Lee4,*;
On Behalf of the Taskforce Team of the Obesity Fact Sheet of the Korean Society for the Study of Obesity
1Department of Family Medicine, Korea University College of Medicine, Seoul; 2Department of Statistics and Actuarial Science, Soongsil University, Seoul;
3Department of Biostatistics, College of Medicine, The Catholic University of Korea, Seoul; 4Division of Endocrinology and Metabolism, Department of Internal Medicine, Kangbuk Samsung Hospital, Sungkyunkwan University School of Medicine, Seoul, Korea
Background: We examined the prevalence of different obesity classes in South Korea based on the 2020 Obe- sity Fact Sheet.
Methods: Individuals ≥20 years who underwent a health examination provided by the Korean National Health Insurance System between 2009 and 2018 were included and the prevalence of class I, II, and III obesity was calculated for the total sample and age, sex, and region subgroups.
Results: From 2009 to 2018, the prevalence of all obesity classes increased across all sex and age groups and all regions. In the study population as a whole, the prevalence of class I, II, and III obesity was 29.1%, 3.2%, and 0.3%
in 2009 and 32.5%, 5.2%, and 0.81% in 2018, respectively. Among young-aged individuals, the prevalence of each obesity class was 23.7%, 3.6%, and 0.44% in 2009 and 28.3%, 6.9%, and 1.61% in 2018, respectively. The prevalence among middle-aged individuals was 31.6%, 3.1%, and 0.24% in 2009 and 33.6%, 4.8%, and 0.59% in 2018; and among elderly individuals was 31.9%, 3.1%, and 0.21% in 2009 and 35.5%, 3.9%, and 0.32% in 2018.
The increase in the prevalence of all obesity classes among young adults was dramatic. In particular, the class III obesity prevalence increased up to 3.8- and 3.5-fold between 2009 and 2018 in young men and women.
Conclusion: Based on the 2020 Obesity Fact Sheet, there was a dramatic increase in the prevalence of class II and III obesity from 2009 to 2018 among young adults, as well as the population as a whole. Optimal strategies for the prevention and treatment of obesity are needed considering the recent obesity epidemic in South Korea.
Key words: Obesity, Obesity class, Prevalence, Fact sheet, National Health Insurance System
Received May 14, 2021 Reviewed June 12, 2021 Accepted June 13, 2021
* Corresponding author Won-Young Lee
https://orcid.org/0000-0002-1082-7592 Division of Endocrinology and Metabolism, Department of Internal Medicine, Kangbuk Samsung Hospital, Sungkyunkwan University School of Medicine, 29 Saemunan-ro, Jongno-gu, Seoul 03181, Korea
Tel: +82-2-2001-2579 Fax: +82-2-2001-1588 E-mail: [email protected]
INTRODUCTION
Obesity is a complex, multifactorial chronic disease that is associ- ated with higher rates of comorbidities such as hypertension, type 2 diabetes mellitus, dyslipidemia, obstructive sleep apnea, steato- hepatitis, cardiovascular diseases, and several types of cancer, as well as higher risk of death from such comorbidities.
1,2Obesity substantially affects patient quality of life, limits economic and so- cial activity opportunities, and imposes a considerable financial burden on patients and society. Notwithstanding the many efforts
to reduce the obesity epidemic and its impact, obesity remains a major public health issue worldwide.
1,2According to the 2019 Obe- sity Fact Sheet by the Korean Society for the Study of Obesity (KSSO), the prevalence of obesity and abdominal obesity in Korea continuously increased in the adult population and among both sexes and nearly all age groups between 2009 and 2018.
3The rapid increase in obesity prevalence is a global phenomenon and a major healthcare challenge across both developed and developing coun- tries. Moreover, a steep increment of the prevalence of morbid obesity warrants further research and the development of a variety
Copyright © 2021 Korean Society for the Study of Obesity
This is an Open Access article distributed under the terms of the Creative Commons Attribution Non-Commercial License (https://creativecommons.org/licenses/by-nc/4.0/) which permits unrestricted non-commercial use, distribution, and reproduction in any medium, provided the original work is properly cited.
2017-03-16 https://crossmark-cdn.crossref.org/widget/v2.0/logos/CROSSMARK_Color_square.svg
of management tools.
4KSSO has invested considerable effort into investigating the epi- demiology of obesity and obesity-related comorbidities in order to improve obesity and obesity-related health outcomes across Korea.
For that reason, the KSSO has published Obesity Fact Sheets for Korea since 2015 in collaboration with the Korean National Health Insurance Corporation (NHIC). The Obesity Fact Sheets sought to evaluate the status of obesity and obesity-related diseases and impacts of obesity, as well as to provide health statistics for the de- velopment of national health policies on obesity in Korea. The 2020 Obesity Fact Sheet described recent trends in the prevalence of obesity by obesity class in age and sex groups, and region of South Korea. Hence, in this study, we reported its rationale and methods and discussed the prevalence of obesity classes in South Korea based on the 2020 Obesity Fact Sheet.
METHODS Data source and study population
This study was based on the national health checkup dataset of- fered by the Korean National Health Insurance Service (NHIS).
The Korean NHIC manages the NHIS, which is a universal and mandatory health insurance system covering 97% of Koreans and provides at least biennial health screenings for all insured Koreans.
The NHIS possesses a database of nearly the whole South Korean population including demographic information, health examina- tion data, and diagnosis of diseases and medical treatment identi- fied by the International Classification of Diseases, 10th revision and prescription codes. We analyzed data on individuals aged ≥ 20 years who underwent a health examination provided by the Kore- an NHIS between January 1, 2009, and December 31, 2018. The Institutional Review Board of the Kangbuk Samsung Hospital ap- proved this study protocol (No. KBSMC 2020-05-002).
Definition of obesity and obesity classes
Trained staff measured participant height and body weight for anthropometric assessment. We calculated body mass index (BMI) by dividing body weight (kg) by the square of the height (m). We defined obesity as a BMI ≥ 25 kg/m
2, according to the Asia-Pacific criteria of the World Health Organization guidelines. Obesity classes
were defined using the 2018 KSSO Obesity Guideline for the Man- agement of Obesity as follows, class I obesity, BMI 25.0–29.9 kg/m
2; class II obesity, 30.0–34.9 kg/m
2; class III obesity, ≥ 35.0 kg/m
2.
5Statistical analysis
All statistical analyses were performed using SAS version 9.4 (SAS Institute Inc., Cary, NC, USA). We presented the prevalence of obesity and obesity classes in the study population as a whole, as well as prevalence by age group (young: 20–39 years, middle-aged:
40–64 years, and elderly: ≥ 65 years), sex, and region of South Ko- rea.
RESULTS
Prevalence of obesity by obesity class (2009–2018)
The prevalence of overall obesity in 2009 was 32.6% and in- creased by 1.18-fold to 38.5% in 2018, respectively. Fig. 1 presents the prevalence of obesity by obesity class from 2009 to 2018 in the whole population and by sex. The prevalence of all three classes of obesity increased between 2009 and 2018 for all groups (all P for trend < 0.001). In the whole sample, the prevalence of class I, II, and III obesity in 2009 was 29.1%, 3.2%, and 0.3%, respectively, and was increased by 1.12-, 1.63-, 2.79-fold in 2018 to 32.5%, 5.2%, and 0.81%, respectively (Fig. 1A). During this period, the preva- lence of each obesity class increased among both men and women (P for trend <0.001). The prevalence of class I, II, and III obesity in men was 33.5%, 3.4%, and 0.26% in 2009 and 39.4%, 6.0%, and 0.86% in 2018. In women, the prevalence was 23.7%, 3.1%, and 0.35% in 2009 and 24.6%, 4.3%, and 0.75% in 2018, respectively (Fig. 1B, C).
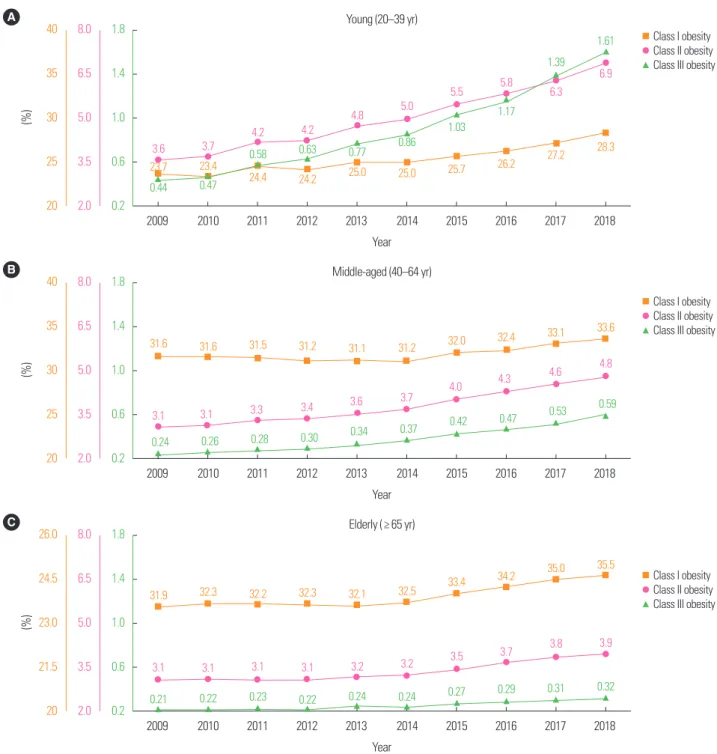
Prevalence of obesity by obesity class in age and sex groups (2009–2018)
Fig. 2 shows the prevalence of each obesity class from 2009 and
2018 among different age groups. Among all age groups, the preva-
lence of class I, II, and III obesity increased during this period (all P
for trend < 0.001). Among young individuals, the prevalence of
class I, II, and III obesity was 23.7%, 3.6%, and 0.44% in 2009 and
28.3%, 6.9%, and 1.61% in 2018, respectively. The prevalence of
each obesity class among middle-aged individuals was 31.6%, 3.1%,
and 0.24% in 2009 and 33.6%, 4.8%, and 0.59% in 2018. Among elderly individuals, the prevalence was 31.9%, 3.1%, and 0.21% in 2009 and 35.5%, 3.9%, and 0.32% in 2018.
The age-specific prevalence of obesity classes increased between 2009 and 2018 among both men and women, as shown in Fig. 3.
In 2018, the prevalence of class I obesity for young, middle-aged,
and elderly men was 37.8%, 41.4%, and 34.8%, respectively. The prevalence of class II obesity was 8.9%, 5.4%, and 2.6% and class III obesity was 1.85%, 0.53%, and 0.12% in young, middle-aged, and elderly men, respectively. Compared to 2009, 3.8-fold increases in class III obesity were observed in young and middle-aged men in 2018. In 2018, the prevalence of class I obesity among young, mid-
Figure 1. Prevalence of obesity by obesity class (2009–2018) in the total population (A), men (B), and women (C) (all P for trend < 0.001). Orange, pink, and green lines rep- resent the prevalence of class I, class II, and class III obesity, respectively.B 40
35 30 25 20
8.0 6.5 5.0 3.5 2.0
1.8
1.4
1.0
0.6
0.2
(%)
2009 2010 2011 2012 2013 2014 2015 2016 2017 2018 Year
Male
33.5 34.2 34.5 34.7 34.8 35.4 36.7 37.4 38.6 39.4
3.4 3.5 3.8 3.8 4.2 4.4 4.8 5.2 5.5
6.0
0.26 0.28 0.33 0.35 0.42 0.46 0.55 0.62 0.73
0.86
Class I obesity Class II obesity Class III obesity A 40
35 30 25 20
8.0 6.5 5.0 3.5 2.0
1.8
1.4
1.0
0.6
0.2
(%)
2009 2010 2011 2012 2013 2014 2015 2016 2017 2018 Year
Total
0.30 0.32 0.36 0.38 0.45 0.48 0.56 0.63 0.71 0.81
3.2 3.3 3.5 3.6 3.8 4.0 4.3 4.6 4.9 5.2
29.1 29.2 29.5 29.4 29.5 29.7 30.5 31.0 31.9 32.5
Class I obesity Class II obesity Class III obesity
C 26.0
24.5 23.0 21.5 20
6.0 5.0 4.0 3.0 2.0
1.8
1.4
1.0
0.6
0.2
(%)
2009 2010 2011 2012 2013 2014 2015 2016 2017 2018 Year
Female
0.35 0.36 0.40 0.42 0.48 0.51 0.57 0.63 0.69 0.75
23.7
23.0 23.3
23.0 23.2 23.0 23.4 23.8
24.3 24.6
3.1 3.1 3.2 3.3 3.4 3.5 3.7 3.9 4.1 4.3
Class I obesity Class II obesity Class III obesity
dle-aged, and elderly women was 12.9%, 25.2%, and 36.1%, respec- tively. The prevalence of class II obesity was 3.7%, 4.2%, and 5.2%
and class III obesity prevalence was 1.22%, 0.67%, and 0.51% in young, middle-aged, and elderly women, respectively. There were 2.1- and 3.5-fold increases in class II and class III obesity in young females in 2018 compared to 2009.
Prevalence of obesity classes by region
The prevalence of overall obesity and all three classes of obesity increased in all regions of South Korea in 2018 compared to 2009 (Fig. 4). In 2018, Jeju-si had the highest prevalence of all obesity classes and the second highest prevalence of all obesity classes was observed in Gangwon-do.
Figure 2. Prevalence of obesity classes (2009–2018) in young (A), middle-aged (B), and elderly (C) individuals (all P for trend < 0.001). Orange, pink, and green lines repre- sent the prevalence of class I, class II, and class III obesity, respectively.
A 40
35 30 25 20
8.0 6.5 5.0 3.5 2.0
1.8
1.4
1.0
0.6
0.2
(%)
2009 2010 2011 2012 2013 2014 2015 2016 2017 2018 Year
Young (20–39 yr)
0.44 0.47
0.58 0.63 0.77 0.86
1.03 1.17
1.39 1.61
3.6 3.7 4.2 4.2 4.8 5.0 5.5 5.8
6.3 6.9
23.7 23.4
24.4 24.2 25.0 25.0 25.7 26.2 27.2 28.3
Class I obesity Class II obesity Class III obesity
B 40
35 30 25 20
8.0 6.5 5.0 3.5 2.0
1.8
1.4
1.0
0.6
0.2
(%)
2009 2010 2011 2012 2013 2014 2015 2016 2017 2018 Year
Middle-aged (40–64 yr)
31.6 31.6 31.5 31.2 31.1 31.2 32.0 32.4 33.1 33.6
3.1 3.1 3.3 3.4 3.6 3.7 4.0 4.3 4.6 4.8
0.24 0.26 0.28 0.30 0.34 0.37 0.42 0.47 0.53 0.59
Class I obesity Class II obesity Class III obesity
C 26.0
24.5 23.0 21.5 20
8.0 6.5 5.0 3.5 2.0
1.8
1.4
1.0
0.6
0.2
(%)
2009 2010 2011 2012 2013 2014 2015 2016 2017 2018 Year
Elderly (≥ 65 yr)
0.21 0.22 0.23 0.22 0.24 0.24 0.27 0.29 0.31 0.32
31.9 32.3 32.2 32.3 32.1 32.5 33.4 34.2 35.0 35.5
3.1 3.1 3.1 3.1 3.2 3.2 3.5 3.7 3.8 3.9
Class I obesity Class II obesity Class III obesity
DISCUSSION
Based on the 2020 Obesity Fact Sheet in Korea, the prevalence of class I, II, and III obesity continued to increase from 2009 to 2018 in the population as a whole and in all subgroups. Among the three classes of obesity, the increase in the prevalence of class III obesity during this period was the greatest in the total population and in all subgroups. The increase in the prevalence of class II and III obesity was greater among men than in women, and was greater in young individuals than among middle-aged and elderly individuals. Be- tween 2009 and 2018, the prevalence of class III obesity increased 3.8- and 3.5-fold between 2009 and 2018 in young males and fe- males, respectively. This factsheet highlighted a steep increase in class III obesity (morbid obesity) among the population as a whole and all subgroups in South Korea. Furthermore, increases in the prevalence of all obesity classes including class II and III obesity were the most prominent in young individuals during the past decade.
Globally, there has been a faster increase in the prevalence of
higher-grade obesity or morbid obesity. A report from the National Center for Health Statistics suggested that the prevalence of overall obesity in the United States increased more than 36% from 1999 to 2014.
6In addition, an alarming prevalence increase in individual BMI categories was observed; the rate of overweight remained roughly same, while the rate of extreme obesity increased more than 6-fold to 6.6% in 2009-2010 compared to in 1962, based on National Health and Nutrition Examination Survey data.
6,7In South Korea, the prevalence of class II and III obesity increased rapidly based on the 2020 Obesity Fact Sheet. Obesity is related to higher rates of comorbidities such as hypertension, dyslipidemia, type 2 diabetes mellitus, obstructive sleep apnea, certain cancers, fatty liver, gastroesophageal reflux, arthritis, and polycystic ovary syndrome.
8,9Studies revealed evidently that the risk of these diseas- es rises in morbid obesity. One study reported that the risk of de- veloping type 2 diabetes mellitus surged at a BMI ≥ 27.2 kg/m
2.
10Obesity is associated with higher rates of mortality caused by obe- sity-related comorbidities at higher BMI levels. A study reported
Figure 3. Age-specific prevalence of obesity classes between 2009 and 2018 in men (A-C) and women (D-F).D 40
30
20
10
0
%
20–39 yr 40–64 yr ≥ 65 yr In females Class I obesity
9.2
26.7
35.3
12.9
25.2
36.1
× 1.4
× 1.0
× 0.9
E 6.0
4.5
3.0
1.5
0
%
20–39 yr 40–64 yr ≥ 65 yr Class II obesity
1.8
3.3
4.4
3.7 4.2
5.2
× 2.1
× 1.2
× 1.3
F 2.0
1.5
1.0
0.5
0
%
20–39 yr 40–64 yr ≥ 65 yr Class III obesity
0.35 0.35 0.35
1.22
0.67 0.51
× 3.5
× 1.5
× 1.9
2009 2018 2009
2009 2018 2018 A
50 40 30 20 10 0
%
20–39 yr 40–64 yr ≥ 65 yr In males Class I obesity
31.4
36.2
28.0
37.8 41.4
34.8
× 1.2
× 1.2
× 1.1
B 10
8 6 4 2 0
%
20–39 yr 40–64 yr ≥ 65 yr Class II obesity
4.6
2.8
1.6 8.9
5.4
2.6
× 1.9
× 1.6
× 1.9
C 2.0 1.6 1.2 0.8 0.4 0
%
20–39 yr 40–64 yr ≥ 65 yr Class III obesity
0.49
0.14 0.06
1.85
0.53
0.12
× 3.8
× 2.0
× 3.8
2009 2018 2009
2018 2009
2018
Figure 4. Prevalence of overall (A), class I (B), II (C), and III (D) obesity between 2009 and 2018 by region of South Korea.
A B
C D