Prevalence and Current Management of Cardiovascular Risk Factors in Korean Adults Based on Fact Sheets
Eun-Jung Rhee
Department of Endocrinology and Metabolism, Kangbuk Samsung Hospital, Sungkyunkwan University School of Medicine, Seoul, Korea
Korea is currently an aged society and is on the cusp of becoming a superaged society in a few years. The health burden of cardio- vascular diseases increases with age, and the increasing prevalence of cardiovascular risk factors, such as obesity, hypertension, dia- betes mellitus, and dyslipidemia, may be linked to increased population-level cardiovascular risk. In 2018, the prevalence of obesity in Korea was 35.7% (men, 45.4%; women, 26.5%) according to the Obesity Fact Sheet 2019, based on National Health Insurance Corporation medical checkup data. In 2016, the prevalence of diabetes was 14.4% in Koreans older than 30 years according to the Diabetes Fact Sheet published by the Korean Diabetes Association, based on data from the Korean National Health and Nutrition Examination Survey. The prevalence of hypertension in the total population of Korea in 2018 was 28.3% according to the Korean Hypertension Fact Sheet produced by the Korean Society of Hypertension. Lastly, the prevalence of dyslipidemia in 2018 was 40.5% according to the Dyslipidemia Fact Sheet published by the Korean Society of Lipid and Atherosclerosis. In this article, I would like to review the prevalence and current management of cardiovascular risk factors in Korea according to the fact sheets re- leased by various associations.
Keywords: Risk factors; Diabetes mellitus; Dyslipidemias; Hypertension; Obesity; Fact sheet
INTRODUCTION
According to the Statistics Korea, Koreans 65 years or older ac- counted for 14.2% of the population in 2017, indicating that Korea has become an aged society, and the proportion of people aged 65 years or older is expected to exceed 20% by 2026, at which point Korea will become a superaged society [1]. The in- creasing number of elderly people will be accompanied by a greater burden of mortality and morbidity related to cardiovas- cular and metabolic diseases. This point is underscored by the
importance of cardiovascular and metabolic diseases as causes of death; for instance, in 2018, heart disease, cerebral hemor- rhage, diabetes, and hypertension were the second, fourth, sixth, and 10th most common causes of death in Korea, respectively [1]. Therefore, interventions to prevent and/or reduce cardiovas- cular risk factors are warranted.
In Korea, numerous associations annually release fact sheets with information on the prevalence and current management of their diseases of interest based on analyses of national databas- es. Every year since 2015, the Korean Society for the Study of
Received: 12 February 2020, Revised: 20 February 2020, Accepted: 27 February 2020
Corresponding author: Eun-Jung Rhee
Department of Endocrinology and Metabolism, Kangbuk Samsung Hospital, Sungkyunkwan University School of Medicine, 29 Saemunan-ro, Jongno-gu, Seoul 03181, Korea
Tel: +82-2-2001-2485, Fax: +82-2-2001-1588, E-mail: [email protected]
Copyright © 2020 Korean Endocrine Society
This is an Open Access article distributed under the terms of the Creative Com- mons Attribution Non-Commercial License (https://creativecommons.org/
licenses/by-nc/4.0/) which permits unrestricted non-commercial use, distribu- tion, and reproduction in any medium, provided the original work is properly cited.
Obesity (KSSO) has released the Obesity Fact Sheet, which is based on an analysis of National Health Insurance Service (NHIS) and Korean National Health and Nutrition Examination Survey (KNHANES) data [2]. Almost every year since 2012, the Korean Diabetes Association (KDA) has released the Dia- betes Fact Sheet, which is based on an analysis of KNHANES data and supplemented by NHIS data [3]. Furthermore, the Ko- rean Society of Hypertension (KSH) released the first Hyper- tension Fact Sheet in 2018 using KNHANES and NHIS data [4]. Lastly, since 2015, the Korean Society of Lipid and Athero- sclerosis (KSoLA) has released the Dyslipidemia Fact Sheet, which is based on an analysis of KNHANES and NHIS data [5].
Although these fact sheets differ in terms of the years of data that are included, they help clinicians and the public to recog- nize the current status of these diseases in Korea and to imple- ment better strategies to promote health.
The NHIS and KNHANES provide two national-scale datas- ets, which are the main sources used to generate these fact sheets. The NHIS provides claims data for almost all beneficia- ries of the NHIS, which covers the entire population of Korea, as well as data from a nationwide medical checkup program, in which biennial examinations are provided to all Koreans older than 20 years [6]. This database contains laboratory data for metabolic parameters, and claims codes for diseases and medi- cations are also available. The KNHANES dataset is construct- ed as part of an ongoing cross-sectional study conducted by the Korea Centers for Disease Control and Prevention that has been assessing the health and nutritional status of Koreans since 1998 [7]. This nationally representative cross-sectional survey in- cludes approximately 10,000 individuals each year as a survey
sample and collects information on socioeconomic status, health-related behaviors, quality of life, healthcare utilization, anthropometric measures, biochemical and clinical profiles for non-communicable diseases, and dietary intake. It has three components: a health interview, a health examination, and a nu- trition survey. The NHIS dataset has the advantage of containing data from the entire Korean population, while the KNHANES dataset furnishes well-sampled data representing the entire Ko- rean population.
In this review, I would like to summarize the information con- tained in the four above mentioned fact sheets, focusing on the prevalence and current management of each disease in Korea to provide insights into the current status and management of car- diovascular risk factors in Korea.
OBESITY FACT SHEET 2019
The KSSO has released the Obesity Fact Sheet since 2015. The fact sheets released over the course of the last 4 years have pre- sented cross-sectional data on obesity and its comorbidities.
Distinct from the previous Obesity Fact Sheets, the Obesity Fact Sheet 2019 focused on changes in the prevalence of obesity over the past 10 years, from 2009 to 2018, primarily on the ba- sis of an analysis of the NHIS database [2,8].
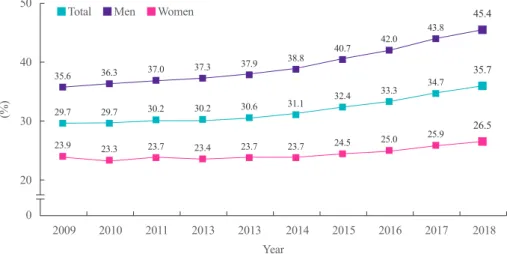
Obesity was defined as a body mass index (BMI) equal to or higher than 25 kg/m2, according to the Asia-Pacific Region defi- nition and the KSSO obesity guideline [9,10]. Over the past 10 years, the prevalence of obesity in Korea markedly increased (Fig. 1). In 2009, the prevalence of obesity in the total popula- tion was 29.7%, which increased to 35.7% in 2018. This trend
50
40
30
20
0
(%)
Year
2009 2010 2011 2013 2013 2014 2015 2016 2017 2018
Fig. 1. Prevalence of obesity in the last 10 years (2009 to 2018). Obesity was defined as a body mass index equal to or higher than 25 kg/m2. Modified from the guidelines of Korean Society for the Study of Obesity [2].
Total Men Women
35.6 36.3 37.0 37.3 37.9 38.8 40.7 42.0 43.8 45.4
29.7 29.7 30.2 30.2 30.6 31.1 32.4 33.3 34.7 35.7
23.9 23.3 23.7 23.4 23.7 23.7 24.5 25.0 25.9 26.5
was similar in both sexes. In 2018, the prevalence of obesity was 45.4% in men and 26.5% in women, showing a higher prevalence in men than in women, as expected (Fig. 2).
Trends in the obesity rate by age and sex over the past 10 years
When the prevalence of obesity was analyzed by age group, it was found that the prevalence of obesity gradually increased in all age groups over the past 10 years [2,8]. The highest preva- lence of obesity was found in adults in their 30s (40.5%), fol- lowed by those in their 60s (40.1%), those in their 70s (39.8%), and those in their 40s (38.3%). The prevalence of obesity in adults in their 20s, 30s, and 80s showed a significantly steeper increasing trend over the past 10 years than was observed in other age groups.
In men, the prevalence of obesity gradually increased over the past 10 years in all age groups, with the highest prevalence of obesity found in men in their 30s (51% in 2018). Men in their 20s and 30s showed steeper increases in the prevalence of obe- sity than were found in other age groups. This increase in the prevalence of obesity in young men reflects a worrisome meta- bolic health threat facing young Korean men.
In women, an increasing trend in the prevalence of obesity was not found in all age groups. Of note, women in their 20s, 30s, 70s, and 80s showed a markedly increasing trend in the prevalence of obesity, while paradoxically, those in their 50s and 60s showed a decreasing trend (32.7% to 30.6% in 50s, 41.4% to 38.7% in 60s) [2,8]. The decrease in the prevalence of obesity in post-menopausal women (50s and 60s) was unex- pected, but a potential explanation is that these are age groups in
which women tend to be relatively economically stable and can therefore take steps to care for their own health through lifestyle modifications.
Trends in the prevalence of abdominal obesity
Abdominal obesity was defined by a waist circumference of at least 90 cm in men and 85cm in women according to the KSSO criteria [10]. The prevalence of abdominal obesity significantly increased over the past 10 years in Korean adults [2,8], with prevalence rates of 23.8% in the total population, 28.1% in men, and 18.2% in women recorded in 2018. Similar to the preva- lence of general obesity assessed by BMI, the prevalence of ab- dominal obesity increased most steeply in adults in their 30s. In contrast, the prevalence of abdominal obesity decreased in those in their 60s. A significant difference from general obesity is that the absolute rate of abdominal obesity was higher in older age groups, with a prevalence of 29.6% in adults in their 60s and 36.1% in those in their 80s; in contrast, the prevalence of ab- dominal obesity was 22.4% in adults in their 30s and 23.4% in those in their 50s. However, the highest rate of increase was found for adults in their 30s (15.8% to 24.5%), overwhelming the rate of increase for adults in their 40s and 50s (16.2% to 22.3% in 40s, 22.2% to 23.4% in 50s).
In men, the prevalence of abdominal obesity gradually in- creased over the past 10 years in all age groups, but the trend was somewhat different from that of the total population. Men in their 70s showed the highest prevalence of abdominal obesity in 2018 (32.5%), followed in order by those in their 30s, 80s, and 60s (30.8%, 30.4%, and 30.0%). In contrast, in the total population, the top-tier prevalence of abdominal obesity was
60
50
40
30
20
10
0
(%)
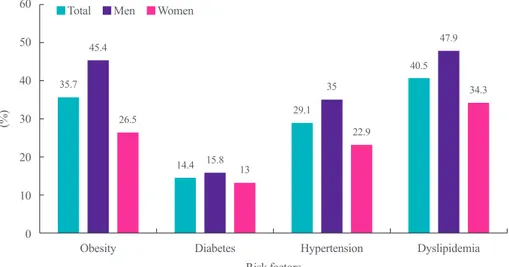
Risk factors Total Men Women
Obesity Diabetes Hypertension Dyslipidemia
Fig. 2. Prevalence of risk factors in Korean adults.
35.7
14.4
29.1
40.5 45.4
15.8
35
47.9
26.5
13
22.9
34.3
found in older age groups (36.1% in 70s, 35.1% in 80s, 29.6%
in 60s). Of note, men in their 30s and 40s were the most severe- ly threatened age groups in terms of the rate of increase in the prevalence of abdominal obesity (18.9% to 30.8% in 30s, 20.7% to 29.1% in 40s). As with general obesity, lifestyle inter- ventions for men in these age groups are warranted.
In women, the highest prevalence of obesity was observed in those in their 70s (39.4%). Similar to the trends observed for general obesity, the prevalence of abdominal obesity decreased in women in their 50s and 60s (19.9% to 19.0% in 50s, 32.8%
to 29.2% in 60s). The prevalence of abdominal obesity in wom- en in their 20s, 30s, and 40s showed an increasing trend (4.4%
to 8.1% in 20s, 7.3% to 11.9% in 30s, and 11.0% to 14.1% in 40s). However, the absolute prevalence was higher in older age groups than in younger age groups.
DIABETES FACT SHEET 2018
The KDA has released the Diabetes Fact Sheet at intervals of 1 to 2 years since 2012. The aims of this fact sheet are to provide accurate statistics on the number of patients with diabetes in Korea and their management status, and to show the severity of the comorbidities and complications of diabetes. In the Diabetes Fact Sheet 2018, information on the prevalence of diabetes, lev- el of management, comorbidities, and health behaviors was ex- tracted from KNHANES data from 2011 to 2016, and the cur- rent status of diabetes treatment was analyzed using health in- surance data from the NHIS [3,11]. The cross-sectional preva-
lence of diabetes was analyzed using KNHANES 2016 data, and trends in the prevalence of diabetes over time were assessed using data from 2011 to 2016 [3]. Individuals were classified as having diabetes if they satisfied any of the following four crite- ria: (1) having been diagnosed with diabetes by a doctor, (2) currently taking anti-diabetic medications, (3) having a fasting plasma glucose (FPG) ≥126 mg/dL, or (4) having a hemoglo- bin A1c (HbA1c) level ≥6.5% [10].
The prevalence of diabetes among adults 30 years or older was 14.4% (15.8% in men and 13.0% in women) when the HbA1c criterion was included in the definition of diabetes (Fig.
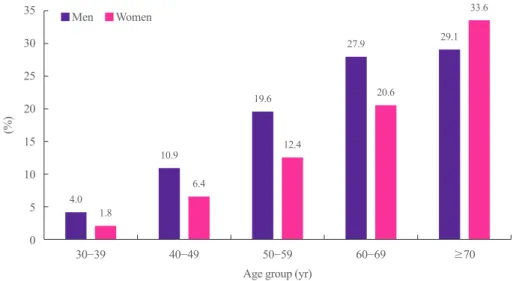
2). The prevalence of diabetes was even higher (29.8%) when the analysis was limited to adults older than 65 years, meaning that one in three Koreans 65 years or older had diabetes. When separate analyses were conducted by age group and sex, the prevalence of diabetes exceeded 10% for men in their 40s (10.9%) and 10% for women in their 50s (12.4%) (Fig. 3). The prevalence of diabetes was higher in women in their 70s than in men in their 70s (33.6% vs. 29.1%).
When the prevalence of diabetes was analyzed serially from 2011 to 2016, it was found to have increased from 12.4% in 2011 to 14.4% in 2016. The increasing trend was similar in men and women.
Prevalence of impaired fasting glucose
Prediabetes refers to glycemic abnormalities that precede diabe- tes [12]. The Diabetes Epidemiology: Collaborative analysis of Diagnostic criteria in Europe (DECODE) study and the Funa-
35 30 25 20 15 10 5 0
(%)
Age group (yr) Men Women
30−39 40−49 50−59 60−69 ≥70
Fig. 3. Prevalence of diabetes by age and sex (2016). Diabetes was defined if they satisfied any of the following four criteria: (1) having been diagnosed with diabetes by a doctor, (2) currently taking anti-diabetic medications, (3) having a fasting plasma glucose ≥ 126 mg/dL, or (4) having a hemoglobin A1c level ≥6.5%. Modified from the guidelines of Korean Diabetes Association [3].
4.0
10.9
19.6
27.9 29.1
1.8
6.4
12.4
20.6
33.6
gata study found that prediabetes was a strong predictor of car- diovascular mortality in comparison to normoglycemic individ- uals [13,14]. Therefore, interventions to lower blood glucose levels should be started in the stage of prediabetes to reduce cardiovascular disease (CVD) risk.
Impaired fasting glucose (IFG) is defined by an FPG of 100 to 125 mg/dL and an HbA1c level <6.5% in people who have not been diagnosed with diabetes [12]. In 2016, the prevalence of IFG among Korean adults 30 years or older was 25.3% in the to- tal population (31% in men and 19.7% in women). In an analysis by age group, the prevalence of IFG steadily increased with age in both sexes, except for individuals in their 70s. The estimated number of Korean adults with IFG was 1.73 times that of those with diabetes, corresponding to 5.02 million patients with diabe- tes and 8.71 million patients with IFG. In total, 13.72 million Korean adults were estimated to suffer from IFG or diabetes.
Management of diabetes
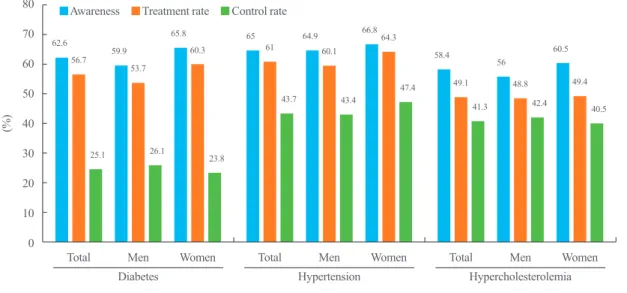
The current status of diabetes management was analyzed. The awareness rate of diabetes was 62.6%, and the treatment rate was 56.7%, which were relatively high compared to other dis- eases (Fig. 4). However, the control rate, defined by an HbA1c level <6.5%, was only 25.1%, which was relatively low consid- ering the high awareness and treatment rates. When the target HbA1c level was defined as <7.0%, the control rate increased to 52.6%. Nonetheless, 20.9% of people with diabetes had an HbA1c level ≥8.0%, indicating that they still had a long way to go to reach a reasonable target.
Comorbidities of diabetes
When the comorbidities of diabetes were analyzed, it was found that 50.4% of people with diabetes were obese, as defined by a BMI ≥25 kg/m2. Class II obesity (BMI 30 to 34.9 kg/m2) was present in 8.4% of people with diabetes, and class III obesity (BMI ≥35.0 kg/m2) was present in 1.8% of people with diabetes.
When abdominal obesity was defined by a waist circumfer- ence ≥90 cm in men and ≥85 cm in women, it was found that 52.2% of people with diabetes had abdominal obesity, a higher proportion than was observed in the general population [10].
Men with diabetes showed a higher prevalence of abdominal obesity than women with diabetes (55.8% vs. 47.9%).
Hypertension was defined by a blood pressure ≥140/90 mm Hg and/or taking anti-hypertensive medications; according to this definition, 55.3% of patients with diabetes had hyperten- sion. Surprisingly, more than seven out of 10 (74.6%) of people 65 years or older with diabetes had hypertension. Controlled hypertension was defined by a blood pressure <140/85 mm Hg according to KDA Treatment Guideline for Diabetes 2015, and roughly seven out of 10 (73.1%) people with diabetes had reached their target blood pressure goal according to this defini- tion [12].
When hypercholesterolemia was defined by a total cholesterol (TC) level ≥240 mg/dL and/or the use of lipid-lowering medi- cations, the prevalence of hypercholesterolemia in people with diabetes was found to be 34.9%. Moreover, only four out of 10 people with diabetes had reached the target goal of a low-densi- ty lipoprotein cholesterol (LDL-C) level <100 mg/dL according
80 70 60 50 40 30 20 10 0
(%)
Diabetes Hypertension
Risk factors
Hypercholesterolemia Awareness Treatment rate Control rate
Total Men Women Total Men Women Total Men Women
Fig. 4. Management of risk factors in Korean adults.
62.6 65
59.9 58.4
64.9
56
65.8 66.8
56.7 61 60.5
49.1 53.7
60.1
48.8
60.3 64.3
49.4
25.1
43.7 41.3
26.1
43.4 42.4
23.8
47.4
40.5
to the KDA Treatment Guideline for Diabetes 2015 [12].
The proportion of people with comprehensive management of diabetes, defined by satisfying all three target of an HbA1c level <6.5%, blood pressure <140/85 mm Hg, and a LDL-C level <100 mg/dL, was 8.4% in people with diabetes, which seems rather low. Comprehensive management of diabetes should be implemented in patients with diabetes to reduce CVD risk, as suggested by findings of the Steno-2 trial [13].
HYPERTENSION FACT SHEET 2018
The KSH released its first fact sheet for hypertension epidemi- ology in 2018, based on an analysis of NHIS and KNHANES data through 2016 [4,15]. Hypertension was defined as a blood pressure ≥140/90 mm Hg and/or taking anti-hypertensive med- ication [16].
According to this fact sheet, 11 million Koreans were esti- mated to have hypertension, approximately 29% of Korean adults older than 30 years. Men showed a higher prevalence of hypertension than women (35% vs. 22.9%) (Fig. 2).
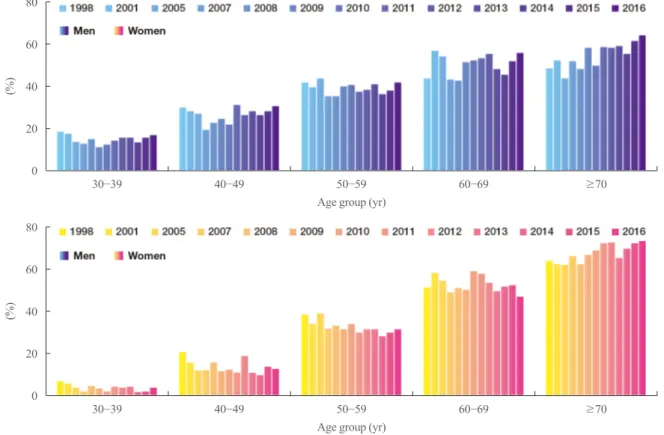
Prevalence of hypertension by age
When the prevalence of hypertension was analyzed by age group and sex, men showed a higher prevalence than women until their 60s, after which women showed a higher prevalence than men, similar to the other diseases discussed above. Since 1998, the prevalence of hypertension has increased in both sex- es, except for women in their 40s to 60s. In general, the preva- lence of hypertension showed a decreasing trend in middle-aged women, as was observed for obesity (Fig. 5).
Management of hypertension
The status of hypertension management was assessed in terms of control, awareness, and treatment rates. The target of blood pressure control was <140/90 mm Hg, according to the KSH guideline for hypertension management [17]. In 2016, the rate of hypertension control was 43.7% among patients diagnosed with hypertension and 70.8% among those who had been treat- ed for hypertension (Fig. 4). In addition, the awareness and treatment rates of hypertension were 65% and 61%, respective- ly, in 2016. When these indices were analyzed over the past 10 years, the awareness, treatment, and control rates of hyperten-
80
60
40
20
0
80
60
40
20
0
(%)(%)
Age group (yr)
Age group (yr) 30−39
30−39
40−49
40−49
50−59
50−59
60−69
60−69
≥70
≥70
Fig. 5. Changes in the prevalence of hypertension by age and sex over time. Hypertension was defined as a blood pressure ≥140/90 mm Hg and/or taking anti-hypertensive medication. Modified from the guidelines of Korean Society of Hypertension [4].
sion steadily increased from 1998 to 2007. However, starting in 2007, the rates remained stagnant for 10 years. Further efforts should be made to improve the management of hypertension.
DYSLIPIDEMIA FACT SHEET 2018
Since 2015, the KSoLA has regularly released the Dyslipidemia Fact Sheet based on national survey data to uphold its mission of preventing and treating atherosclerosis and to improve public awareness of atherosclerosis and its risk factors. The Dyslipid- emia Fact Sheet 2018 was based on KNHANES and NHIS data through 2016 [5].
Prevalence and management of hypercholesterolemia Hypercholesterolemia was defined by a TC level ≥240 mg/dL, previously diagnosed hypercholesterolemia, or the use of any anti-dyslipidemic drugs. The prevalence of hypercholesterol- emia in adults 30 years or older was found to be 19.9% in 2016, meaning that nearly one out of five adults had hypercholesterol- emia. The prevalence increased from 14.4% in 2012 to 19.9%
in 2016. Men and women showed a similar increase in the prev- alence of hypercholesterolemia during this period.
Regarding the management of hypercholesterolemia, the awareness rate of hypercholesterolemia was 58.5% in 2016, meaning that four out of 10 adults with hypercholesterolemia were not aware of their condition (Fig. 4). However, the aware- ness rate steadily increased from 38.8% in the KNHANES IV data (2007 to 2009) to 58.4% in the KNHANES VII data (2016).
The treatment rate of hypercholesterolemia was 49.1% accord- ing to the KNHANES VII data from 2016, meaning half of hy- percholesterolemic patients took lipid-lowering medications.
Lastly, the control rate of hypercholesterolemia was 41.3%, based on a target goal of TC <200 mg/dL. The control rate was much higher (82.7%) in patients taking lipid-lowering drugs, implying that taking lipid-lowering drugs may be an effective way for patients to reach their target cholesterol levels.
Prevalence and management of dyslipidemia
Dyslipidemia was diagnosed in individuals who satisfied one of the three following criteria: an LDL-C level ≥160 mg/dL, a high-density lipoprotein cholesterol (HDL-C) level <40 mg/dL, or a triglyceride (TG) level ≥200 mg/dL. Individuals taking any medications for dyslipidemia or who were previously diag- nosed with dyslipidemia were also classified as having dyslipid- emia.
The mean serum TC level in adults aged 30 years or older was 192.8 mg/dL in men and 193.4 mg/dL in women. The mean levels of TG, HDL-C, and LDL-C were 169.7, 47.0, and 113.8 mg/dL, respectively, in men, and 118.4, 54.0, and 116.2 mg/dL, respectively, in women.
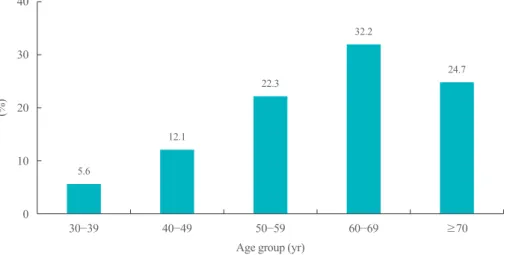
The prevalence of dyslipidemia was 40.5% in the total popu- lation (47.9% in men and 34.3% in women) (Fig. 2). When the prevalence was analyzed by age group, it was found that the prevalence of dyslipidemia gradually increased with age, and that adults in their 60s showed the highest prevalence of dyslip- idemia (55.8%) (Fig. 6).
40
30
20
10
0
(%)
Age group (yr)
30−39 40−49 50−59 60−69 ≥70
Fig. 6. Prevalence of dyslipidemia by age group in Korean adults. Dyslipidemia diagnosed in individuals who satisfied one of the three fol- lowing criteria: a low-density lipoprotein cholesterol ≥160 mg/dL, a high-density lipoprotein cholesterol <40 mg/dL, or a triglyceride ≥ 200 mg/dL. Individuals taking any medications for dyslipidemia or who were previously diagnosed with dyslipidemia were also classified as having dyslipidemia. Modified from the guidelines of Korean Society of Lipid and Atherosclerosis [5].
5.6
12.1
22.3
32.2
24.7
The prevalence of high LDL-C was 17.6%, and it increased with age, from 5.6% in adults in their 30s to 32.3% in those in their 60s. Although the prevalence of high LDL-C in men in their 30s and 40swas higher than that in women belonging to the corresponding age groups, women showed a markedly in- creased prevalence in their 50s. Specifically, the prevalence of high LDL-C was six times higher in women in their 50s than in those in their 30s, which implies that the influence of postmeno- pausal status on LDL-C levels is tremendous. The prevalence of high LDL-C in women in their 60s (39.9%) was higher both than that of women in any other age group and the prevalence among men in the same age group.
In contrast, hypertriglyceridemia showed somewhat different features. The prevalence of hypertriglyceridemia was 17.5% in the total population, with a much higher prevalence in men than in women (24.8% vs. 11.0%). The highest prevalence of hyper- triglyceridemia was observed in men in their 40s (30.5%), and this rate was four times higher than that of women in the same age group. As high TG levels are considered to be a marker of insulin resistance and are one of the components of metabolic syndrome, high TG levels in men in their 40s mean that they are at an increased risk for diabetes and metabolic syndrome [17].
Lifestyle interventions and education about weight control are warranted for men in this age group.
Insulin resistance causes shrinkage and degradation of HDL
particle via the kidney, and low HDL-C levels are considered to be one of the components of metabolic syndrome [18]. HDL-C has anti-atherogenic effects, but HDL-C levels are not easily af- fected by lipid-lowering agents; instead, there is evidence sug- gesting that HDL-C levels are more strongly affected by genetic factors [19]. The prevalence of low HDL-C was found to be 19.4%, and the prevalence of low HDL-C was relatively weakly affected by age in men, as shown by a slight increase from 24.6% in men in their 30s to 30.9% in men after 70 years of age.
However, in women, the prevalence steeply increased with age, from 6.8% in women in their 30s to 22.4% in women after 70 years of age. Although the absolute rate of low HDL-C is lower in women than in men, HDL-C levels seem to be more strongly affected by aging in women than in men.
CONCLUSIONS
To summarize, prevalence of all risk factors significantly in- creased in Korea for the last 10 years. Among the risk factors, the increase in obesity was most noticeable, and this increase was accompanied by other risk factors related with insulin resis- tance, such as diabetes, hypertension and dyslipidemia. Of note, steady deterioration of metabolic risk factors in men in their 30s and 40s was so prominent that life style intervention and weight reduction in these working age groups are nationally warranted.
Table 1. Take Home Message from the Fact Sheets of Cardiovascular Risk Factors in Korea
1. The prevalence of obesity gradually increased in all age groups over the past 10 years and overall prevalence was 35.7% in 2018.
2. The prevalence of obesity in adults in their 20s, 30s, and 80s showed a significantly steeper increasing trend over the past 10 years than was observed in other age groups; the prevalence of obesity in their 50s and 60s was decreased.
3. The prevalence of abdominal obesity significantly increased over the past 10 years in Korean adults, with prevalence rates of 23.8% in the total pop- ulation.
4. Men in their 30s and 40s were the most severely threatened age groups in terms of the rate of increase in the prevalence of abdominal obesity.
5. The prevalence of diabetes among adults 30 years or older was 14.4%; one in three (29.8%) Koreans 65 years or older had diabetes.
6. The control rate of diabetes, defined by a hemoglobin A1c level <6.5%, was 25.1%.
7. The prevalence of IFG among Korean adults 30 years or older was 25.3% in the total population.
8. Eleven million Koreans were estimated to have hypertension, approximately 29% of Korean adults older than 30 years.
9. The awareness, treatment, and control rates of hypertension steadily increased from 1998 to 2007; however, starting from 2007, the rates remained stagnant for 10 years.
10. The prevalence of hypercholesterolemia in adults 30 years or older was found to be 19.9% in 2016; the prevalence increased from 14.4% in 2012 to 19.9% in 2016.
11. The prevalence of dyslipidemia was 40.5% in the total population; the prevalence of high low-density lipoprotein cholesterol in women in their 60s (39.9%) was higher both than that of women in any other age group and the prevalence among men in the same age group; the prevalence of hyper- triglyceridemia was 17.5% in the total population, with a much higher prevalence in men than in women (24.8% vs. 11.0%).
IFG, impaired fasting glucose.
Unexpectedly, women in their 50s and 60s showed relatively decreasing trend for obesity compared to other age groups, and men in the same age group. These finding could be partly attrib- uted to economic growth of Korea in that women in these age can have spare time and money to take care of their health. De- creasing trend of prevalence of hypertension in women in these age groups support this hypothesis. Prevalence of diabetes show increasing trend and one in 7 Korean adults suffer from diabe- tes. Surprisingly, one in three Koreans in their 60s have diabe- tes, an alarm for healthcare burden in superaged Korean society.
Fortunately, awareness and treatment rate steadily improved over the past 10 years for hypertension and hypercholesterol- emia in Korean adults, although control rates are still low, espe- cially for diabetes (Table 1).
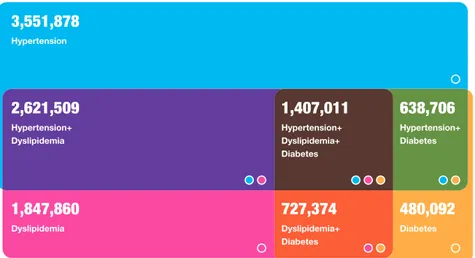
The interactions between cardiovascular risk factors such as diabetes, hypertension, obesity, dyslipidemia and the events themselves cannot be separated in any circumstances. There is a tremendous amount of evidence proving the effectiveness of optimal control of risk factors on the prevention of CVD and re- sultant mortality. According to NHIS data, 2.6 million Koreans have both hypertension and dyslipidemia, 0.72 million have both diabetes and dyslipidemia, 0.64 million have both hyper- tension and diabetes, and 1.4 million have all three diseases (Fig. 7). Simultaneously having multiple of these risk factors exponentially increases cardiovascular risk compared to having only a single risk factor [13,20].
As discussed in this review, hypertension and dyslipidemia can be relatively easily controlled by medications. However, despite a large number of novel anti-diabetic drugs, glycemic targets are still difficult to reach. Similarly, reducing body
weight to combat obesity is an extremely difficult task for an obese person. However, if one were to ask about the best way to prevent or treat all these risk factors, I would recommend weight reduction above all other interventions. Education and the provision of accurate information on lifestyle modifications as early as possible in the life course may be the most effective way to prevent people from proceeding down the pathway that leads to CVD.
CONFLICTS OF INTEREST
No potential conflict of interest relevant to this article was re- ported.
ORCID
Eun-Jung Rhee https://orcid.org/0000-0002-6108-7758
REFERENCES
1. Korean Statistical Information Service. Population in old ages [Internet]. Daejeon: Statistics Korea; 2020 [cited 2020 Feb 24]. Available from: https://kosis.kr/eng/.
2. Korean Society for the Study of Obesity. Obesity Fact Sheet [Internet]. Seoul: KOSSO; 2020 [cited 2020 Feb 24]. Avail- able from: http://www.kosso.or.kr/popup/obesity_fact_sheet.
html.
3. Korean Diabetes Association. Diabetes Fact Sheet in Korea [Internet]. Seoul: KDA; 2020 [cited 2020 Feb 24]. Available from: https://www.diabetes.or.kr/pro/news/admin.php?
3,551,878
Hypertension
2,621,509
Hypertension+
Dyslipidemia
1,847,860
Dyslipidemia
1,407,011
Hypertension+
Dyslipidemia+
Diabetes
638,706
Hypertension+
Diabetes
480,092
Diabetes
727,374
Dyslipidemia+
Diabetes
Fig. 7. Concurrent treatment of hypertension, diabetes, and dyslipidemia in Korean adults. Modified from the guidelines of Korean Diabetes Association [3].
mode=list&category=A.
4. The Korean Society of Hypertension. 2018 Fact Sheet [Inter- net]. Seoul: KDA; 2020 [cited 2020 Feb 24]. Available from:
http://www.koreanhypertension.org/reference/guide?mode=
read&idno=4166.
5. The Korean Society of Lipid and Atherosclerosis. Dyslipid- emia Fact Sheet 2018 [Internet]. Seoul: KDA; 2020 [cited 2020 Feb 24]. Available from: https://www.lipid.or.kr/bbs/?
code=fact_sheet.
6. Lee YH, Han K, Ko SH, Ko KS, Lee KU; Taskforce Team of Diabetes Fact Sheet of the Korean Diabetes Association.
Data analytic process of a nationwide population-based study using national health information database established by National Health Insurance Service. Diabetes Metab J 2016;
40:79-82.
7. Kweon S, Kim Y, Jang MJ, Kim Y, Kim K, Choi S, et al.
Data resource profile: the Korea National Health and Nutri- tion Examination Survey (KNHANES). Int J Epidemiol 2014;43:69-77.
8. Nam GE, Kim YH, Han K, Jung JH, Park YG, Lee KW, et al. Obesity fact sheet in Korea, 2018: data focusing on waist circumference and obesity-related comorbidities. J Obes Metab Syndr 2019;28:236-45.
9. WHO Expert Consultation. Appropriate body-mass index for Asian populations and its implications for policy and in- tervention strategies. Lancet 2004;363:157-63.
10. Seo MH, Lee WY, Kim SS, Kang JH, Kang JH, Kim KK, et al. 2018 Korean Society for the Study of Obesity guideline for the management of obesity in Korea. J Obes Metab Syn- dr 2019;28:40-5.
11. Kim BY, Won JC, Lee JH, Kim HS, Park JH, Ha KH, et al.
Diabetes fact sheets in Korea, 2018: an appraisal of current
status. Diabetes Metab J 2019;43:487-94.
12. Kim MK, Ko SH, Kim BY, Kang ES, Noh J, Kim SK, et al.
2019 Clinical practice guidelines for type 2 diabetes mellitus in Korea. Diabetes Metab J 2019;43:398-406.
13. Zhang L, Qiao Q, Tuomilehto J, Hammar N, Ruotolo G, Ste- houwer CD, et al. The impact of dyslipidaemia on cardiovas- cular mortality in individuals without a prior history of dia- betes in the DECODE Study. Atherosclerosis 2009;206:298- 302.
14. Tominaga M, Eguchi H, Manaka H, Igarashi K, Kato T, Sekikawa A. Impaired glucose tolerance is a risk factor for cardiovascular disease, but not impaired fasting glucose: the Funagata Diabetes Study. Diabetes Care 1999;22:920-4.
15. Korean Society Hypertension (KSH); Hypertension Epide- miology Research Working Group, Kim HC, Cho MC. Ko- rea hypertension fact sheet 2018. Clin Hypertens 2018;24:13.
16. Gaede P, Lund-Andersen H, Parving HH, Pedersen O. Ef- fect of a multifactorial intervention on mortality in type 2 diabetes. N Engl J Med 2008;358:580-91.
17. Kwon YH, Kim SK, Cho JH, Kwon H, Park SE, Oh HG, et al. The association between persistent hypertriglyceridemia and the risk of diabetes development: the Kangbuk Samsung Health Study. Endocrinol Metab (Seoul) 2018;33:55-61.
18. Wu L, Parhofer KG. Diabetic dyslipidemia. Metabolism 2014;63:1469-79.
19. Parhofer KG. Increasing HDL-cholesterol and prevention of atherosclerosis: a critical perspective. Atheroscler Suppl 2015;
18:109-11.
20. Rawshani A, Rawshani A, Franzen S, Sattar N, Eliasson B, Svensson AM, et al. Risk factors, mortality, and cardiovascu- lar outcomes in patients with type 2 diabetes. N Engl J Med 2018;379:633-44.