Obesity Fact Sheet in Korea, 2019: Prevalence of Obesity and Abdominal Obesity from 2009 to 2018 and Social Factors
Ga Eun Nam
1, Yang-Hyun Kim
1,*, Kyungdo Han
2, Jin-Hyung Jung
3, Eun-Jung Rhee
4, Seong-Su Lee
5, Dae Jung Kim
6, Kwan-Woo Lee
6, Won-Young Lee
4,*, on behalf of the Taskforce Team of the Obesity Fact Sheet of the Korean Society for the Study of Obesity
1
Department of Family Medicine, Korea University College of Medicine, Seoul;
2Department of Statistics and Actuarial Science, Soongsil University, Seoul;
3
Department of Biostatistics, College of Medicine, The Catholic University of Korea, Seoul;
4Division of Endocrinology and Metabolism, Department of Internal Medicine, Kangbuk Samsung Hospital, Sungkyunkwan University School of Medicine, Seoul;
5Division of Endocrinology and Metabolism, Department of Internal Medicine, Bucheon St. Mary’s Hospital, College of Medicine, The Catholic University of Korea, Bucheon;
6Department of Endocrinology and Metabolism, Ajou University School of Medicine, Suwon, Korea
Background: The prevalence of obesity has rapidly increased in countries across the world in recent decades.
The 2019 Obesity Fact Sheet released by the Korean Society for the Study of Obesity addressed the prevalence of obesity and abdominal obesity during the period of 2009 to 2018 and obesity-related social factors.
Methods: Data from the Korean National Health Insurance Service health checkup database between 2009 and 2018 and the Korea National Health and Nutrition Examination Survey between 2010 and 2017 were ana- lyzed. The prevalence of obesity and abdominal obesity was calculated after standardizing for age and sex based on the 2010 population and housing census.
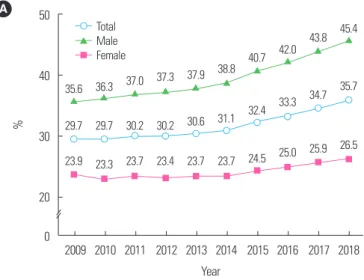
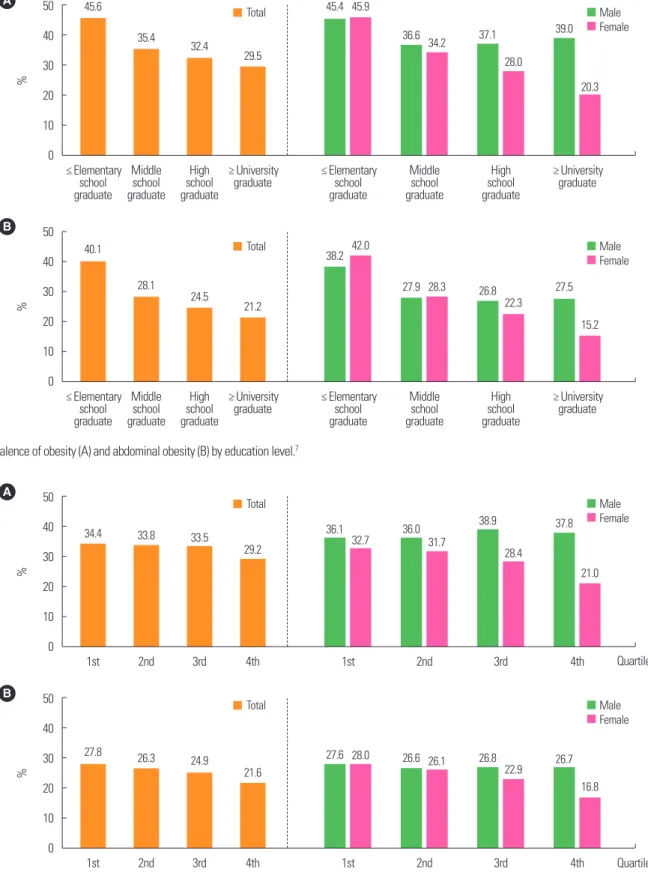
Results: From 2009 to 2018, the prevalence of obesity and abdominal obesity increased to 35.7% and 23.8%, respectively, in 2018. Upward trends in the prevalence of obesity and abdominal obesity was observed among both sexes and nearly all age groups. The prevalence of obesity and abdominal obesity was higher among indi- viduals with lower education and household income levels. Among occupations, managers exhibited the high- est prevalence of obesity and abdominal obesity. Further, the prevalence of obesity and abdominal obesity be- came higher among individuals working longer hours and split and night shift workers.
Conclusion: The 2019 Obesity Fact Sheet provides information on changes in obesity dynamics during the past decade and obesity-related social factors in the Korean adult population. This report might constitute a cor- nerstone by which to establish targets for future interventions for reversing the rise in the prevalence of obesity and reducing the burden of obesity in Korea.
Key words: Obesity, Abdominal obesity, Prevalence, Social factors, Fact sheet, National Health Insurance Service
Received June 4, 2020 Reviewed June 13, 2020 Accepted June 21, 2020
* Corresponding author Won-Young Lee
https://orcid.org/0000-0002-1082-7592 Division of Endocrinology and Metabolism, Department of Internal Medicine, Kangbuk Samsung Hospital, Sungkyunkwan University School of Medicine, 29 Saemunan-ro, Jongno-gu, Seoul 03181, Korea
Tel: +82-2-2001-2579 Fax: +82-2-2001-1588 E-mail: [email protected]
*Co-Corresponding author Yang-Hyun Kim
https://orcid.org/0000-0003-3548-8758 Department of Family Medicine, Korea University College of Medicine, 73 Goryeodae-ro, Seongbuk-gu, Seoul 02841, Korea
Tel: +82-2-920-5104 Fax: +82-2-928-8083 E-mail: [email protected]
Copyright © 2020 Korean Society for the Study of Obesity
This is an Open Access article distributed under the terms of the Creative Commons Attribution Non-Commercial License (https://creativecommons.org/licenses/by-nc/4.0/) which permits unrestricted non-commercial use, distribution, and reproduction in any medium, provided the original work is properly cited.
eISSN 2508-7576
2017-03-16 https://crossmark-cdn.crossref.org/widget/v2.0/logos/CROSSMARK_Color_square.svg
Original Article
Obesity Fact Sheet in Korea, 2019: Prevalence of Obesity and Abdominal Obesity from 2009 to 2018 and Social Factors
Ga Eun Nam
1, Yang-Hyun Kim
1,*, Kyungdo Han
2, Jin-Hyung Jung
3, Eun-Jung Rhee
4, Seong-Su Lee
5, Dae Jung Kim
6, Kwan-Woo Lee
6, Won-Young Lee
4,*, on behalf of the Taskforce Team of the Obesity Fact Sheet of the Korean Society for the Study of Obesity
1
Department of Family Medicine, Korea University College of Medicine, Seoul;
2Department of Statistics and Actuarial Science, Soongsil University, Seoul;
3