PGHN
Original Article
The Association between Socioeconomic Status and Obesity in Korean Children: An Analysis of the Fifth Korea National Health and Nutrition Examination Survey (2010-2012)
Hae Jeong Lee*, Sung Hoon Kim*, Seo Heui Choi, and Ju Suk Lee
Department of Pediatrics, Samsung Changwon Hospital, Sungkyunkwan University School of Medicine, Changwon, Korea
Purpose: Obesity is one of the most common health problems among children and its prevalence has increased in recent decades. Socioeconomic status (SES) is a well-known risk factor for childhood obesity although the associa- tions were different across countries. Previous studies in other countries have reported a positive association be- tween childhood obesity and SES in developing countries, and inverse correlation has been reported in developed countries. For this reason, we wanted to investigate the relationship between SES and obesity in Korean children.
Methods: Data were acquired 3,095 boys and girls who participated in the fifth Korea National Health and Nutrition Examination Survey, which was conducted from 2010 to 2012. Body mass index was calculated from measured anthropometric data using the 2007 Korean National Growth Charts.
Results: Upon univariate analysis, we did not find any statistically significant differences in the parental employment status, monthly family income between children with and without obesity. Multiple logistic regression analysis showed childhood obesity was positively associated with maternal overweight (OR, 1.889; 95% CI, 1.079-3.309), maternal obesity (OR, 3.409; 95% CI, 2.228-5.215) and paternal obesity (OR, 2.135; 95% CI, 1.257-3.627).
Conclusion: The present study showed that socioeconomic status might not an important risk factor for obesity in Korean children. These results warrant further studies to clarify the association between SES and obesity in Korean children.
Key Words: Obesity, Income, Education
Received:February 7, 2017, Revised:February 22, 2017, Accepted:March 2, 2017
Corresponding author: Ju Suk Lee, Department of Pediatrics, Samsung Changwon Hospital, Sungkyunkwan University School of Medicine, 158 Paryong-ro, Masanhoewon-gu, Changwon 51353, Korea. Tel: +82-55-233-5310, Fax: +82-55-233-5329, E-mail: [email protected]
*These authors contributed equally to this work.
Copyright ⓒ 2017 by The Korean Society of Pediatric Gastroenterology, Hepatology and Nutrition
This is an openaccess article distributed under the terms of the Creative Commons Attribution NonCommercial License (http://creativecommons.org/licenses/by-nc/4.0/) which permits unrestricted noncommercial use, distribution, and reproduction in any medium, provided the original work is properly cited.
INTRODUCTION
Obesity is one of the most common public health problems among children. The worldwide preva-
lence of childhood obesity has increased in recent decades [1,2], and the incidence of childhood obesity is also rising in Korea [3].
While the exact reason for this increasing preva-
lence of obesity is unclear, it is widely believed that genetics [4], ethnicity [5], lower physical activity [6], diet [7], shorter sleep [8], and socioeconomic status (SES) [9] contribute to the etiology of obesity.
SES is a well-known risk factor for childhood obe- sity, although many controversies remain regarding the association between SES and obesity. Many pre- vious studies have reported that individuals with lower SES are at an increased risk for obesity than those with higher SES [9,10], but other studies re- ported that individuals in higher SES groups tend to be more obese than those in low SES groups [11,12].
In previous Korean studies [13-15], results have shown that SES might be an important risk factor for childhood obesity, but the results have not been consistent. Therefore, we investigated whether lower SES was associated with childhood obesity using the most recent dataset (Korea National Health and Nutrition Examination Survey [KNHANES]:
2010-2012).
MATERIALS AND METHODS
Study population
This study was based on data obtained from the fifth KNHANES. The KNHANES was a cross-sec- tional survey designed to examine the health and nutritional status of the non-institutionalized Korean population. It was conducted by the Division of Chronic Disease Surveillance at the Korea Centers for Disease Control and Prevention (KCDC). Data were collected in a variety of ways, including house- hold interviews, physical examinations, laboratory tests, and nutritional status assessments. All survey protocols were approved by the KCDC Institutional Review Board. Written informed consent was ob- tained from all participants before the survey began.
We included 5,250 people younger than 18 years of age from the total of 18,066 who participated in the fifth KNHANES study (2010-2012). We excluded participants who we did not have data from both pa- rents and under 2 years old aged children. The re- maining 3,095 participants (1,640 boys and 1,455 girls) were included in the final analysis.
General characteristics, anthropometrics and the definition of obesity
The health interview and health behavior surveys included well-established questions to determine the demographic and socioeconomic characteristics of the participants. These surveys included questions regarding age, sex, height, weight, residence area, family income, education level, employment status, marital status, smoking habits and number of house- hold members. The respondents’ residential areas were categorized as urban (an administrative divi- sion of a city) or rural (not classified as an admin- istrative division of a city). The definition of a city in Korea is a place where more than 50,000 people live and that is larger than a town. Monthly family in- come indicates monthly equalized family income and was calculated by dividing total family income by the square root of the number of household members. In KNHANES, monthly family income was classified into quartiles to determine monthly household income level (1, low; 2, middle low; 3, middle high; 4, high). Education level was defined as less than high school, high school or college or more.
Cigarette use was divided into three categories: cur- rent smoker, ex-smoker and non-smoker.
The directly measured anthropometric data (height, weight and body mass index [BMI]) were trans- formed to the age- and sex-specific percentiles based on the 2007 Korean Growth Charts [16]. The weight status of children was classified as obese (BMI, ≥95th percentile for BMI-for-age), overweight (BMI, 85th to 95th percentile), and normal weight (BMI, <85th percentile) according to the 2007 Korean National Growth Charts [16]. The weight status of parents was classified as normal weight (BMI, <25.0 kg/m2), overweight (BMI, 25.0-29.9 kg/m2), and obese (BMI, ≥30 kg/m2) according to World Health Organization reference [17].
Statistical analyses
We conducted all statistical analyses using SPSS complex sample procedure because KNHANES data was collected through a representative, stratified, and clustered sampling method. For more accurate
statistical comparisons, univariate analysis was con- ducted to select significant covariates. After selection of significant covariates, we carried out binary logis- tic regression analysis to identify the relationships between risk factors and the prevalence of obesity.
Statistical analysis was conducted using the IBM SPSS Statistics ver. 21.0 (IBM Co., Armonk, NY, USA). For all analyses, p-values were two-tailed, and a p-value less than 0.05 was considered statistically significant.
Ethics statement
The study protocol was approved by the institu- tional review board (IRB) of Samsung Changwon Hospital (IRB no. 2016-SCMC-019-00). Informed consent was exempted by the board.
RESULTS
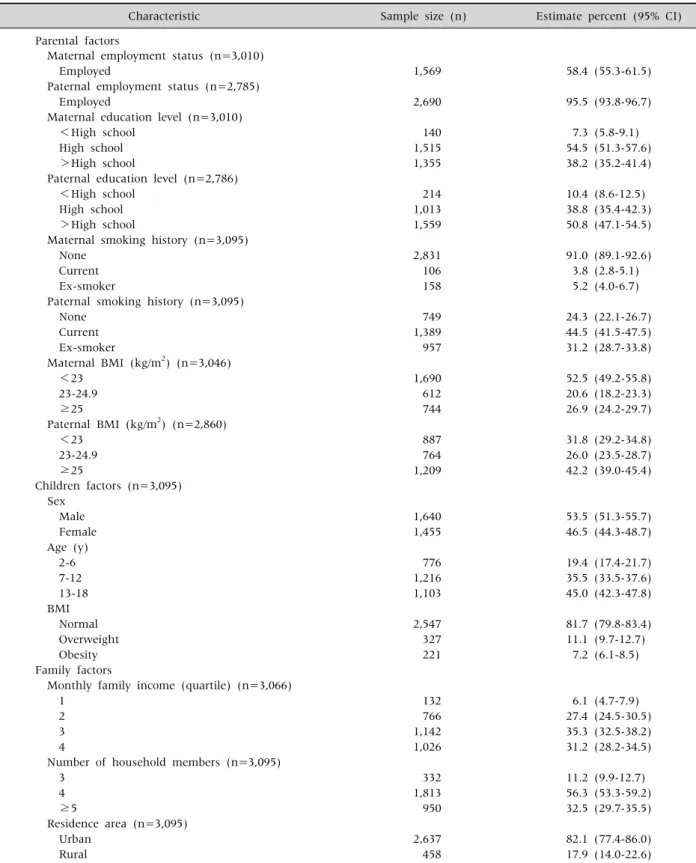
Table 1 summarized clinical characteristics of participants. A total of 3,095 boys and girls from the 2010-2012 periods of the fifth KNHANES were in- cluded in this study, and 3,010 mothers and 2,785 fa- thers were also included. Most of the fathers were employed (95.5%), and the majority of parent had a higher than high school education level (92.7% for mothers, 89.6% for fathers). Current smoking was more prevalent in fathers (44.5%), while mothers were more likely to be non-smokers (91.0%). The mean age of the children was 10.0±4.6, and the pro- portion of boys was 53.5%. Most enrolled children lived in urban areas (82.1%). The prevalence of child- hood obesity was 7.2%, and the proportion of over- weight children was 11.1%.
Upon univariate analysis, we did not find any stat- istically significant differences in the parental em- ployment status, parental education level, parental smoking history, sex, age, monthly family income, number of household members and residence area between children with and without obesity. Compared with the normal weight children, obese children were more prone to have obese mothers (odds ratio [OR], 3.385; 95% confidence interval [CI], 2.233-5.131), obese fathers (OR, 2.308; 95% CI, 1.374-3.876), over-
weight mothers (OR, 1.978, 95% CI, 1.194-3.275) (Table 2).
After controlling for confounding factors, the bi- nary logistic regression analysis showed over- weight mothers (adjusted OR [aOR], 1.889; 95% CI, 1.079-3.309), obese mothers (aOR, 3.409; 95% CI, 2.228-5.215), obese fathers (aOR, 2.135, 95% CI, 1.257-3.627) were associated with childhood obesity (Table 3).
Overweight mothers (aOR, 1.493; 95% CI 1.042-2.140), obese mothers (aOR, 2.551; 95% CI, 1.882-3.458), overweight fathers (aOR, 1.477; 95%
CI, 1.030-2.119) and obese fathers (OR, 2.776; 95%
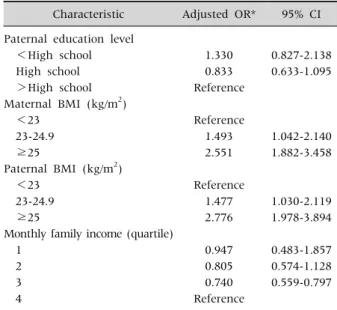
CI, 1.978-3.894), were significant factors in binary logistic regression analysis comparing between chil- dren with normal weight and those with overweight and obesity (Table 4).
DISCUSSION
In our study, childhood obesity was positively as- sociated with maternal overweight, maternal obe- sity, paternal obesity. Parental obesity is a well-known risk factor of childhood obesity [13,18]. Our results were similar to results of previous studies. Genetics and environmental components are both known to be associated with obesity. Obesity-related genes are inherited from obese parents to their children [19].
In regard to epigenetics, the inherited obesity-re- lated genes interact with the personal environment and this interaction can drive the development of childhood obesity [20]. Epigenetic changes can in- fluence obesity related hormones such as leptin (re- duces food intake and decreases body weight) [21], insulin (increases food intake, adiposity, and periph- eral insulin resistance) [22], and ghrelin (promotes feeding, suppresses energy expenditure, and causes weight gain) [23]. Moreover, familial life style is an important risk factor of childhood obesity [24] and parental eating behaviors are likely to determine the dietary patterns of children at an early age [25]. In our study, maternal overweight and obesity more in- fluenced childhood obesity than paternal over- weight and obesity. These results were also observed
Table 1.Baseline Characteristics of Parents and Children
Characteristic Sample size (n) Estimate percent (95% CI)
Parental factors
Maternal employment status (n=3,010)
Employed 1,569 58.4 (55.3-61.5)
Paternal employment status (n=2,785)
Employed 2,690 95.5 (93.8-96.7)
Maternal education level (n=3,010)
<High school 140 7.3 (5.8-9.1)
High school 1,515 54.5 (51.3-57.6)
>High school 1,355 38.2 (35.2-41.4)
Paternal education level (n=2,786)
<High school 214 10.4 (8.6-12.5)
High school 1,013 38.8 (35.4-42.3)
>High school 1,559 50.8 (47.1-54.5)
Maternal smoking history (n=3,095)
None 2,831 91.0 (89.1-92.6)
Current 106 3.8 (2.8-5.1)
Ex-smoker 158 5.2 (4.0-6.7)
Paternal smoking history (n=3,095)
None 749 24.3 (22.1-26.7)
Current 1,389 44.5 (41.5-47.5)
Ex-smoker 957 31.2 (28.7-33.8)
Maternal BMI (kg/m2) (n=3,046)
<23 1,690 52.5 (49.2-55.8)
23-24.9 612 20.6 (18.2-23.3)
≥25 744 26.9 (24.2-29.7)
Paternal BMI (kg/m2) (n=2,860)
<23 887 31.8 (29.2-34.8)
23-24.9 764 26.0 (23.5-28.7)
≥25 1,209 42.2 (39.0-45.4)
Children factors (n=3,095) Sex
Male 1,640 53.5 (51.3-55.7)
Female 1,455 46.5 (44.3-48.7)
Age (y)
2-6 776 19.4 (17.4-21.7)
7-12 1,216 35.5 (33.5-37.6)
13-18 1,103 45.0 (42.3-47.8)
BMI
Normal 2,547 81.7 (79.8-83.4)
Overweight 327 11.1 (9.7-12.7)
Obesity 221 7.2 (6.1-8.5)
Family factors
Monthly family income (quartile) (n=3,066)
1 132 6.1 (4.7-7.9)
2 766 27.4 (24.5-30.5)
3 1,142 35.3 (32.5-38.2)
4 1,026 31.2 (28.2-34.5)
Number of household members (n=3,095)
3 332 11.2 (9.9-12.7)
4 1,813 56.3 (53.3-59.2)
≥5 950 32.5 (29.7-35.5)
Residence area (n=3,095)
Urban 2,637 82.1 (77.4-86.0)
Rural 458 17.9 (14.0-22.6)
BMI: body mass index, 95% CI: 95% confidence interval.
Table 2.Crude Odds Ratio (OR) and 95% Confidence Interval (CI) for the Prevalence of Childhood Obesity
Characteristic Crude OR 95% CI
Maternal employment status
Employed 1.081 0.700-1.670
Paternal employment status
Employed 1.766 0.515-6.052
Maternal education level
<High school 1.809 0.582-5.627
High school 1.366 0.938-1.989
>High school Reference
Paternal education level
<High school 1.693 0.886-3.235
High school 1.258 0.835-1.896
>High school Reference
Maternal smoking history
None Reference
Current 2.058 0.862-4.914
Ex-smoker 0.951 0.419-2.155
Paternal smoking history
None Reference
Current 0.690 0.399-1.192
Ex-smoker 0.666 0.374-1.186
Maternal BMI (kg/m2)
<23 Reference
23-24.9 1.978 1.194-3.275
≥25 3.385 2.233-5.131
Paternal BMI (kg/m2)
<23 Reference
23-24.9 1.564 0.940-2.601
≥25 2.308 1.374-3.876
Sex
Male 0.758 0.521-1.103
Age (y)
2-6 Reference
7-12 1.336 0.806-2.215
13-18 1.294 0.805-2.079
Monthly family income (quartile)
1 1.575 0.727-3.410
2 1.079 0.701-1.661
3 0.651 0.402-1.053
4 Reference
Number of household members
3 Reference
4 0.958 0.554-1.658
≥5 1.270 0.736-2.192
Residence area
Rural 1.144 0.654-2.002
BMI: body mass index.
in a previous study [26]. We thought this association due to more similarity in nutrient intake between mothers and children than between fathers and chil-
dren [27]. Traditionally, in Korea, mothers have more responsibility for children care and takes more time than fathers have.
Table 3. Adjusted Odds Ratio (OR) and 95% Confidence Interval (CI) for the Prevalence of Childhood Obesity
Characteristic Adjusted OR* 95% CI Maternal BMI (kg/m2)
<23 Reference
23-24.9 1.889 1.079-3.309
≥25 3.409 2.228-5.215
Paternal BMI (kg/m2)
<23 Reference
23-24.9 1.406 0.840-2.354
≥25 2.135 1.257-3.627
*Adjusted for maternal body mass index (BMI), paternal BMI.
Table 4. Adjusted Odds Ratio (OR) and 95% Confidence Interval (CI) for the Prevalence of Childhood Overweight (Including Obesity)
Characteristic Adjusted OR* 95% CI Paternal education level
<High school 1.330 0.827-2.138
High school 0.833 0.633-1.095
>High school Reference
Maternal BMI (kg/m2)
<23 Reference
23-24.9 1.493 1.042-2.140
≥25 2.551 1.882-3.458
Paternal BMI (kg/m2)
<23 Reference
23-24.9 1.477 1.030-2.119
≥25 2.776 1.978-3.894
Monthly family income (quartile)
1 0.947 0.483-1.857
2 0.805 0.574-1.128
3 0.740 0.559-0.797
4 Reference
*Adjusted for paternal education level, maternal body mass index (BMI), paternal BMI, and monthly family income.
We did not find any association between parental employment status and childhood obesity. The asso- ciation between parental employment and child- hood obesity was controversial. European study showed maternal work hours have no effect on child overweight and obesity [28], but the other study showed parental work hours increased the preva- lence of childhood obesity in United States [29]. We assumed these different results might be due to cul- tural difference in child care system.
In our study, the association between childhood obesity was not dependent on their age and gender.
Because childhood obesity was defined as more than 95th percentile BMI for BMI-for-age in our study, obesity was not significantly associated with gender and age in children.
Our study showed parental smoking was not asso- ciated with childhood obesity. The effect of paternal smoking on childhood obesity was inconsistent.
Some study reported no association between pater- nal smoking and childhood obesity [30], but the oth- er study reported positive associations [31]. Previous study showed maternal smoking was positively asso- ciated with childhood obesity in non-Hispanic white and non-Hispanic Black mothers, while maternal smoking was not associated with childhood obesity in Asian mothers [32].
We did not find urban-rural differences in child- hood obesity. The association between residence area and childhood obesity was controversial. One study reported no difference between residence area
in childhood obesity [33], the others study reported higher prevalence of childhood obesity in rural area [34]. Because the proportion of urban residence in our study was higher than previous study [34], we thought higher proportion of residence in urban might have some role in our study result.
In our study, number of household members was not associated with childhood obesity, which was different from a previous study [35]. In a previous study, they reported number of household members was negatively associated with childhood obesity [35]. We assume these results might be due to racial or cultural difference.
Two Korean studies using national representative sample data from KNHANES (2007-2010, 1998-2009) showed that SES did not have any association with childhood obesity [13,14]. However, another study using a national representative sample (2009 Korean Survey on the Obesity of Youth and Children) showed that lower SES was associated with childhood obe- sity [15]. In our study, we found lower SES (parental education, monthly family income) was associated with childhood obesity, but not significant. In pre-
vious studies, developed countries have an increas- ing prevalence of childhood obesity in lower SES group [9,10], but developing countries showed an increasing prevalence of obesity in higher SES group [11,12]. Korea is a recently developed country, and we thought our study results might be similar from other studies in developed countries [9,10].
This study had several limitations. First, because this study was cross-sectional, we could not confirm causality as an explanation for the observed asso- ciations. Second, even though this study was based on a national survey, the different results from pre- vious studies might be due to a selection bias or a re- call bias. Despite these limitations, this study has im- portant implications. First, this study used a na- tional, widely sampled dataset to determine the as- sociation between SES and obesity in Korean children.
Second, we were able to adequately address the asso- ciation between SES and childhood obesity and to shine more light on the discrepancies in previous Korean studies.
Considering the results of other studies, we sug- gest that SES might be not an important risk factor of obesity in Korean children. Although this hypoth- esis will require further study, we conclude that each socioeconomic factor affects childhood obesity in a different manner in each country.
REFERENCES
1. Bundred P, Kitchiner D, Buchan I. Prevalence of over- weight and obese children between 1989 and 1998: pop- ulation based series of cross sectional studies. BMJ 2001;322:326-8.
2. Troiano RP, Flegal KM, Kuczmarski RJ, Campbell SM, Johnson CL. Overweight prevalence and trends for children and adolescents. The national health and nu- trition examination surveys, 1963 to 1991. Arch Pediatr Adolesc Med 1995;149:1085-91.
3. Oh K, Jang MJ, Lee NY, Moon JS, Lee CG, Yoo MH, et al. Prevalence and trends in obesity among Korean chil- dren and adolescents in 1997 and 2005. Korean J Pediatr 2008;51:950-5.
4. Ramachandrappa S, Farooqi IS. Genetic approaches to understanding human obesity. J Clin Invest 2011;
121:2080-6.
5. Freedman DS, Khan LK, Serdula MK, Ogden CL, Dietz WH. Racial and ethnic differences in secular trends for childhood BMI, weight, and height. Obesity (Silver Spring) 2006;14:301-8.
6. Janssen I. Active play: an important physical activity strategy in the fight against childhood obesity. Can J Public Health 2014;105:e22-7.
7. Moreno LA, Rodríguez G. Dietary risk factors for devel- opment of childhood obesity. Curr Opin Clin Nutr Metab Care 2007;10:336-41.
8. Al Mamun A, Lawlor DA, Cramb S, O'Callaghan M, Williams G, Najman J. Do childhood sleeping problems predict obesity in young adulthood? Evidence from a prospective birth cohort study. Am J Epidemiol 2007;
166:1368-73.
9. Nogueira H, Gama A, Mourão I, Marques V, Ferrão M, Padez C. The associations of SES, obesity, sport activ- ity, and perceived neighborhood environments: is there a model of environmental injustice penalizing Portuguese children? Am J Hum Biol 2013;25:434-6.
10. Thibault H, Carriere C, Langevin C, Kossi Déti E, Barberger-Gateau P, Maurice S. Prevalence and fac- tors associated with overweight and obesity in French primary-school children. Public Health Nutr 2013;16:
193-201.
11. Dinsa GD, Goryakin Y, Fumagalli E, Suhrcke M.
Obesity and socioeconomic status in developing coun- tries: a systematic review. Obes Rev 2012;13:1067-79.
12. Wang Y. Cross-national comparison of childhood obe- sity: the epidemic and the relationship between obesity and socioeconomic status. Int J Epidemiol 2001;30:
1129-36.
13. Lee HS, Duffey KJ, Kim CI, Popkin BM. The relation- ship between family and child weight status by house- hold structure in South Korea: 2007-2010. Nutr Diabetes 2013;3:e73.
14. Nam SY, Lee SK. The associations between socio- economic status and obesity in Korean children from 1998 to 2009. Health 2013;5:1899-904.
15. Noh JW, Kim YE, Oh IH, Kwon YD. Influences of socio- economic factors on childhood and adolescent over- weight by gender in Korea: cross-sectional analysis of nationally representative sample. BMC Public Health 2014;14:324.
16. Moon JS, Lee SY, Nam CM, Choi JM, Choe BK, Seo JW, et al. 2007 Korean National Growth Charts: review of developmental process and an outlook. Korean J Pediatr 2008;51:1-25.
17. James PT. Obesity: the worldwide epidemic. Clin Dermatol 2004;22:276-80.
18. Svensson V, Jacobsson JA, Fredriksson R, Danielsson
P, Sobko T, Schiöth HB, et al. Associations between se- verity of obesity in childhood and adolescence, obesity onset and parental BMI: a longitudinal cohort study.
Int J Obes (Lond) 2011;35:46-52.
19. Li P, Tiwari HK, Lin WY, Allison DB, Chung WK, Leibel RL, et al. Genetic association analysis of 30 genes re- lated to obesity in a European American population. Int J Obes (Lond) 2014;38:724-9.
20. Herrera BM, Keildson S, Lindgren CM. Genetics and epigenetics of obesity. Maturitas 2011;69:41-9.
21. Halaas JL, Boozer C, Blair-West J, Fidahusein N, Denton DA, Friedman JM. Physiological response to long-term peripheral and central leptin infusion in lean and obese mice. Proc Natl Acad Sci U S A 1997;94:
8878-83.
22. Obici S, Feng Z, Karkanias G, Baskin DG, Rossetti L.
Decreasing hypothalamic insulin receptors causes hy- perphagia and insulin resistance in rats. Nat Neurosci 2002;5:566-72.
23. Nakazato M, Murakami N, Date Y, Kojima M, Matsuo H, Kangawa K, et al. A role for ghrelin in the central reg- ulation of feeding. Nature 2001;409:194-8.
24. Sung-Chan P, Sung YW, Zhao X, Brownson RC.
Family-based models for childhood-obesity inter- vention: a systematic review of randomized controlled trials. Obes Rev 2013;14:265-78.
25. Kral TV, Rauh EM. Eating behaviors of children in the context of their family environment. Physiol Behav 2010;100:567-73.
26. Linabery AM, Nahhas RW, Johnson W, Choh AC, Towne B, Odegaard AO, et al. Stronger influence of ma- ternal than paternal obesity on infant and early child- hood body mass index: the Fels longitudinal study.
Pediatr Obes 2013;8:159-69.
27. Oliveria SA, Ellison RC, Moore LL, Gillman MW,
Garrahie EJ, Singer MR. Parent-child relationships in nutrient intake: the Framingham children's study. Am J Clin Nutr 1992;56:593-8.
28. Greve J. New results on the effect of maternal work hours on children's overweight status: does the quality of child care matter? Labour Econ 2011;18:579-90.
29. Anderson PM, Butcher KF, Levine PB. Maternal em- ployment and overweight children. J Health Econ 2003;22:477-504.
30. Durmus B, Kruithof CJ, Gillman MH, Willemsen SP, Hofman A, Raat H, et al. Parental smoking during preg- nancy, early growth, and risk of obesity in preschool children: the generation R study. Am J Clin Nutr 2011;94:164-71.
31. von Kries R, Bolte G, Baghi L, Toschke AM; GME Study Group. Parental smoking and childhood obesity--is ma- ternal smoking in pregnancy the critical exposure? Int J Epidemiol 2008;37:210-6.
32. Sharma AJ, Cogswell ME, Li R. Dose-response associa- tions between maternal smoking during pregnancy and subsequent childhood obesity: effect modification by maternal race/ethnicity in a low-income US cohort. Am J Epidemiol 2008;168:995-1007.
33. Salois MJ. The built environment and obesity among low-income preschool children. Health Place 2012;18:
520-7.
34. Davis AM, Bennett KJ, Befort C, Nollen N. Obesity and related health behaviors among urban and rural chil- dren in the United States: data from the national health and nutrition examination survey 2003-2004 and 2005-2006. J Pediatr Psychol 2011;36:669-76.
35. Morandi A, Meyre D, Lobbens S, Kleinman K, Kaakinen M, Rifas-Shiman SL, et al. Estimation of newborn risk for child or adolescent obesity: lessons from longi- tudinal birth cohorts. PLoS One 2012;7:e49919.