Identification of Novel Methylation Markers in Hepatocellular Carcinoma using a Methylation Array
Promoter CpG island hypermethylation has become recognized as an important mechanism for inactivating tumor suppressor genes or tumor-related genes in human cancers of various tissues. Gene inactivation in association with promoter CpG island hypermethylation has been reported to be four times more frequent than genetic changes in human colorectal cancers. Hepatocellular carcinoma is also one of the human cancer types in which aberrant promoter CpG island hypermethylation is frequently found. However, the number of genes identified to date as hypermethylated for hepatocellular carcinoma (HCC) is fewer than that for colorectal cancer or gastric cancer, which can be attributed to fewer attempts to perform genome-wide methylation profiling for HCC. In the present study, we used bead-array technology and coupled methylation-specific PCR to identify new genes showing cancer-specific methylation in HCC. Twenty-four new genes have been identified as hypermethylated at their promoter CpG island loci in a cancer-specific manner. Of these, TNFRSF10C, HOXA9, NPY, and IRF5 were frequently hypermethylated in hepatocellular carcinoma tissue samples and their methylation was found to be closely associated with inactivation of gene expression. Further study will be required to elucidate the
clinicopathological implications of these newly found DNA methylation markers in hepatocellular carcinoma.
Key Words: Bead Array; CpG Islands; DNA Methylation; Carcinoma, Hepatocellular So Hyun Shin1, Baek-hui Kim2,
Ja-June Jang3, Kyung Suk Suh4, and Gyeong Hoon Kang1,3
Laboratory of Epigenetics1, Cancer Research Institute and Brain Korea 2nd Stage, Seoul National University, Seoul; Department of Pathology2, Korea University Medical School, Seoul; Departments of Pathology3, and Surgery4, Seoul National University College of Medicine, Seoul, Korea
Received: 9 November 2009 Accepted: 19 January 2010 Address for Correspondence:
Gyeong Hoon Kang, M.D.
Department of Pathology, Seoul National University College of Medicine, 101 Daehang-no, Jongno-gu, Seoul 110-744, Korea Tel: +82.2-2072-3312, Fax: +82.2-743-5530
E-mail: [email protected]
This study was supported by a grant of the Korea Healthcare Technology R&D Project, Ministry for Health, Welfare & Family Affairs, Republic of Korea (A090126).
DOI: 10.3346/jkms.2010.25.8.1152 • J Korean Med Sci 2010; 25: 1152-1159
INTRODUCTION
A CpG island is an approximately 1-kb DNA sequence with a high density of CpG dinucleotides. About 70% of human genes are known to harbor CpG islands in their promoter sequences (1, 2). In normal cells, promoter CpG islands are usually pro- tected from aberrant hypermethylation, except for those on im- printing genes or genes of inactivated X chromosomes (3, 4).
However, in association with carcinogenesis, hundreds of pro- moter CpG islands undergo aberrant hypermethylation, which represses gene transcription of active genes or enforces suppres- sion of already inactive genes (5). Promoter CpG island hyper- methylation has become recognized as an important mecha- nism for inactivation of tumor suppressor genes or tumor-relat- ed genes in human cancers, and occurs in virtually all types of human cancers (6). In addition to gene inactivation, promoter CpG island hypermethylation has received attention for its poten- tial utility as a biomarker for tumor detection or prediction of prognosis or response of tumor cells to chemotherapeutic agents (7). Hepatocellular carcinoma (HCC) is one of the human cancers in which researchers are actively studying epigenetic changes.
More than 113 genes have been found to be hypermethylated in HCC in a cancer-specific manner and some of them have been
demonstrated to have a close association between hypermeth- ylation and poor prognosis for HCC patients, supporting the po- tential usefulness of DNA methylation markers as prognostic markers (8-10).
However, the number of genes that have been identified to date as harboring hypermethylation in their promoter CpG is- land loci is far fewer for HCC than for colon cancer or gastric cancer, which can be attributed to fewer attempts to perform genome-wide methylation analysis compared with colon can- cer or gastric cancer. Considering that about 400 genes may be inactivated through promoter CpG island hypermethylation in colorectal cancers (11), there remain many genes that may be hypermethylated in HCC.
Among the various technologies available for large-scale anal- ysis of DNA methylation, the GoldenGate methylation solution is a powerful and accurate screening tool for analyzing methyl- ation status in 807 genes (12). With the advent of this technique, we were able to analyze the methylation status of 687 promoter CpG island loci in liver cancer. The aim of the present study was to identify additional genes that are hypermethylated in HCC in a cancer-specific manner that have not yet been reported as such in the literature thus far.
MATERIALS AND METHODS Cell lines and 5-aza-dC treatment
We used eight different human HCC cell lines (SNU398, SNU475, SNU739, SNU761, SNU878, SNU886, HepG2, and Huh7) ob- tained from the Korean Cell Line Bank (Seoul, Korea). All of the cell lines except Huh7 were grown in RPMI-1640 medium sup- plemented with 10% fetal bovine serum. Huh7 was grown in DMEM medium supplemented with 10% fetal bovine serum.
All cell lines were cultured in a humidified 37°C, 5% CO2 incu- bator. The cell lines were seeded at 3×10⁵/mL in their respective culture media and treated with 1 µM and 5 µM 5-aza-dC (Sigma Chemical Co., St. Louis, MO, USA) for 96 hr; media and drugs were replaced every 24 hr. As a control, cell lines were mock-treat- ed in parallel with the addition of an equal volume of PBS with- out the drug. We prepared total RNA using the RNeasy Mini kit (Qiagen, Valencia, CA, USA).
Tissue samples
Fresh-frozen samples of HCC and paired non-neoplastic liver tissues were obtained from patients (n=5) who underwent cu- rative resection for HCC at the Seoul National University Hospi- tal in 2008. In addition, after microscopic examination of HCC samples from patients who underwent curative resection at the Seoul National University Hospital from 2001 to 2002, we select- ed 50 cases of HCC that had sufficient amounts of archival neo- plastic and non-neoplastic tissues for the DNA methylation study. For the bead array study requiring fresh tissue samples, we obtained informed consent from the patients. The Institu- tional Review Board approved this study.
Methylation microarray
DNA methylation analysis of individual genes was performed using GoldenGate Methylation Solution utilizing the current Cancer Panel I platform (Illumina, San Diego, CA, USA), which probes 1,505 CpG loci selected from 807 genes. Using this meth- od, oligonucleotide primers query putative methylation sites in Table 1. Primers for methylation-specific polymerase chain reaction
Gene Forward primer Reverse primer Tm (°C) Product (bp)
ADAMTS12 TTTATTTTATATTTCGTCGAAAGCG ACGACTACAAAACTACCCGCG 61 135
ADCYAP1 GGTTTGGTTAGTTATTGGGCGTC CCCTAAATTAAACAACACTTAACGACAACCG 59 118
CTSL TTTGGGATAGTTAGTAAATAAGTTACGAATCGC AACTCTACTTCTAAAACCTCGAATCTAAATTCG 57 150
DST TTTTTTAGTAGGGGGTTGCGTATAGC CCGAATCCCCAAAAACGACG 59 103
F2R TTTTTATATTTTAGGAGGGTCGAGAC TTCCTCTAAACACCGTTAATTCG 60 124
FGF3 GGAGTTTTTTTGTCGTCGTTTTTCGC CGCCGCCGATAACTAATATCCG 59 116
FLT3 GGAGTTTCGGGGGTCGTC CCCCAAAAACAAAAACCGAAACGAAAACG 59 134
FLT4 CGTATTGTTCGGGTGTATCGGAC AAACGAAAACCGAAAACGAACCCG 59 105
FZD9 CGGGCGGATATTTATTAGGTTCGGTTTTATTTC CCCCCGAAACGAAACTCCG 60 123
GP1BB TAGCGGGTGTTCGAGTGTTTC CTAACCAAAAATAACCCAAAAACCGCG 59 138
HIC2 GTTTGGGTTTTCGGTTTTTTTCGC CGAAACCTACGAAAACGAAACCG 59 115
HOXA9 CGGGCGTTTTTCGTTTTAGGC AAATCCGTCCCAAACGAAACCG 60 122
HS3ST2 GGGAGCGTTCGAGTCGTTC CACAATACCAAAAAATCCCGAAAACAACG 59 117
ICA1 GTCGTTGCGTTGCGTTGC ACGTCAACGTCAACCGAAAACG 59 130
IGF2AS CGGTTGCGTCGGGTC TAAACGCACCCCGATAAACTCG 59 131
IHH TTATTCGGACGTTTGAGTTTTCGTAGC GAACGAAAAACATAACCGAAAAACCCG 59 111
IRAK3 CGTGTTTTTAGGGTTTTGTTGTCGTC CGAACCCCGAAAACGAAACG 59 108
IRF5 AATTGAGTATTGTAGCGGGAGGTAC CTCCAAAAAAATACCAAACGACG 61 116
MCM2 TTTGAGTTTGTGATTCGTTTATTTC CCGACGACACTTACTAACTACGTA 58 139
MLF1 TTGTTAGGGTAGCGGCGTATTGTTTTTC AAACGATACCCGCCGAAATAAAAAATACG 60 113
NGFR TAGTTAGAGCGAGTCGAGTCGC CTCGACTTCCAACTCGATCCG 60 109
NOTCH3 GGTAGGGATTTCGGGAGGTC GCCAACTTCGCCGAAATAAAACG 59 120
NPY AAAGAAGGAAAGTAGGGATCGGGTATTGTTC CTAAAACCGCGTAAACGAAACAACG 59 120
PDGFRB TTATATTTTGAGCGAACGGGC AAACAAAAAAAATAAACGCGTACGT 62 139
PGF CGGGTTGATCGGGCGTTTC GCGCCTAAATTTCAAAAACTAAACCGAAACG 61 103
PLAGL1 GCGGCGATGATAAGAGTTTCGC GACCCCAACCGACCCG 61 107
PTCH2 GTAGTTGTTATTTCGAGTTTTGTTGTGCGTTTC CGCTCCGTAAACCGTAAACCG 59 134
RBP1 GATTTTTTCGTAGGTTTTGTGCG ACCGATACTACGCGAATAATAAACG 59 114
SH3BP2 TTTCGGGATTCGGGTCGC CCCCCAAAAAACGCGTAAACG 60 108
TAL1 ATTTGGTTGAGGAGGTAATCGC CCGACAAACTATCTAAAACATTTTCG 62 108
TESK2 GTAGGCGTTTTAGTTTTTCGCGGTTC TACCATAACCCCACAATCGAAACCG 62 134
TIAM1 TTTTTTACGGGTTTTCGCGGTTC GACGCTACTCTACCGACCG 59 110
TNFRSF10C TAAGGGGTGAAGGAGCGTTTTTTATC ACGCCGTCCTAAATCCTAAATCG 59 104
WNT2 TTAGGCGTAGTATTTTTTTTTTCGGTTGCGTTC CCAATTCCCCAAACGCAACG 59 115
ZP3 GGGTTCGTCGTTTTCGTAGTGTAC TCAACTAAACTACGAAACGACCATAACCG 59 106
bisulfite-converted genomic DNA. Bisulfite modification of ge- nomic DNA was performed using the EZ DNA methylation kit (Zymo Research, Orange, CA, USA). Similar to methylation-spe- cific PCR, two primer sets are designed for each CpG target; one primer set corresponds to the unmethylated, bisulfite-convert- ed sequence (uracil) while the other corresponds to the uncon- verted sequence (5-methyl cytosine). The methylation level (beta value) is determined by the ratio of the fluorescent signals from methylated and unmethylated alleles. The beta value identifies the level of DNA methylation at a CpG site, ranging from 0 in the case of almost all unmethylated sites to 1 for completely meth- ylated sites (12). Of 1,505 CpG sites (selected from 807 genes) included in GoldenGate Methylation Cancer Panel I, 1,044 of the CpG sites are located within CpG islands, and 461 are locat- ed outside of CpG islands. Comparing the average beta values for the 1,044 CpG sites between HCC and non-neoplastic liver tissues, cancer-specific hypermethylation was determined to be present when the average beta value for a CpG site was sig- nificantly greater (P<0.05) for the HCC samples (n=5) than for the non-neoplastic liver tissues (n=5).
Methylation-specific polymerase (MSP) chain reaction For MSP analysis, DNA was extracted following a standard phe- nol-chloroform extraction method. Bisulfite modification of ge- nomic DNA was carried out using the EZ DNA methylation Kit (Zymo Research). Primers were designed using two web sites, MSPPrimer (http://www.mspprimer.org) and MethPrimer (http:
//www.urogene.org/methprimer). Primer sequences and PCR conditions are shown in Table 1. MSP was performed as previ- ously described (13).
Quantitative RT-PCR
Total RNA was prepared using the RNeasy (Qiagen) kit accord- ing to the manufacturer’s protocols. A total of 5 μg of RNA was reverse transcribed using Oligo dT and Superscript III (Invitro- gen, Carlsbad, CA, USA). Quantitative RT-PCR amplification reactions were performed using the SYBR® Green PCR Master Mix (Applied Biosystems, Foster City, CA, USA) with a 7300 Re- al-Time PCR System (Applied Biosystems). The expression lev- els of the genes were normalized to the expression of GAPDH.
Primer sequences and PCR conditions are shown in Table 2.
RESULTS
Microarray analysis of methylated genes
The methylation profiles of five pairs of HCC and non-neoplas- tic liver tissues were analyzed for 807 genes using the Illumina GoldenGate Methylation Solution. In total, 72 annotated genes (81 CpG sites) were found to be hypermethylated in tumor tis- sues. After excluding genes without a CpG island in the promoter (18 genes), imprinted genes (2 genes), and genes for which meth- ylation of their promoter CpG island loci has already been report- ed for HCC (17 genes), we explored DNA hypermethylation for the remaining 36 genes using MSP. These 36 genes were consid- Table 2. Primers for quantitative RT-PCR
Gene Forward primer Reverse primer Tm (°C) Product (bp)
ADAMTS12 TGCAATTCACATTGTTGTGG GTGAGGCTGACACATTCCTG 59 253
ADCYAP1 GATCTTCACGGACAGCTA AG GTTTGGATAGAACACACGAGC 60 226
DST AGCAAAGGACGCATACTGAC ATTTGGCTCTACTCCTGAAC 56 270
FGF3 TTGGAGATAACGGCAGTGGA CTCCAGGTTATCCGGGCTCT 56 448
FLT3 GAGGACTTGAATGTGCTTACA TCCCACAGTAATATTCCATATGA 55 308
FZD9 TGCCCCTCTCTGGCTACCTG GGGCACCGTGTAGAGGATGG 62 164
GAPDH CAATGACCCCTTCATTGACC TGGAAGATGGTGATGGGATT 55 135
GP1BB CCTGCAAACTCGACAGGAC CAGAGTTTGGAAGGGAGACG 59 231
HIC2 TGCGAGAAGACCTACAAGGA AGCTGGCACTCGTAAGGTTT 59 251
HOXA9 GCGCCTTCTCTGAAAACAAT CCAGATCTTGACCTGCCTCT 60 242
HS3ST2 GGATTCCCTTGCTTGAAAAA TGCAACTCAAGTTGGGAAAG 59 302
IRAK3 TTTGAATGCAGCCAGTCTGA GCATTGCTTATGGAGCCAAT 59 365
IRF5 CAGGGAGCTTCTCTCTGAGG AAGAGTTCCACCTGCTCCTG 68 237
MLF1 GGTTTTTCAGGCCTCAACTC AAACCTCACTTTGCCACTCC 64 245
NOTCH3 TGTGGACGAGTGCTCTATCG AATGTCCACCTCGCAATAGG 60 238
NPY AACCTCATCACCAGGCAGAG CTGCATGCATTGGTAGGATG 60 220
PDGFRB GGGCTAGACACGGGAGAATA GATCATAGGGGACAGGCAGT 59 250
PTCH2 GTGGCAAAGTGCTCTTTCTG TCCCAGGACTTCCCATAGAG 55 301
RBP1 GTTGGGAAGGAGTTTGAGGA GCTCACACATCCTGCTGATT 59 258
SH3BP2 ATCCACATCAGCAAGAAGCA GAGTCATCCTCATCGTCGTG 68 251
TAL1 AAGAGGAGACCTTCCCCCTA CCTCCTCCTCCTGGTCATT 66 247
TIAM1 AAGACGTACTCAGGCCATGTCC GACCCAAATGTCGCAGTCAG 61 252
TNFRSF10C GATTACACCAACGCTTCCAA TTGGCACCAAATTCTTCAAC 59 248
WNT2 CAGACGCAAGGGGGTTAATA CACATCTGGATGTCGGTGAC 61 202
ZP3 CAGAATGCCTCCCCTTATCA ATCTGGGTCCTGCTCAGCTA 60 210
ered to be potential novel methylation markers for HCC. This gene filtering approach is depicted in Fig. 1.
Validation of the methylation status of candidate genes in the HCC cell lines using MSP
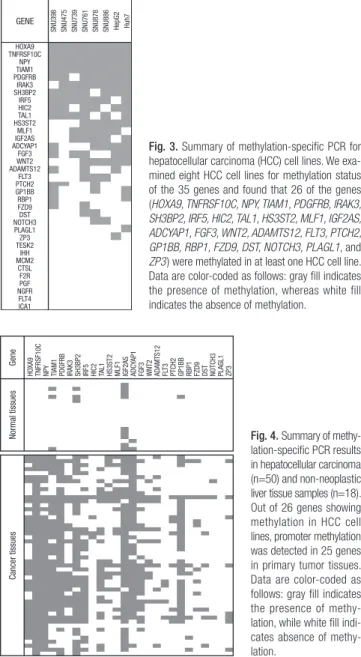
For MSP analysis, we attempted to design primers for the 36 genes using both MSPPrimer (http://www.mspprimer.org) and Meth- Primer (http://www.urogene.org/methprimer). However, for one gene (HOXB2), neither tool was able to design primers, be- cause it has a short CpG island in the promoter. Therefore, we examined the methylation status of the remaining 35 genes in the 8 HCC cell lines. It was found that 26 of the genes (HOXA9, TNFRSF10C, NPY, TIAM1, PDGFRB, IRAK3, SH3BP2, IRF5, HIC2, TAL1, HS3ST2, MLF1, IGF2AS, ADCYAP1, FGF3, WNT2, ADAMTS12, FLT3, PTCH2, GP1BB, RBP1, FZD9, DST, NOTCH3, PLAGL1, and ZP3) were methylated in at least one HCC cell line
(26 of 35; 74.3%). The remaining 9 genes (TESK2, IHH, MCM2, CTSL, F2R, PGF, NGFR, FLT4, and ICA1) were not found to be methylated in the HCC cell lines using the MSP assay (Figs. 2, 3).
Confirmation of hypermethylation of newly developed candidate genes in liver tissues
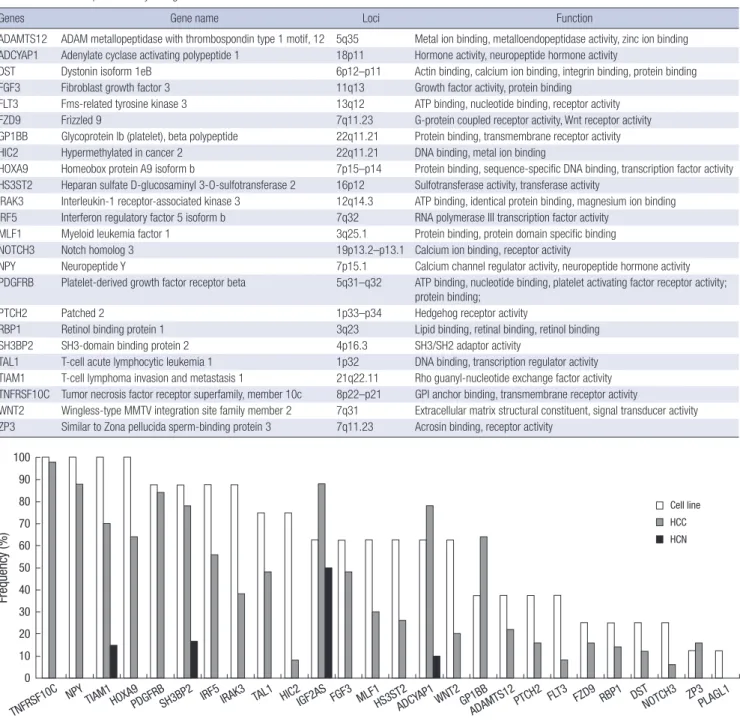
To determine whether the genes that were hypermethylated in the HCC cell lines were hypermethylated in a cancer-specific manner, we analyzed the methylation status of the 26 genes in 18 normal liver samples and 50 primary HCC samples using methylation-specific PCR. Of the candidate 26 genes that showed methylation in the cell lines, promoter methylation was detect- ed in 25 of the genes in primary tumor tissues. In contrast, only five genes (5 of 26; 19.2%) were methylated in normal tissues.
Moreover, all but one of these genes (IGF2AS) were methylated at low frequencies in the non-neoplastic liver tissues (Fig. 4).
807
72
55
53
36 a
Identification of Methylated Genes in Hepatocellular Carcinoma by Methylation array
a. Select genes that tumor tissue showing significantly greater methylation level than normal tissue
b. Exclude genes with no CpG island in the promoter
c. Exclude imprinted genes
b. Exclude genes of which methylation analysis was already reported in hepatocellular carcinoma
b
c
d
Fig. 1. Flow chart for selection of candidate methylation markers. We used 5 paired hepatocellular carcinoma/normal tissues to screen for candidate methylation markers using a methylation array. We obtained 72 candidates that showed significant hyper- methylation in hepatocellular carcinoma tissues. We removed genes with no CpG island loci in their promoters, imprinted genes, and genes for which methylation status was already known for hepatocellular carcinoma. Thus, we selected 36 genes to further examine for methylation analysis using methylation-specific PCR.
Fig. 2. Representative examples of MSP analysis of DST, FLT3, PTCH2 and TIAM1 in 8 HCC cell lines. DNA extracted from 8 HCC cell lines were amplified with primers specific to the methylated (M) or unmethylated (UM) CpG islands of each gene after modification with sodium bisulfite. +, positive control; DW, distilled water. Positive controls for methylated MSP and unmethylated DNA are M.SssI-treated placental DNA and whole-genome amplified DNA, respectively.
DST
FLT3
PTCH2
TIAM1 M
SNU398 SNU475
SNU739 SNU761
SNU878 SNU886
HepG2
Huh7 + DW
M
M
M UM
UM
UM
UM
SNU398 SNU475 SNU739 SNU761 SNU878 SNU886 HepG2 Huh7 GENE
HOXA9 TNFRSF10C
TIAM1NPY PDGFRB
IRAK3 SH3BP2
HIC2IRF5 HS3ST2TAL1 IGF2ASMLF1 ADCYAP1
WNT2 FGF3 ADAMTS12
PTCH2FLT3 GP1BB RBP1FZD9 NOTCH3DST PLAGL1 TESK2ZP3 MCM2IHH CTSLF2R NGFRPGF FLT4ICA1
Fig. 3. Summary of methylation-specific PCR for hepatocellular carcinoma (HCC) cell lines. We exa- mined eight HCC cell lines for methylation status of the 35 genes and found that 26 of the genes (HOXA9, TNFRSF10C, NPY, TIAM1, PDGFRB, IRAK3, SH3BP2, IRF5, HIC2, TAL1, HS3ST2, MLF1, IGF2AS, ADCYAP1, FGF3, WNT2, ADAMTS12, FLT3, PTCH2, GP1BB, RBP1, FZD9, DST, NOTCH3, PLAGL1, and ZP3) were methylated in at least one HCC cell line.
Data are color-coded as follows: gray fill indicates the presence of methylation, whereas white fill indicates the absence of methylation.
Fig. 4. Summary of methy- lation-specific PCR results in hepatocellular carcinoma (n=50) and non-neoplastic liver tissue samples (n=18).
Out of 26 genes showing methylation in HCC cell lines, promoter methylation was detected in 25 genes in primary tumor tissues.
Data are color-coded as follows: gray fill indicates the presence of methy- lation, while white fill indi- cates absence of methy- lation.
GeneNormal tissuesCancer tissues HOXA9 TNFRSF10C NPY TIAM1 PDGFRB IRAK3 SH3BP2 IRF5 HIC2 TAL1 HS3ST2 MLF1 IGF2AS ADCYAP1 FGF3 WNT2 ADAMTS12 FLT3 PTCH2 GP1BB RBP1 FZD9 DST NOTCH3 PLAGL1 ZP3
Thus, the vast majority of the genes were found to show cancer- specific methylation at frequencies of 6%–98% (Fig. 5). Thus, 24 new cancer-specific CpG island loci were identified through our approach (Table 3).
Gene expression and induction after 5-aza-dC treatment in HCC cell lines
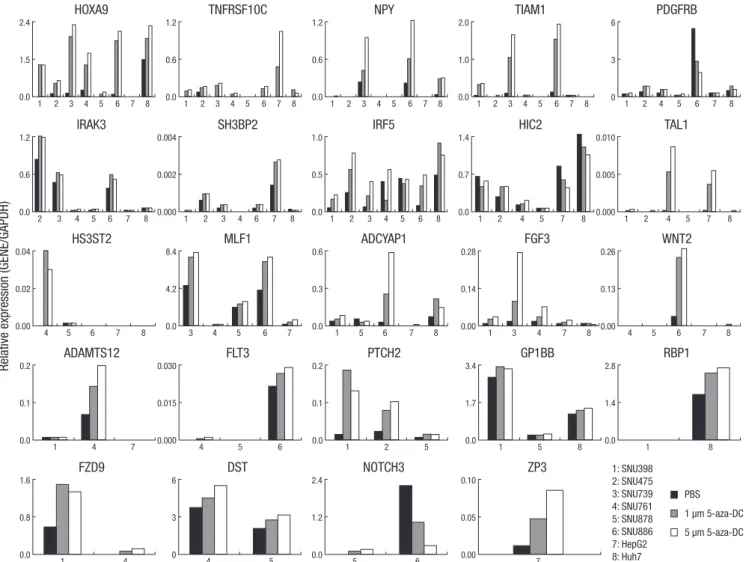
For hypermethylated and transcriptionally silenced genes, the DNA demethylating agent 5-aza-dC is known to induce gene re-expression (14, 15). To identify whether promoter CpG island hypermethylation was closely associated with gene expression
in the 24 newly identified cancer-specific methylated genes, we treated the 8 HCC cell lines with 5-aza-dC (1 and 5 µM for 96 hr) and performed quantitative RT-PCR of the mock-treated and 5-aza-dC treated cell lines. TNFRSF10C, NPY, TIAM1, and HOXA9 were methylated in all cell lines and showed up-regulation of mRNA expression in all cell lines with 5-aza-dC, although TIAM1 was not re-expressed in two cell lines, SNU-878 and Huh7. Most of the methylated genes exhibited re-expression after 5-aza-dC treatment; in contrast, SNU-886 in PDGFRB; SNU-878 in IRF5;
SNU-398, HepG2, and Huh7 in HIC2; HepG2 and Huh7 in HS3ST2; SNU-878 in ADCYAP1; and SNU-886 in NOTCH3 were Table 3. New cancer-specific methylated genes
Genes Gene name Loci Function
ADAMTS12 ADAM metallopeptidase with thrombospondin type 1 motif, 12 5q35 Metal ion binding, metalloendopeptidase activity, zinc ion binding ADCYAP1 Adenylate cyclase activating polypeptide 1 18p11 Hormone activity, neuropeptide hormone activity
DST Dystonin isoform 1eB 6p12–p11 Actin binding, calcium ion binding, integrin binding, protein binding FGF3 Fibroblast growth factor 3 11q13 Growth factor activity, protein binding
FLT3 Fms-related tyrosine kinase 3 13q12 ATP binding, nucleotide binding, receptor activity
FZD9 Frizzled 9 7q11.23 G-protein coupled receptor activity, Wnt receptor activity
GP1BB Glycoprotein Ib (platelet), beta polypeptide 22q11.21 Protein binding, transmembrane receptor activity
HIC2 Hypermethylated in cancer 2 22q11.21 DNA binding, metal ion binding
HOXA9 Homeobox protein A9 isoform b 7p15–p14 Protein binding, sequence-specific DNA binding, transcription factor activity HS3ST2 Heparan sulfate D-glucosaminyl 3-O-sulfotransferase 2 16p12 Sulfotransferase activity, transferase activity
IRAK3 Interleukin-1 receptor-associated kinase 3 12q14.3 ATP binding, identical protein binding, magnesium ion binding IRF5 Interferon regulatory factor 5 isoform b 7q32 RNA polymerase III transcription factor activity
MLF1 Myeloid leukemia factor 1 3q25.1 Protein binding, protein domain specific binding NOTCH3 Notch homolog 3 19p13.2–p13.1 Calcium ion binding, receptor activity
NPY Neuropeptide Y 7p15.1 Calcium channel regulator activity, neuropeptide hormone activity PDGFRB Platelet-derived growth factor receptor beta 5q31–q32 ATP binding, nucleotide binding, platelet activating factor receptor activity;
protein binding;
PTCH2 Patched 2 1p33–p34 Hedgehog receptor activity
RBP1 Retinol binding protein 1 3q23 Lipid binding, retinal binding, retinol binding
SH3BP2 SH3-domain binding protein 2 4p16.3 SH3/SH2 adaptor activity
TAL1 T-cell acute lymphocytic leukemia 1 1p32 DNA binding, transcription regulator activity TIAM1 T-cell lymphoma invasion and metastasis 1 21q22.11 Rho guanyl-nucleotide exchange factor activity TNFRSF10C Tumor necrosis factor receptor superfamily, member 10c 8p22–p21 GPI anchor binding, transmembrane receptor activity
WNT2 Wingless-type MMTV integration site family member 2 7q31 Extracellular matrix structural constituent, signal transducer activity ZP3 Similar to Zona pellucida sperm-binding protein 3 7q11.23 Acrosin binding, receptor activity
Frequency (%)
TNFRSF10C TIAM1
SH3BP2 TAL1
MLF1
GP1BB FZD9
NOTCH3
NPY PDGFRB IRAK3 FGF3
WNT2 FLT3 DST
HOXA9 IRF5
IGF2AS
ADCYAP1
PTCH2 HIC2
HS3ST2
ADAMTS12 RBP1 ZP3
PLAGL1 100
90 80 70 60 50 40 30 20 10 0
Cell line HCC HCN
Fig. 5. Comparison of hypermethylation frequencies for 26 genes. Hepatocellular carcinoma (HCC) cell lines (white column), HCC tissue samples (gray column), and non- neoplastic liver tissue samples (HCN, black column).
down-regulated by 5-aza-dC. In addition, HepG2 and SNU-761 in WNT2, HepG2 in ADAMTS12, and SNU-878 in FLT3 were not re-expressed (Fig. 6). In such cases, histone modification may be related to transcription suppression (16, 17).
DISCUSSION
Although many studies have reported aberrant hypermethylation of genes in HCC, for example, identifying E-cadherin, RASSF1A, GSTP, SOCS1, SFRP1, and PTEN as tumor suppressor gene si- lenced by hypermethylation, most of these studies were limited to analysis of a single or a few specific genes (8-10). Therefore, the true extent of promoter CpG island hypermethylation in HCC remains largely unknown. With advancements in microarray technology, the number of genes found to be hypermethylated in HCC in a cancer-specific manner is expected to increase ex-
ponentially, leading to a better understanding of epigenetic modulation of tumor-related genes in hepatocarcinogenesis.
The GoldenGate bead-array technology incorporates a strong analytical methylation platform and provides reliable and high- ly reproducible data (12). Here, we present identification of new genes demonstrating cancer-specific methylation in HCC through the use of bead-array technology. The fidelity of the bead-array results was confirmed using methylation-specific PCR for genes selected according to our criteria (Fig. 1). As a result of the pres- ent approach, 24 genes were newly identified as cancer-specific methylation loci for HCC.
Table 3 summarizes the functions of the genes that were new- ly identified to be hypermethylated in a cancer-specific manner in HCC. TNFRSF10C, HOXA9, NPY, and IRF5 were frequently methylated in our panel of cell lines and HCC tissues and their methylation was correlated with low expression levels or silenc- IRAK3
TNFRSF10C
SH3BP2 IRF5
NPY TIAM1
HIC2 TAL1
HS3ST2
ADAMTS12 FLT3 PTCH2 GP1BB RBP1
FZD9 DST NOTCH3 ZP3
MLF1 ADCYAP1 FGF3 WNT2
PDGFRB HOXA9
PBS 1 µm 5-aza-DC 5 µm 5-aza-DC
Fig. 6. Analysis of mRNA expression of candidate genes in hepatocellular carcinoma cell lines by quantitative RT-PCR. Cells were either mock-treated (PBS) or treated with 5-aza-dC (1AZA [1 μM] or 5AZA [5 μM] for 96 hr) as indicated. The expression patterns and re-expression patterns for each gene after 5-aza-dC treatment are shown for the cell lines that were methylated. Numbers along the horizontal axis indicate the cell lines. Gene expression levels were determined by quantitative RT-PCR and normalized to GAPDH levels.
Relative expression (GENE/GAPDH)
1: SNU398 2: SNU475 3: SNU739 4: SNU761 5: SNU878 6: SNU886 7: HepG2 8: Huh7 1 2 3 4 5 6 7 8
2 3 4 5 6 7 8 1 2 3 4 6 7 8 1 2 3 4 5 6 8
1 2 3 4 5 6 7 8 1 2 3 4 5 6 7 8 1 2 3 4 5 6 7 8
1 2 4 5 7 8 1 2 4 5 7 8
4 5 6 7 8
1 4 7 4 5 6 1 2 5 1 5 8 1 8
1 4 4 5 5 6 7
3 4 5 6 7 1 5 6 7 8 1 3 4 7 8 4 5 6 7 8
1 2 4 5 6 7 8 2.4
1.5
0.0
1.2
0.6
0.0
0.004
0.002
0.000
1.0
0.5
0.0 1.2
0.6
0.0
1.2
0.6
0.0
2.0
1.0
0.0
1.4
0.7
0.0
0.010
0.005
0.000
0.04
0.02
0.00
0.2
0.1
0.0
0.030
0.015
0.000
0.2
0.1
0.0
3.4
1.7
0.0
2.8
1.4
0.0
1.6
0.8
0.0
6
3
0
2.4
1.2
0.0
0.10
0.05
0.00 8.4
4.2
0.0
0.6
0.3
0.0
0.28
0.14
0.00
0.26
0.13
0.00 6
3
0
ing. These genes were re-expressed in the majority of the cell lines after 5-aza-dC treatment. Therefore, these genes are con- sidered to be repressed by DNA hypermethylation in their pro- moter CpG islands. Although it is unclear whether TNFRSF10C plays a pro-apoptotic role or an anti-apoptotic role in tumors, hypermethylation of TNFRSF10C has been reported in various human cancers, including breast, lung, prostate, and neuroblas- tomas (18). HOXA9 encodes a DNA-binding transcription fac- tor that may regulate gene expression, morphogenesis, and dif- ferentiation. Expression of HOXA9 proteins is spatially and tem- porally regulated during embryonic development (19). HOXA9 promoter CpG island methylation has been reported in ovary and lung cancer (20, 21). NPY is involved in cell motion and cell proliferation as well as neuropeptide hormone activity (22, 23).
In prostate cancer, low NPY expression is closely associated with aggressive clinical behavior (24). In another recent study, NPY was shown to be frequently methylated in neuroblastomas (25).
IRF5, a member of the interferon regulatory factor family, is known to be related to innate immune system activity and is also a crit- ical regulator of DNA damage-induced apoptosis (26). Because IRF5 is critical for induction of apoptosis, IRF5 deficiency pre- disposes cells to tumorigenic transformation (27). However, methylation of IRF5 in cancer has rarely been reported.
Recently, the role of chromatin structure and epigenetic alter- ations in controlling gene transcriptional activity during embry- onic stem (ES) cell self-renewal and differentiation has been in- tensively investigated (28, 29). Recent studies have attempted to identify the relationships between DNA methylation, histone modifications, and promoter occupancy of pluripotent regula- tors such as PcG in regulation gene expression in ES cells (30).
Gene promoter chromatin patterns, including PcG-mediated repressive histone modifications, may render certain genes vul- nerable to DNA hypermethylation. These changes may enhance the likelihood of tumor initiation and progression from cell trans- formation (30). To identify whether polycomb repressive com- plex 2 (PRC2) occupancy information obtained from embryonic stem cells may predict the vulnerability of individual CpG island loci to hypermethylation, we compared the average methylation level (beta value) of each CpG island locus between normal tis-
sues and tumor tissues and correlated it with PRC2 occupancy.
In PRC2-positive CpG islands, the methylation level of the tumor group was higher than the methylation level of the normal group.
In addition, the differences between the two groups were larger when the CpG island loci were occupied by two or more com- ponents of the PRC2 complex. However, there were no differ- ences among PRC2-negative CpG islands (Supplementary Table 1). Thus, PRC2 may indicate that these genes are preferred sub- strates for targeted methylation.
In addition to hypermethylation of promoter CpG island loci, some hypomethylated CpG sites were also identified through comparison of methylation levels (bead array-determined beta values) of CpG sites in HCC. CpG sites showing hypomethyl- ation in a cancer-related manner appear to be different from those that were hypermethylated with respect to their relation- ships with CpG island loci. In the present study, we found that 69 genes (83 CpG sites) were significantly hypomethylated in tumor tissues. Of these 83 CpG sites, only 23 sites (27.7%) were located in promoter CpG island loci, in contrast with the 63 of 81 (77.8%) hypermethylated CpG sites that were located in CpG island loci (Supplementary Table 2). The identified hypometh- ylated genes tend to be involved in biological processes of im- munity, neuronal activity, lipid metabolism, and transport, where- as the hypermethylated genes tend to be involved in nucleic acid metabolism, cell proliferation, differentiation, and the cell cycle. For example, IL16, involved in chemokine-mediated im- munity, was significantly hypomethylated in HCC compared to non-neoplastic liver tissues (P=0.003). GABRA5, with neurotrans- mitter receptor activity, was hypomethylated (P<0.001). APOC1, which processes lipid metabolism and transport, was hypometh- ylated (P=0.001). In addition, certain oncogenes, including HGF, BLK, and PGR were hypomethylated in HCC. Interestingly, hy- pomethylation of histone deacetylase 1 (HDAC1), which plays a key role in the regulation of eukaryotic gene repression, was prominent and had the largest significant difference in methyl- ation levels between HCC and non-neoplastic liver tissues (P<
0.001).
Supplementary Table 1. The average methylation level (beta value) of each CpG island locus between non-neoplastic tissues and HCC and correlated it with polycomb repressive complex 2 (PRC2) occupancy. The value of PRC2 occupancy represents the number of occupied components of PRC2 in the gene promoter
The number of genes
Beta value (mean) Non-neoplastic
liver HCC
PRC2 occupancy=0 407 0.326 0.348
PRC2 occupancy=>1 132 0.244 0.315
PRC2 occupancy=1 41 0.245 0.277
PRC2 occupancy=2 34 0.231 0.319
PRC2 occupancy=3 57 0.253 0.339
Supplementary Table 2. The summarization of the number of CpG sites undergoing hypermethylation or hypomethylation in association with cancerization according to their genomic location. CpG sites located in CpG island loci tend to undergo hyperme- thylation in association with cancerization whereas CpG sites located in non-CpG island tend to become hypomethylated
Hypermethylation Hypomethylation Promoter
CpG island
Non-CpG island 39
15 19
38 First exon
CpG island Non-CpG island
17 3
4 17 Second or distal exon or intron
CpG island Non-CpG island
7 0
0 5
Total CpG sites 81 (72 genes) 83 (69 genes)
In summary, we have identified 24 novel cancer-specific meth- ylation markers for HCC using array-based methylation profil- ing and coupled MSP. Of these, TNFRSF10C, HOXA9, NPY, and IRF5 were frequently hypermethylated in HCC tissues and their promoter hypermethylation was correlated with inactivation of gene expression in cell lines. The clinicopathologic implications of these newly identified DNA methylation markers will need to be further investigated in large-scale studies of HCC samples.
REFERENCES
1. Saxonov S, Berg P, Brutlag DL. A genome-wide analysis of CpG dinucle- otides in the human genome distinguishes two distinct classes of promot- ers. Proc Natl Acad Sci USA 2006; 103: 1412-7.
2. Weber M, Hellmann I, Stadler MB, Ramos L, Paabo S, Rebhan M, Schübeler D. Distribution, silencing potential and evolutionary impact of promoter DNA methylation in the human genome. Nat Genet 2007;
39: 457-66.
3. Li E, Beard C, Jaenisch R. Role for DNA methylation in genomic im- printing. Nature 1993; 366: 362-5.
4. Panning B, Jaenisch R. RNA and the epigenetic regulation of X chromo- some inactivation. Cell 1998; 93: 305-8.
5. Esteller M. Epigenetic gene silencing in cancer: the DNA hypermethy- lome. Hum Mol Genet 2007; 16 Spec No 1: R50-9.
6. Baylin SB, Chen WY. Aberrant gene silencing in tumor progression: im- plications for control of cancer. Cold Spring Harb Symp Quant Biol 2005;
70: 427-33.
7. Teodoridis JM, Strathdee G, Brown R. Epigenetic silencing mediated by CpG island methylation: potential as a therapeutic target and as a bio- marker. Drug Resist Updat 2004; 7: 267-78.
8. Calvisi DF, Ladu S, Gorden A, Farina M, Lee JS, Conner EA, Schroeder I, Factor VM, Thorgeirsson SS. Mechanistic and prognostic significance of aberrant methylation in the molecular pathogenesis of human hepato- cellular carcinoma. J Clin Invest 2007; 117: 2713-22.
9. Tischoff I, Tannapfe A. DNA methylation in hepatocellular carcinoma.
World J Gastroenterol 2008; 14: 1741-8.
10. Lou C, Yang B, Gao YT, Wang YJ, Nie FH, Yuan Q, Zhang CL, Du Z. Ab- errant methylation of multiple genes and its clinical implication in he- patocellular carcinoma. Zhonghua Zhong Liu Za Zhi 2008; 30: 831-6.
11. Schuebel KE, Chen W, Cope L, Glockner SC, Suzuki H, Yi JM, Chan TA, Van Neste L, Van Criekinge W, van den Bosch S, van Engeland M, Ting AH, Jair K, Yu W, Toyota M, Imai K, Ahuja N, Herman JG, Baylin SB.
Comparing the DNA hypermethylome with gene mutations in human colorectal cancer. PLoS Genet 2007; 3: 1709-23.
12. Bibikova M, Lin Z, Zhou L, Chudin E, Garcia EW, Wu B, Doucet D, Thomas NJ, Wang Y, Vollmer E, Goldmann T, Seifart C, Jiang W, Barker DL, Chee MS, Floros J, Fan JB. High-throughput DNA methylation pro- filing using universal bead arrays. Genome Res 2006; 16: 383-93.
13. Cho NY, Kim BH, Choi M, Yoo EJ, Moon KC, Cho YM, Kim D, Kang GH.
Hypermethylation of CpG island loci and hypomethylation of LINE-1 and Alu repeats in prostate adenocarcinoma and their relationship to clinicopathological features. J Pathol 2007; 211: 269-77.
14. Christman JK. 5-Azacytidine and 5-aza-2’-deoxycytidine as inhibitors of DNA methylation: mechanistic studies and their implications for cancer
therapy. Oncogene 2002; 21: 5483-95.
15. Jones PA. Altering gene expression with 5-azacytidine. Cell 1985; 40:
485-6.
16. Yan C, Boyd DD. Histone H3 acetylation and H3 K4 methylation define distinct chromatin regions permissive for transgene expression. Mol Cell Biol 2006; 26: 6357-71.
17. Lund AH, van Lohuizen M. Polycomb complexes and silencing mecha- nisms. Curr Opin Cell Biol 2004; 16: 239-46.
18. Shivapurkar N, Toyooka S, Toyooka KO, Reddy J, Miyajima K, Suzuki M, Shigematsu H, Takahashi T, Parikh G, Pass HI, Chaudhary PM, Gazdar AF. Aberrant methylation of trail decoy receptor genes is frequent in mul- tiple tumor types. Int J Cancer 2004; 109: 786-92.
19. Gehring WJ, Affolter M, Burglin T. Homeodomain proteins. Annu Rev Biochem 1994; 63: 487-526.
20. Rauch T, Wang Z, Zhang X, Zhong X, Wu X, Lau SK, Kernstine KH, Riggs AD, Pfeifer GP. Homeobox gene methylation in lung cancer stud- ied by genome-wide analysis with a microarray-based methylated CpG island recovery assay. Proc Natl Acad Sci USA 2007; 104: 5527-32.
21. Wu Q, Lothe RA, Ahlquist T, Silins I, Trope CG, Micci F, Nesland JM, Suo Z, Lind GE. DNA methylation profiling of ovarian carcinomas and their in vitro models identifies HOXA9, HOXB5, SCGB3A1, and CRABP1 as novel targets. Mol Cancer 2007; 6: 45.
22. Hallden G, Hadi M, Hong HT, Aponte GW. Y receptor-mediated induc- tion of CD63 transcripts, a tetraspanin determined to be necessary for differentiation of the intestinal epithelial cell line, hBRIE 380i cells. J Biol Chem 1999; 274: 27914-24.
23. Minth CD, Andrews PC, Dixon JE. Characterization, sequence, and ex- pression of the cloned human neuropeptide Y gene. J Biol Chem 1986;
261: 11974-9.
24. Liu AJ, Furusato B, Ravindranath L, Chen YM, Srikantan V, McLeod DG, Petrovics G, Srivastava S. Quantitative analysis of a panel of gene expression in prostate cancer--with emphasis on NPY expression analy- sis. J Zhejiang Univ Sci B 2007; 8: 853-9.
25. Abe M, Watanabe N, McDonell N, Takato T, Ohira M, Nakagawara A, Ushijima T. Identification of genes targeted by CpG island methylator phenotype in neuroblastomas, and their possible integrative involve- ment in poor prognosis. Oncology 2008; 74: 50-60.
26. Pitha PM, Au WC, Lowther W, Juang YT, Schafer SL, Burysek L, Hiscott J, Moore PA. Role of the interferon regulatory factors (IRFs) in virus-medi- ated signaling and regulation of cell growth. Biochimie 1998; 80: 651-8.
27. Yanai H, Chen HM, Inuzuka T, Kondo S, Mak TW, Takaoka A, Honda K, Taniguchi T. Role of IFN regulatory factor 5 transcription factor in anti- viral immunity and tumor suppression. Proc Natl Acad Sci USA 2007;
104: 3402-7.
28. Guenther MG, Levine SS, Boyer LA, Jaenisch R, Young RA. A chromatin landmark and transcription initiation at most promoters in human cells. Cell 2007; 130: 77-88.
29. Bernstein BE, Meissner A, Lander ES. The mammalian epigenome. Cell 2007; 128: 669-81.
30. Ohm JE, McGarvey KM, Yu X, Cheng L, Schuebel KE, Cope L, Moham- mad HP, Chen W, Daniel VC, Yu W, Berman DM, Jenuwein T, Pruitt K, Sharkis SJ, Watkins DN, Herman JG, Baylin SB. A stem cell-like chroma- tin pattern may predispose tumor suppressor genes to DNA hypermeth- ylation and heritable silencing. Nat Genet 2007; 39: 237-42.