Yoon, Jaeyong 윤`재`용 Member·Myongji University·Ph.D Candidate (E-mail : [email protected])
Kim, Hyunmyung 김`현`명 Member·Myongji University·Associate Professor·Corresponding Author (E-mail : [email protected]) Lee, Eui-Eun 이`의`은 Member·Myongji University·Professor (E-mail : [email protected])
Yang, Inchul 양`인`철 Member·Korea Institute of Civil Engineering and Building Technology·Senior Researcher (E-mail : [email protected])
Jeon, Woohoon 전`우`훈 Member·Korea Institute of Civil Engineering and Building Technology·Senior Researcher (E-mail : [email protected])
1. INTRODUCTION
Since Intelligent Transport Systems(ITS) was first introduced in late 90’s, the field of transportation have been developing greatly together with ITS. More ITS technologies
have been applied in freeways and national highway systems and, -traffic information such as travel speed collected and disseminated in a rea-time basis.
These traffic information is simply provided to end-users
Int. J. Highw. Eng. Vol. 18 No. 3 : 87-94 JUNE 2016 http://dx.doi.org/10.7855/IJHE.2016.18.3.087
ABSTRACT
PURPOSES :This study analyzed the lane-by-lane traffic flow characteristics in Korea by using real-world data, including congestion levels, for 2-, 3-, and 4-lane freeways.
METHODS :On the basis of a literature review, lane flow and speed characteristics were analyzed using flow measurements and speed ratios. In addition, the effect of congestion levels on traffic flow were visualized using rescaled cumulative plots.
RESULTS :Driver behavior varied depending on the congestion level. During free-flow conditions, the lane-use ratio of individual lanes varied largely, whereas during congestion, the ratio was nearly the same for all lanes (i.e., equilibrium). During maximum-flow and congestion conditions, the median lane was used more than the shoulder lane, whereas during all other conditions, the shoulder lane had a higher lane-use ratio. In 3- or 4-lane freeways, the lane-use ratio of the median lane always exceeded 1 and was the highest during free-flow conditions.
CONCLUSIONS :The results of the present analysis can be used as an index to predict congestion before a lane is overcapacitated.
Moreover, the results can be applied in variable lane guidance systems, such as car navigation systems and variable message displays, to control traffic flow.
Keywords
lane-use ratio, traffic congestion, traffic flow, lane-by-lane
Corresponding Author : Kim, Hyunmyung, Associate Professor Department of Transportation Engineering, Myongji University, 116, Myongji-ro, Cheoin-gu, Yongin-si, Gyeonggi-do, 17058, Korea Tel : +82.31.339.6502
E-mail : [email protected]
International Journal of Highway Engineering http://www.ksre.or.kr/
ISSN 1738-7159 (print) ISSN 2287-3678 (Online)
Received Sep. 04. 2015 Revised Sep. 08. 2015 Accepted May. 24. 2016
Analysis of Lane-by-lane Traffic Flow Characteristics in Korea by Using Multilane Freeway Data
국내 다차로 고속도로 자료를 이용한 차로별 교통류 특성 분석
and in a form of information that users desire through big data analysis, which brought the expansion of the conventional data analysis. In addition cat navigation systems collects and store the vehicle trajectories from the Global Positioning Systems(GPS), and utilizes them for drivers' route choice analysis which result in the provision of various type of traffic information to end-users.
Recently, these technologies are being developed - not only in the field of traffic information - but also in the field of vehicle and communication, such as vehicle platooning, autonomous vehicle, and V2X using the IT technology.
Especially, these are a lot of pilot projects for the autonomous vehicles around the world, developing the primary technologies including, sensor, recognition, routing, and control technologies.
These recent trends are showing that the paradigms in developing transportation technologies are changing from a macroscopic to a microscopic point of view. Also, there are various services provided by technologies . In this regard, it is a reasonable idea that car navigation systems capable of lane- based route guidance will be available in the near future.
For the development of such state-of-the-art technologies the theoretical studies on the lane-by-lane traffic characteristics must be conducted, for example, the features of lane use for the lane-based route guidance of car navigation systems.
Therefore, in this study the authors seek to study the features of lane use based on the real-world data for 2-,3-,4- lane freeways with congestion levels and infer driver behavior to facilitate future behavioral modeling research.
2. LITERATURE REVIEW
Some studies, on the analysis of traffic characteristics tried to use the lane-by-lane traffic data.
May(1990) compared individual lane speeds of L.A Hollywood Freeway concluding that during free flow, the lane-by-lane speeds shows a high variation while they a similar to one another during congestion. When the average speed was 40mph, the median lane's speed was 8mph higher while the shoulder lane's speed was 5mph lower.
Recently several researchers have conducted a traffic operation analysis using microscopic simulation. Since lane
data provides more in-depth information of traffic characteristics compared to average data, researchers became aware of the significance of lane data. Therefore related studies on lane data have been ongoing.
In order to use microscopic simulation models and other operational tools, such as incident detection algorithms, Carter et al.(1999) suggested the analysis of lane-specific data. After analysis, Carter et al(1999) concluded that there is a difference in q-u curve in each lane and site. They collected data from Canada`s Queen Elizabeth Way (QEW) Freeway and used the ANOVA method to analyze. From the results of the lane speed distribution analysis, median lane's speed was the highest, followed by the center lane, and then the shoulder lane. This conclusion is similar to the theory by May. Also from the results of the lane occupancy analysis, during congestion, shoulder lane's volume increased and median and center lanes' volume decreased.
Previous studies used empirical data to explore the lane traffic characteristics. However, Daganzo(2002) proposed a theoretical traffic behavioral model instead of analyzing collected data. He stated that drivers show two different behaviors. First, drivers change lane depending on their maximum desire speed, and secondly, drivers keep a low spacing in a passing procedure. In explaining this theory, drivers were differentiated into a rabbit and a slug, and the lanes into passing lane and a shoulder lane. A traffic flow state is divided into a free-flow and a congestion state. Also, it is assumed that in a congestion state, every lane has an equilibrium speed. This assumption does not apply to merge and diverge, but only the basic freeway segments. In this state, slip(density and speed changes, but does not interact with one another), simple wave(there is no lane changes but an increase in speed due to following the front car), and mixed wave(both speed and lane changes exist) exist.
Although Daganzo “never”used real life data and made
“several assumptions”to model his lane usage behavior, his theory is still well respected by the traffic flow researchers.
Banks and Amin(2003) invented the flow and speed ratio measurement to test Daganzo's theory in multi-lanes. In this research, the concept of flow ratio measurement is used as a proportion of a single lane's volume to the whole volume, and if the measurement is over 1, that individual lane has a traffic volume higher than other lanes. In addition speed ratio measurement is a similar concept, but, the difference is that if
the ratio is over 1, it means that the certain lane has a higher speed usage than other lanes. Also, flow/speed accumulations measurement was used to analyze the change in flow and speed over a time period. Accumulation rate used here is in a form of a accumulating curve. For example, if the curve bends less, it means that the ratio is lower than the average.
Analysis uses data from detectors located in a bottleneck point and incident point from freeways in San Diego, US and Toronto, Canada. From observing accumulation rate measurement of the median lane, it was discovered that a change of flow rate during over time period is small, while changes in speed was larger. Once a congestion occurred, difference in speed between lanes was shown, which is different from Daganzo's theory stating there would be no difference in speed after congestion occurred.
Amin and Banks(2005) analyzed lane usage depending on flow rate, time, and location by using data from flow measurement invented by Banks and Amin(2003). Data used here were collected from the detectors in the freeways of I-5, I-805, I-8, and R-78 in San Diego, USA. According to the data analysis, the flow ratio was over 1 in most of the points except where flow rate was below 500/h. Flow ratio steadily increased before decreasing when switching from free flow to congestion state, and increased once a congestion state recovered once more into a free flow. But even after the congestion, there were numerous points where the flow ratio was over 1, which show a different result to Daganzo's. Amin and Banks(2005) also analyzed median lane's traffic pattern depending on the flow rate, time, and location, but were unable to reach general conclusion because most points for analysis were bottleneck or incident points.
Lee and Park(2012) used traffic density to analyze lane use distribution. Past studies mostly used flow rate to analyze, but since two different values of flow rate exist, they used density instead to explain lane use distribution. This study analyzes the characteristics of individual lanes when it is in either non- congestion or congestion, which is part of a transition. In transition(non-congestion), the median lane use is lower as the density is low, and also increases when the density does.
On the other hand, the center lane use is the highest when the density is at the lowest, which can be explained through the fact that, there are more opportunities to move to either median or shoulder lanes. Also, in comparing freeways with different number of lanes, the lane usage became closer to a
parallel as the density increased in a 3-lane freeway, than on a 2-lane freeway because of the fact, that drivers are have more opportunities to change lanes to keep their desired velocity as more lanes are avaliable. In a congestion, in comparison to a transition, the lane usage remains stable. That is, the ratio of lane usage becomes closer to 1. In this state, passing vehicles have less opportunity to pass or change lanes. In conclusion, the usage of a median lane increases in a non-congestion transition, and the lane usage of every lane become equilibrium as the density increases. In a transition during a congestion however, the middle lane and the center lane which had the highest lane usage, decreases as the density and the lane usage of a median lane increases.
Chung and Cassidy(2004) used data from freeways to test Daganzo's theory, which were collected from loop detectors of the Gardiner Expressway in Toronto, Canada. This particular data was analyzed from one of four detectors which an active bottleneck existed. In this paper, 5-min sampling interval data from before and after the congestion to explain the semi-congested traffic. From analyzing the individual lanes, queue can be observed in the median lane in a semi- congested condition, in which the rabbit is what effects the queue. However, the traffic of the shoulder-lane remained uncongested.
Mauch(2002) used the oscillations to analyze the characteristics of the queued traffic in a congested freeway. He also analyzed the traits of vehicle lane-changing depending on the freeway geometry. The result of the rescaled cumulative flow analysis showed that in near interchanges, the flow increased in the shoulder lane. In other words, the shoulder lane was used more frequently than other lanes.
Duret et al.(2012) analyzed characteristic of lane flow distribution on a three-lane freeway. In a free-flow traffic, each lane is influenced by lane flow distribution. Also, in comparing the overall flow and the individual lane flow, median lane flow increased with the overall flow, where the center lane and the shoulder lane flow showed the tendency to decrease.
3. DATA REDUCTION
3.1. Study site and data collection
To analyze lane-by-lane traffic characteristics, data were
collected from basic freeway segments. which were classified into three categories: 2-lane, 3-lane, and 4-lane freeways. The freeway loop detectors are located in midpoint of link. The sites is not within the influence other condition(vertical curve and traffic accident, weather) The data were collected as raw data based on 30-second interval, and we aggregated them into 15- minute data for analysis as Highway Capacity Manual(2010, TRB) suggested that 15-minute flow rate is the most stationary state with the least variation of flow.
The data was also filtered to remove the detector error, controller error, and communication line error. Occupancy over 100, velocity over 180km/h, flow(30 seconds) over 38, and flow and speed of 0 were excluded. Datas were collected from Seohaean(Iljik JC-Gumcheon IC, Songak IC-Balan IC), Yeongdong(N.Suwon IC-E, SuwonIC), Seoul Ring(Jayoo-ro IC-Kimpo IC, Kimpo IC-Kimepo TG, Kimpo TG-Noohji JC, Seowoon JC-Jungdong IC), which are congested freeways.
3.2. Flow and speed measure
In this paper, lane flow characteristics were analyzed using flow speed ratio measurement(table 1,2) invented by Banks and Amin. Measurements used are as below.
= flow ratio
= speed ratio
= flow in lane i
= speed in lane i
= number of lane
Also rescaled cumulative plots were also used to analyze congestion characteristics invented by Cassidy. This analysis tool can identify changes of temparal-spatial.
= cumulative flow
= background flow
= time
4. DATA ANALYSIS
4.1. Lane Use Distribution on 2-lane Freeway In this section, ratio of lane represents that of individual lane flow from the total lane flow. Therefore, the higher ratio does not necessary mean that the certain lane has a higher flow or speed. For example, when the flow increases in a median lane highway, both increase and decrease of flow shoulder lane is observed, and the gap between the increase and the decrease is higher on the median lane. Lane usage can be observed from this measurements. Lane use distribution uses a data from a freeway link, separated merge, and diverge ramp(A1, B2, C2).
In the case of 2-lane freeway, lane use behavior are shown to be symmetric. From 0am to 6am, the maximum flow ration of the shoulder lane was 1.83, and the minimum flow ratio of shoulder lane 0.16. In other words, drivers tend to use shoulder lane more in the dawn-time period. Starting from the point of 5am, the flow ratio median lane rapidly increases, where the shoulder lane decreases.
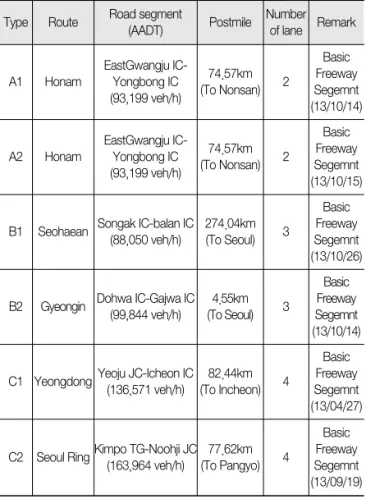
Table 1. Study Site Type Route Road segment
(AADT) Postmile Number of lane Remark
A1 Honam
EastGwangju IC- Yongbong IC (93,199 veh/h)
74.57km (To Nonsan) 2
Basic Freeway Segemnt (13/10/14)
A2 Honam
EastGwangju IC- Yongbong IC (93,199 veh/h)
74.57km (To Nonsan) 2
Basic Freeway Segemnt (13/10/15)
B1 Seohaean Songak IC-balan IC (88,050 veh/h)
274.04km (To Seoul) 3
Basic Freeway Segemnt (13/10/26)
B2 Gyeongin Dohwa IC-Gajwa IC (99,844 veh/h)
4.55km (To Seoul) 3
Basic Freeway Segemnt (13/10/14)
C1 YeongdongYeoju JC-Icheon IC (136,571 veh/h)
82.44km (To Incheon) 4
Basic Freeway Segemnt (13/04/27)
C2 Seoul RingKimpo TG-Noohji JC (163,964 veh/h)
77.62km (To Pangyo) 4
Basic Freeway Segemnt (13/09/19) Date : year/month/day
(1)
(2)
(3)
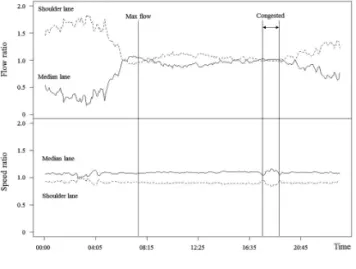
At 6:20am, each flow ratio merges to rq =1, and only a small increase or decrease is observed afterward. After maximum flow rate is observed, the usage of the shoulder lane is much higher than that of the median lane. After congestion, the flow ratio of lanes again closed to 1, but the speed ratio in the median lane is shown to be higher than the shoulder lane in every analyzed time. As seen in Fig 1, at the congestion condition, the flow ratio of lane stayed stable, while non- congestion became the opposite. Table 2 shows the standard deviation of each lane in 5 minutes time-interval. In non- congestion period(9am-17pm), the average standard deviation is 0.80 and in congestion period(17pm-18pm), 0.16. Queue occurrence time, which is the value of standard deviation, can be predicted by re-calculate using 5-min moving range method. This method is an application of the moving average method, using the standard deviation of the past hour.
4.2. Lane Use Distribution on 3-lane Freeway In a 3-lane freeway, compared to a 2-lane highway where the shoulder lane was most used, the usage of center and the median lane is much higher. As seen in Fig 2, at every analyzed time, the flow ratio of the center lane remained over 1. After 8am, the flow ratio of the center lane remained the highest, with median lane and the shoulder lane which comes in the order. If this pattern continues, the flow ratio reaches a equilibrium point at congestion condition. In the non- congestion, the speed ratio of lanes is highest in the order of median lane, center lane, and the shoulder lane. As seen in Table 2, in the non-congestion period(09am-17pm) the average standard deviation is 2.02, and in the congestion period(18pm-19pm), 0.35. This result is similar in characteristics with that of 2-lane freeway.
4.3. Lane Use Distribution on 4-lane Freeway In the case of 4-lane freeway, the flow ratio of median and center lane is higher, which was similar to that of 3-lane freeway. Also, the flow ratio of median lane remains over 1 Fig. 1 A1 Flow and Speed Ratio
Fig. 2 B2 Flow and Speed Ratio
Fig. 3 C2 Flow and Speed Ratio
Type standard deviation A1
standard deviation B2
standard deviation C2
09:00 0.24 2.20 2.34
10:00 0.80 2.27 1.61
11:00 1.28 2.08 0.89
12:00 1.29 2.10 0.38
13:00 1.10 2.15 0.37
14:00 0.87 2.21 0.26
15:00 0.41 1.81 0.18
16:00 0.26 2.11 0.25
17:00 0.43 1.29 0.20
18:00 0.16 0.33 0.28
19:00 0.16 0.36 1.02
20:00 0.44 2.12 2.31
21:00 1.08 2.46 2.19
Table 2. Standard Deviation of Flow Ratio
the entire analyzed time. On the other hand, in the non- congestion period, rq <1, and merges in the congestion Period. In the case of speed ratio, there are no clear differences, unlike the other 2 freeways.
4.4. Analysis of Congested Traffic
From the lane usage data, the difference in the lane usage can be observed, depending on the Congestion. However, this analyzes is limited to the fact that the data only shows relative proportion of volume and speed of each lane, and not it's individual characteristics. So, we will be looking at each lane's individual characteristics using the rescaled cumulative plots analyzes. Rescaled cumulative plots of 2 hours, a hour before and after the congestion was analyzed to examine the increase trend. Rescaled cumulative plots uses the equation 3, the background flow(Q), which is the average cumulative flow, is shown as a equation 3, and t is a curve's start time. In the case where the result V(t) > Q(t), V(t) is a higher volume than average, where on the other hand, in V(t) < Q(t), V(t) is lower than the average. For example, if the start time is at 6am, the cumulative flow becomes 0, and can be analyzed from that point on.
Lane characteristics analyzes from respective detectors, each from 2-lane, 3-lane, and 4-lane freeways are as follows : Fig. 4 is a 2-lane freeway with similar characteristics between the median and the shoulder lane. Fig. 5 and Fig. 6 is a 3-lane freeway with a different flow characteristics for individual lanes. Fig. 7 and Fig. 9 is a 4-lane freeway also with different flow char for every lane(median, shoulder, center lane).
The following is a specific analyzes for individual lane characteristics. The flow of the median lane increases before 1 hour of the congestion, reaches the maximum when congestion occurs, and decreases afterwards. This occurred at every detectors from analyzed freeways. In the case of the center lane, the increase was in a similar form, but the cumulative flow was not as much as the median lane.
However in the shoulder lane, the result is a contrast one from the other 2 lanes, and shows a decrease in the cumulative flow. In this case, the shoulder lane flow is at the minimum when congestion occurs, and increases afterward.
This trend can only be observed in a 3-lane or a 4-lane freeway. A 2-lane freeway shows a similar characteristics
between the shoulder and the median lane. It must be pointed out that the decrease in the cumulative flow does not mean the decrease in the traffic flow, but a flow gradually being observed lower than the average. When congestion occurs, in most cases, it can be observed that it first occurs in the median lane. Also, after a congestion occurs in a single lane, it took maximum of 3 minutes before it also happened in other individual lanes. The following figures shows the characteristics of median lanes. In Fig. 4, after 23 minutes of
> 0, a congestion occurred. However, in Fig. 5, it occurred after 60 minutes.
In result, is can be observed that a 2-lane freeway changes to a fully congested regime from a non-congested state faster than a 3-lane freeway.
3-lane and 4-lane freeway has the following characteristics: difference value between the maximum cumulative flow of each lane, shown as g1 and g2, are similar in Fig. 5. Shoulder lane in every freeway, except the 2-lane, has a similar N-curve. As seen Fig. 5, the N-curve of the shoulder lane is in a symmetrical form of the center and the median lane.
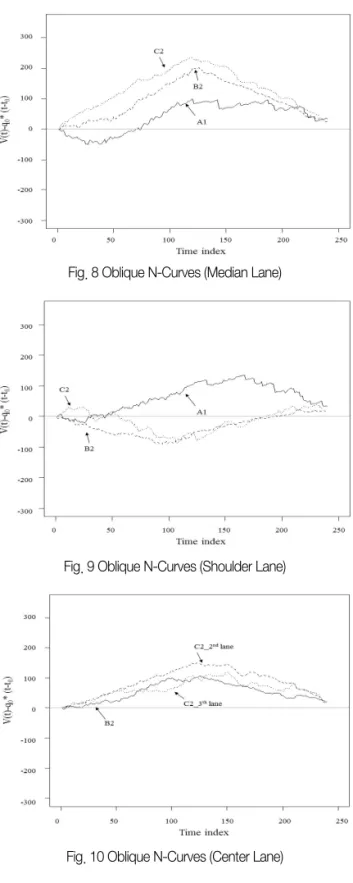
In this section, separate lanes from all different form of freeways, center, median, and shoulder, are individually observed. To analyze this data, a similar N-curve form A1, B2, C2 were selected. First, shape of N-curve of the median lane is similar to each freeway, but all have different maximum value. C2(4-lane freeway) is at it's maximum, and B2(3-lane freeway) A1(2-lane freeway) follows. Also a similar value can be observed between the maximum value of N-curve of C2 and B2, when A1 shows a different maximum value of the N-curve. The maximum value difference of C2 - B2 is only 35, when B2 - A1 results in 101, and C2 - A1 is 136. The shoulder lane shows a different results from the median lane. Shape of N-curve of C2 and B2 are similar, while the A1 has a different shape.
This shape has a closer N-curve shape that of Fig. 9, because the shoulder lane in a 2-lane freeway is used as a driving lane. As for the center lane, the similarity in the shape of the N-curve is far greater than other lanes. The maximum value difference of each N-curve is a lot less in value compared to other lanes.
5. CONCLUSION
According to the lane usage data, the behavior of drivers differed depending on congestion and non-congestion on the use of freeway lanes. In a free flow, the lane usage ratio of individual lanes differed largely, while in a congestion the ratio is almost the same, in other words, equilibrium.
This result is similar to previous research. In particular, it is explained in Daganzo's theory, if a queue occurs in a situation Fig. 4 A1 Oblique N-Curves
Fig. 5 B1 Oblique N-Curves
Fig. 6 C1 Oblique N-Curves
Fig. 7 C2 Oblique N-Curves
Fig. 9 Oblique N-Curves (Shoulder Lane)
Fig. 10 Oblique N-Curves (Center Lane) Fig. 8 Oblique N-Curves (Median Lane)
where the lane usage of each lane becomes similar, density increases and results in the rabbit losing it's desired velocity.
In this paper, in maximum flow and congestion, the lane usage of the median lane was higher than the shoulder lane, while in every other situation, the shoulder lane was higher.
These results are complete opposite of analysis done by Lee and Park(2012). In a freeway with a 3-,4-lanes, the lane usage ratio of the center lane(rq) was always higher than 1. Also in a free-flow, the ratio of center lanes was shown to be the highest. These trend was interpreted as drivers preferring center lane over median lane or shoulder lane because of it's higher opportunity in changing lanes.
Through analysis of congested traffic, it appears that the cause of congestion is the over-capacity of flow in the median lane. It can be assumed that the reason for congestion is in the increase of traffic flow, considering that the freeway section where the data was collected is a freeway basic segment without a ramp that affects the overall flow. In every analyzed 2-,3-,4-lane freeway, the median lane showed the highest increase in the overall flow, showed the highest speed in a congestion compared to other lanes, and also the shortest time before the congestion occurred.
In analysing flow accumulation trend of individual lanes in a congestion, a 2-lane freeway showed similar characteristics of median lane and the shoulder lane. Both 3-lane and 4-lane freeway showed that median lane, center lane, and the shoulder lane showed different characteristics in the flow accumulation trend. In 2-lane freeway, median lane first congestion since shoulder lane is used mainly for heavy vehicles in korea expressway
Therefore, the result of individual lanes analysis can be used as an index to predict when the congestion occurs before the lane becomes over-capacity. Also, it can be applied in variable lane guidance system, in navigation system to operate traffic flow. For example, if a congestion is about to occurs in a median lane, it can be prevented by inducing vehicles in median lane to change to center or shoulder lane by using the variable lane guidance system.
This paper does not contain data error, meets the traffic flow fundamental q-k-v- curve standards and uses sample datas from congestion. So, it lacks the number of data. In future studies, more samples of data will be required.
REFERENCES
Amin M. R., J. H. Banks, 2005. Variantion in freeway lane use patterns with volume, time of day, and location, Transportaion Research Record 1934, pp132-139.
Banks. J. H., M. R. Amin., 2003. Test of behavioral theory of multilane traffic flow; Queue and queue discharge flows, Transportaion Research Record 1852, pp159-166.
Carter, M., H. Rakha, M. Van Aerde, 1999. Variability of traffic flow measure across freeway lanes, Canadian Journal of Civil Engineering, 26. 3. pp270-281.
Cassidy, M. J., 1998. Bivariate relations in nearly stationary highway traffic, Transportation Research Part B:
Methodological, vol.32, No 1, pp 49-59.
Chung and Cassidy, M. J., 2004. Test of theory of driver behavior on homogeneous freeways, Transportaion Research Record 1883, pp14-20.
Daganzo, C. F., 1997. Fundamentals of transportation and traffic operations, Elsevier Science, New York.
Daganzo, C. F., 2002a. A behabioral theory of multilane traffic flow, Part I: Long homogeneous freeway sections, Transportation Research Part B: Methodological, Vol. 36, No.2, pp131-158.
Daganzo, C. F., 2002b. A behabioral theory of multilane traffic flow, Part II: Long homogeneous freeway sections, Transportation Research Part B: Methodological, Vol. 36, No.2, pp159-169.
Duret, A, Ahn, Buisson C., 2012. Lane flow distribution on a three- lane freeway: General features and the effects of traffic controls, Transportation Research Part C: Emerging Technologies, Vol.
24, pp 157-167.
Lee and Park, 2012. Determining Lane Use Distributions Using Basic Freeway Segment Density Measures, Journal of Transportation Engineering, Vol. 138, No. 2, pp 210-217.
Mauch. M., 2002. Analysis of start-stop waves in congested freeway traffic. PhD dissertation, University of California, Berkeley, USA.
May. A. D, 1990. Traffic Flow Fundamental, Prentice Hall, pp120- 123.
Transportation Research Board(TRB), 2010. Highway capacity manual, Washington, DC.