Publications of the Korean Astronomical Society pISSN 1225-1534
32: 185∼ 187, 2017 March eISSN 2287-6936
⃝2017. The Korean Astronomical Society. All rights reserved.c https://doi.org/10.5303/PKAS.2017.32.1.185
INFRARED – X-RAY CONNECTION IN NEARBY ACTIVE GALACTIC NUCLEI; AKARI AND MAXI RESULTS Naoki Isobe1, Takao Nakagawa1, Kenichi Yano1,2, Shunsuke Baba1,2, Shinki Oyabu3, Yoshiki Toba4,
Yoshihiro Ueda5, and Taiki Kawamuro5
1Institute of Space and Astronautical Science (ISAS), Japan Aerospace Exploration Agency (JAXA)
2Department of Physics, Graduate School of Science, The University of Tokyo
3Graduate School of Science, Nagoya University
4Research Center for Space and Cosmic Evolution, Ehime University
5Department of Astronomy, Kyoto University E-mail: [email protected]
(Received June 29, 2015; Revised October 21, 2016; Accepted October 21, 2016)
ABSTRACT
Combining the AKARI Point Source Catalog and the 37-month Monitor of All-sky X-ray Image (MAXI) catalog, the infrared and X-ray properties of nearby active galactic nuclei were investigated. The 37-month MAXI catalog tabulates 100 nearby Seyfert galaxies, 73 of which are categorized into Seyfert I galaxies.
Among these Seyfert galaxies, 69 ones were found to have an AKARI infrared counterpart. For the Seyfert I galaxies in this sample, a well-known correlation was found between the infrared and X-ray luminosities. However, the observed X-ray luminosity of the Seyfert II galaxies tends to be lower for the infrared luminosity than the Seyfert I galaxies. This suggests that the X-ray absorption is significant in the Seyfert II galaxies. The Seyfert II galaxies seem to have a bimodal distribution of the IR color between 18 µm and 90 µm. Especially, a large fraction of the Seyfert II galaxies exhibits a redder IR color than the Seyfert I galaxies. A possible origin of the redder IR color is briefly discussed, in relation to the star formation activity in the host galaxy, and to the X-ray absorption.
Key words: galaxies: active — infrared: galaxies — X-ray: galaxies
1. INTRODUCTION
Based on the unified picture (e.g., Antonucci, 1993) of active galactic nuclei (AGNs), X-ray emission from AGNs is widely believed to originate in the vicinity of their central supermassive black hole and accretion disk.
It is thought that the nuclear photons are absorbed in the pc-scale dust torus and clouds surrounding the su- permassive black hole, and they are reprocessed into the infrared (IR) radiation. Therefore, a combination of X- ray and IR observations is expected to provide us with one of the most efficient probes for the AGNs. Actu- ally, an IR to X-ray luminosity correlation was reported from a number of AGN samples (e.g., Gandhi et al., 2009; Matsuta et al., 2012). This correlation favors a clumpy torus model (e.g., Krolik & Begelman, 1998).
http://pkas.kas.org
In the present paper, we investigated the X-ray and IR properties of nearby AGNs, by utilizing the two re- cent all-sky surveys. For the X-ray survey, we adopted the all-sky X-ray catalog (Hiroi et al., 2013), created in the 37 month observation with the Monitor of All sky X-ray Image (MAXI). The sensitivity of the 37-month MAXI catalog (7.5× 10⁻¹³ ergs s−1 cm−2 in the 4 – 10 keV range) is the highest among the available all-sky X-ray surveys. For the IR survey, the AKARI Point Source Catalog (Ishihara et al., 2010; Yamamura et al., 2012), covering the wavelengths from 9 – 160 µm with the 6 photometric bands, is utilized. There are several advantages in the AKARI catalog for this study, includ- ing its wavelength coverage in the 10 – 20 µm range, where the torus emission is dominant. In addition, the data in the longer wavelengths (such as in 90 µm) is optimal to estimate the emission from the host galaxy.
185
186 ISOBE ET AL.
2. RESULT
2.1. Source Identification
In the 37-month MAXI catalog, 500 X-ray sources are listed at high Galactic latitude of |b| > 10◦. These include 100 nearby Seyfert galaxies (73 Seyfert I and 27 Seyfert II galaxies), located in the redshift range of z = 0.002 – 0.15. We searched the AKARI Point Source Catalog for IR counterparts of these Seyfert galaxies.
Here, a search radius of 10” and 20” is adopted for the sources detected with the Infrared Camera and Far- infrared Surveyor, respectively, by considering the po- sition accuracy in the AKARI catalog (Ishihara et al., 2010; Yamamura et al., 2012). As a result, we found an IR counterpart for 69 MAXI-selected Seyfert galaxies, at least in one AKARI photometric band.
2.2. IR to X-ray Luminosity Relation
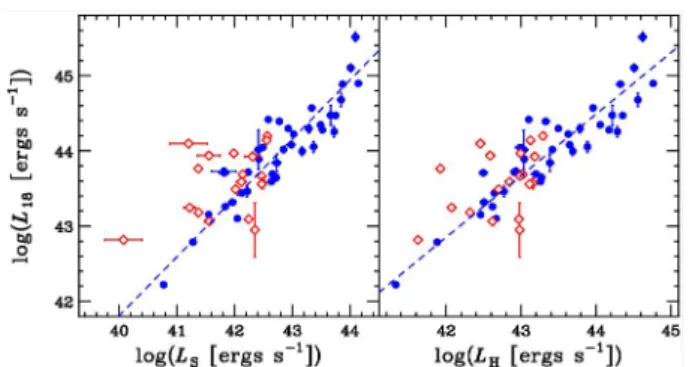
Figure 1 shows the relation between the 18 µm IR lu- minosity, L18, and the soft (3 - 4 keV) and hard (4 - 10 keV) band X-ray luminosities, LS and LH respectively, for the 69 Seyfert galaxies, detected with MAXI and AKARI. Here, the X-ray luminosity was uncorrected for the interstellar absorption, while dust extinction was not accounted for the IR luminosities. Since we deal with only the nearby sources at z < 0.15, the K-correction was not applied.
As is represented by the regression line in Figure 1 (the dashed line in each panel), the Seyfert I galaxies in this sample were found to exhibit the well-known cor- relation between the IR and X-ray luminosities (e.g., Gandhi et al., 2009; Matsuta et al., 2012). The par- tial correlation function between log(L18) and log(LH), where the effect from the artificial correlation due to the redshift is removed, was evaluated as ρz= 0.74. In contrast, no significant correlation was derived for the Seyfert II galaxies, as is parameterized by the log(L18)–
log(LH) and log(L18)–log(LS) partial correlation func- tions of ρz = 0.04 and −0.01, respectively. Especially, the observed X-ray luminosity of the Seyfert II galaxies tends to be lower for the IR luminosity than that of the Seyfert I galaxies. This tendency is more prominent in the log(L18)–log(LS) plot. We naturally attribute this to significant X-ray absorption in the Seyfert II galaxies, due to mechanisms such as the dust torus blocking our line of sight to their nucleus.
2.3. IR Color and X-ray Hardness
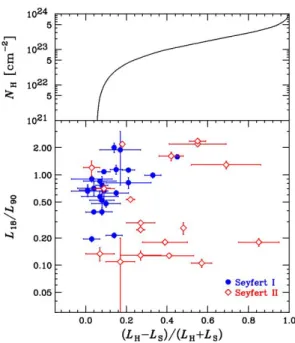
In the lower panel of Figure 2, the IR color between the luminosities at 18 µm and at 90 µm, L18/L90,
Figure 1. IR luminosity, L18, plotted against the X-ray lumi- nosities in the soft and hard bands, LSand LSrespectively, for the Seyfert galaxies detected with MAXI and AKARI.
The filled circles indicate the Seyfert I galaxies, while the open diamonds indicate the Seyfert II galaxies. The dashed line in each panel show the regression line (”OLS bisector”
defined in Isobe et al., 1990) between the IR and X-ray luminosities for the Seyfert I galaxies.
is plotted against the X-ray hardness ratio, HR = (LH− LS)/(LH+ LS). As shown in the Figure 2 upper panel, the interstellar absorption hydrogen column den- sity NHis estimated from the X-ray hardness, assuming the photon index of the nuclear X-ray power-law spec- trum as Γ = 1.9 (the typical value for Seyfert galaxies).
The Seyfert I galaxies occupy a relatively narrow re- gion around L18/L90= 0.5 – 1 and HR = 0 – 0.2. The X-ray hardness is found to be insensitive to NH for the Seyfert I galaxies. In contrast, the Seyfert II galaxies exhibit a higher X-ray hardness up to HR∼ 0.9, indi- cating a significant absorption of NH≲ 5 × 1023 cm−2. Interestingly, the IR color distribution of the Seyfert II galaxies seems to be bimodal, i.e., while some Seyfert II galaxies exhibit a L18/L90 color similar to those of the Seyfert I galaxies, a larger fraction of the Seyfert II galaxies show a redder color, L18/L90= 0.1 – 0.2. Such a kind of the IR color distribution is not interpreted by the orientation of the dust torus to our line of sight.
A lower L18/L90 value indicates a higher contribution of the IR emission from the host galaxy. Therefore, we propose that a star formation rate is higher in the redder Seyfert II galaxies than in the bluer ones, including the Seyfert I galaxies. The high star formation activity in the red sources may increase the amount of dust, which also enhance the X-ray absorption.
REFERENCES
Antonucci, R., 1993 Unified models for active galactic nuclei and quasars ARA&A, 31, 473
Gandhi, P., et al., 2009, Resolving the mid-infrared cores of local Seyferts, A&A, 502, 457
INFRARED AND X-RAY CONNECTION IN NEARBY ACTIVE GALACTIC NUCLEI 187
Figure 2. The lower panel plots the IR color L18/L90against the X-ray hardness HR = (LH−LS)/(LH+ LS). The Seyfert I and II galaxies are indicated with the filled circles and open diamonds, respectively. In the upper panel, the X-ray hardness is converted to the absorption column density NH, assuming the intrinsic X-ray spectrum of power law with a photon index of Γ = 1.9.
Hiroi, K., et al., 2013, The 37 Month MAXI/GSC Source Catalog of the High Galactic-Latitude Sky, ApJS, 207, 36 Ishihara, D., et al., 2010, The AKARI/IRC mid-infrared all-
sky survey, A&A, 514, A1
Isobe, T., et al., 1990, Linear regression in astronomy, ApJ, 364, 104
Krolik, J. H. & Begelman, M. C., 1998, Molecular tori in Seyfert galaxies - Feeding the monster and hiding it, ApJ, 329, 702
Matsuta, K., et al., 2012, Infrared and Hard X-Ray Diag- nostics of Active Galactic Nucleus Identification from the Swift/BAT and AKARI All-sky Surveys, 753, 104 Yamamura, I., et al., 2012, AKARI-FIS Point Source Cata-
logue: Current Status and Future Plan, PKAS, 27, 105