INTRODUCTION
Self-rated health (SRH) is an indicator of an individual’s overall health. It reflects objective health status since the prevalence of diseases is associated with poorer SRH [1]. In 2018, SRH in Korea ranked the lowest among 35 countries of the Organization for Economic Cooperation and Development at 32%, which is less than half of the average [2]. Additionally, good/very good SRH among Korean women has been continuously increasing since 2016.
However, these results show that it is lower than men, especially fair, poor, and very poor SRH is higher than men [3]. Therefore, since SRH is an indicator of general health status and increases the predictive
validity [4], it is a need to increase good SRH among Korean women at the national level.
One-person households are the fastest-increasing type of households in the regions of the world [5], this phenomenon is related to health outcomes. One-person households have demonstrated worse physical health status and health-promoting behaviors than multi-person households [6]. In parallel, prior studies showed that the one-person households had poor SRH than multi-person households, which is especially related to the elderly people [7].
In a society where marriage trends are constantly changing, marriage has controversial findings related to health. Although marriage provides benefits in both physical and mental health [8], a
Effects of the Combination of Marital Status and
Household Type on Self-Rated Health among Korean Women
Ae Ji KimㆍJin Young Nam
Department of Healthcare Management, Eulji University, Seongnam, Korea
Background: Self-rated health of women according to marital status and household type has rarely been considered. This study determined the differences in the self-rated health of women according to marital status and household type.
Methods: Using cross-sectional data from the seventh Korea National Health and Nutrition Examination Survey, we included 9,990 women aged above 19 years. Multiple logistic regression was used to examine the relationships between self-rated health, marital status, and household type.
Results: Overall, 74.5% of the women reported poor self-rated health. Regarding marital status and household type, one-person households and unmarried women had a higher risk of poor self-rated health (odds ratio [OR], 1.45; 95% confidence interval [CI], 1.03–2.05), while multi-person households and no-spouse women had a lower risk of poor self-rated health (OR, 0.69; 95% CI, 0.58–
0.83). Furthermore, women who are one-person households and unmarried had a higher risk of poor self-rated health in those who had college or higher educational level (OR, 1.98; 95% CI, 1.25–3.13).
Conclusion: Self-rated health among women was associated with marital status and household type. Future studies are required to generalize these findings by considering various household compositions to improve women’s self-rated health status.
Keywords: Self-rated health; Marital status; Living arrangement; Households type; One-person household; Women’s health
Correspondence to: Jin Young Nam
Department of Healthcare Management, Eulji University, 553 Sanseong-daero, Sujeong-gu, Seongnam 13135, Korea
Tel: +82-31-740-7451, Fax: +82-31-740-7172, E-mail: [email protected]
Received: August 2, 2021, Revised: September 13, 2021, Accepted after revision: September 23, 2021
© Korean Academy of Health Policy and Management
◯
㏄This is an open-access article distributed under the terms of the Creative Commons Attribution Non-Commercial License (http://creativecommons.org/licenses/by-nc/4.0) which permits unrestricted non-commercial use,
distribution, and reproduction in any medium, provided the original work is properly cited.
previous study was suggested that people with spouses are healthier or poor health than unmarried people depending on their satisfaction with marriage life [9]. Moreover, divorced or widowed women were at higher risk of poor SRH in previous studies about SRH and marital status [10]. These results seem that the impact on health or SRH differs according to the marital status of various categories.
Until recently, most previous studies had shown that SRH was associated with age, education, socioeconomic status [11], chronic diseases [12], mortality [13], gender differences, and older adults [14].
Nevertheless, there is a paucity of studies on SRH regarding marital status [10,13] and household type [15]. Few studies have examined a direct association with SRH because most of these variables were included as covariates. However, our study considered the combination of marital status and household type because marital status and household type in previous studies appeared differently in the health-related problems of each category, and these variables can be used as a means of creating a household composition. This combination might better recognize the relationship between marital status and the household type and will stand based on solving health problems.
Therefore, this study investigated the differences in poor SRH among women according to marital status and household type and determined whether poor SRH according to marital status and household type is affected by socioeconomic status. It is necessary to identify solutions to reduce poor SRH among women with respect to the combination of marital status and household type.
METHODS
1. Data source and study population
This study used cross-sectional data between 2016 and 2018 from the seventh Korea National Health and Nutrition Examination Survey (KNHANES VII), which was conducted by the Korea Centers for Disease Control and Prevention (KCDC; currently Korea Disease Control and Prevention Agency). The KNHANE surveys began in 1998 and have been conducted annually since 2007. The survey comprises three parts: a health interview survey, a health examination, and a nutrition survey. The KNHANES in 2016 and 2017 were
exempted from the review by the Institutional Review Board of the KCDC. In 2018, KNHANES was conducted by obtaining the approval of the Research Ethics Review Committee of KCDC (2018-01-03- P-A).
About 24,269 individuals (8,150 in 2016, 8,127 in 2017, and 7,992 in 2018) completed this survey between 2016 and 2018. Among them, this study included women aged above 19 years. A total of 4,881 individuals aged below 19 years and 8,557 men were excluded.
Furthermore, 837 individuals with missing data in SRH and 4 respondents with marital status corresponding to “don’t know” and
“non-response” were eliminated. We considered the “don’t know”
and “non-response” answers concerning the menstruation status and type of insurance as missing data. Finally, 9,990 survey respondents were included in our analysis.
2. Self-rated health
The outcome variable in the present study was SRH, which was assessed using the question: “In normal times, how would you think about your health?” The responses included “very good”, “good”,
“fair”, “bad”, and “very bad”. In this analysis, SRH was dichotomized as “good SRH” (very good, good) and “poor SRH” (fair, poor, very poor). This dichotomization has been frequently used in previous studies [16,17].
3. Marital status and household type
Marital status was evaluated by the question “What is your current marital status?” and included five responses: married, separated, widowed, divorced, and never married. These responses were reclassified into three groups: “with spouse” (married), “no-spouse”
(separated, widowed, divorced), and “unmarried” [18]. The household type was divided into two groups: “one-person households” (living alone) versus “multi-person households” (living with someone including family, partner, friends, etc.). The combination of marital status and household type was categorized into six groups: “multi-person households with spouse”,
“multi-person households and no-spouse”, “multi-person households
and unmarried”, “one-person households with spouse”, “one-person
households and no-spouse”, and “one-person households and
unmarried”.
4. Covariates
The demographic and socioeconomic variables included age (19–
44, 45–64, and ≥65 years), education (elementary school or less, middle school, high school, college or more, and missing), household income indicated in quartile (Q1 [lowest], Q2, Q3, Q4 [highest], and missing), occupation (yes, no, and missing), type of insurance (self-employed insured, employee insured, medical-aid, and missing), menstruation status (fertile, infertile, and missing), waist circum- ference (<80 and ≥80) [19], sleep duration (<7, 7–8, and >8 hours), aerobic physical activity practice (yes, no, and missing), current smoking (yes, no, and missing), drinking (yes, no, and missing), and year (2016, 2017, and 2018). Chronic diseases such as hypertension, dyslipidemia, stroke, myocardial infarction, osteoarthritis, pulmonary tuberculosis, asthma, diabetes mellitus, thyroid dysfunction, cancers, atopic dermatitis, allergic rhinitis, and cataract were assessed according to whether the doctor made a diagnosis (0,1, and ≥2).
5. Statistical analysis
Statistical analysis included chi-square tests and multiple logistic regression analysis. Chi-square tests were performed to analyze the general characteristics of SRH. Multiple logistic regression analyses were used to investigate the relationship between poor SRH and risk
factors. The Wald test was used to examine the association between poor SRH and risk factors for categorical variables. Statistical analyses were performed using SAS ver. 9.4 (SAS Inc., Cary, NC, USA).
RESULTS
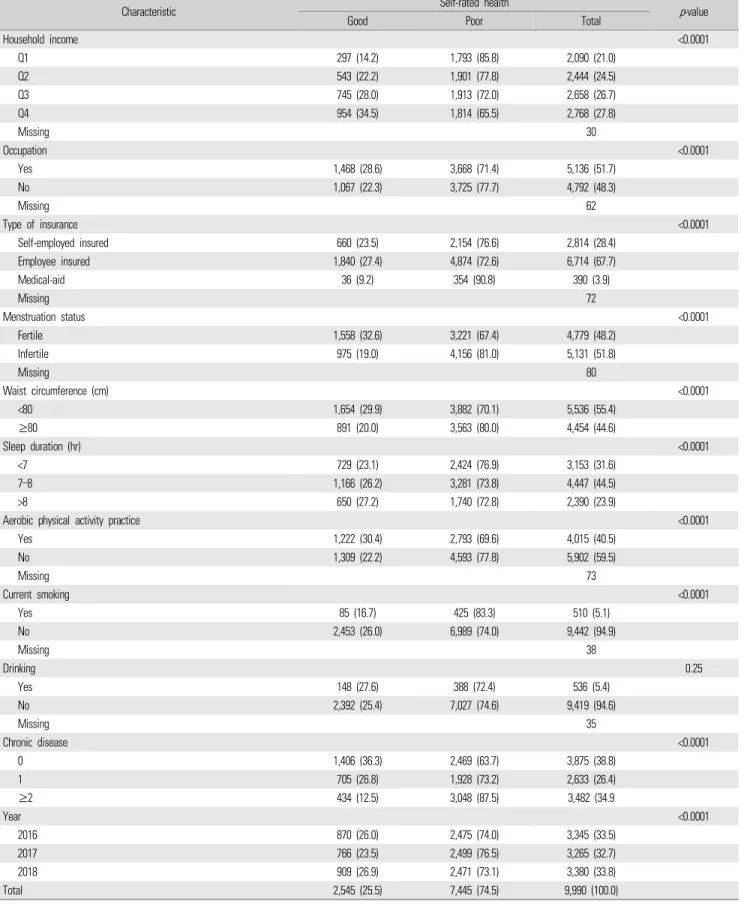
Of the total participants (n=9,990) in the study, 2,545 (25.5%) and 7,445 (74.5%) women had good and poor SRH, respectively. In poor SRH, one-person households and no-spouse women (87.6%) were higher than others. The proportion of women with poor SRH was almost equal among multi-person households and no-spouse women (77.5%) and one-person households and unmarried women (77.0%).
Poor SRH tended to be higher if the individual was older, had a low education level and low household income, no occupation, medical aid insurance, infertility, waist circumference ≥80 cm, less than 7 hours of sleep, no aerobic physical activity practice, current smoker, and had two or more chronic diseases (Table 1).
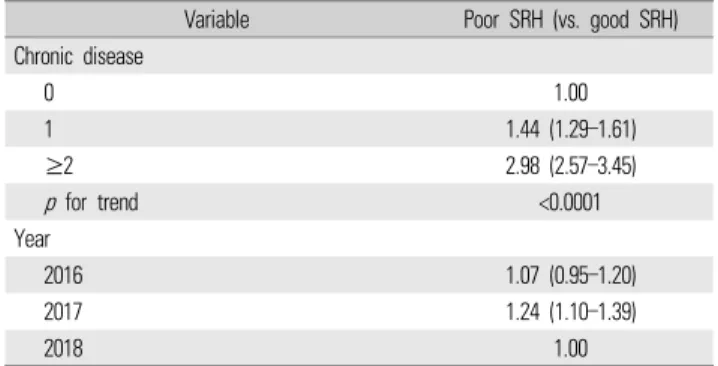
Table 2 lists the factors associated with poor SRH. The one-person households and unmarried women had the highest odds ratio (OR) of poor SRH (OR, 1.45; 95% confidence interval [CI], 1.03–2.05). On the other hand, multi-person households and no-spouse women were less
Characteristic Self-rated health
p-value
Good Poor Total
Household type & marital status <0.0001
Multi-person households with spouse 1,717 (26.3) 4,806 (73.7) 6,523 (65.3)
Multi-person households & no-spouse 219 (22.5) 756 (77.5) 975 (9.8)
Multi-person households & unmarried 400 (35.0) 743 (65.0) 1,143 (11.4)
One-person households with spouse 33 (26.8) 90 (73.2) 123 (1.2)
One-person households & no-spouse 125 (12.5) 879 (87.6) 1,004 (10.1)
One-person households & unmarried 51 (23.0) 171 (77.0) 222 (2.2)
Age group (yr) <0.0001
19–44 1,173 (34.5) 2,232 (65.6) 3,405 (34.1)
45–64 895 (24.7) 2,731 (75.3) 3,626 (36.3)
≥65 477 (16.1) 2,482 (83.9) 2,959 (29.6)
Education <0.0001
Elementary school or less 337 (13.2) 2,219 (86.8) 2,556 (25.8)
Middle school 165 (16.7) 823 (83.3) 988 (10.0)
High school 822 (27.4) 2,182 (72.6) 3,004 (30.3)
College or more 1,211 (35.9) 2,167 (64.2) 3,378 (34.0)
Missing 64
(Continued on next page)
Table 1. General characteristics of the study participants
Characteristic Self-rated health
p-value
Good Poor Total
Household income <0.0001
Q1 297 (14.2) 1,793 (85.8) 2,090 (21.0)
Q2 543 (22.2) 1,901 (77.8) 2,444 (24.5)
Q3 745 (28.0) 1,913 (72.0) 2,658 (26.7)
Q4 954 (34.5) 1,814 (65.5) 2,768 (27.8)
Missing 30
Occupation <0.0001
Yes 1,468 (28.6) 3,668 (71.4) 5,136 (51.7)
No 1,067 (22.3) 3,725 (77.7) 4,792 (48.3)
Missing 62
Type of insurance <0.0001
Self-employed insured 660 (23.5) 2,154 (76.6) 2,814 (28.4)
Employee insured 1,840 (27.4) 4,874 (72.6) 6,714 (67.7)
Medical-aid 36 (9.2) 354 (90.8) 390 (3.9)
Missing 72
Menstruation status <0.0001
Fertile 1,558 (32.6) 3,221 (67.4) 4,779 (48.2)
Infertile 975 (19.0) 4,156 (81.0) 5,131 (51.8)
Missing 80
Waist circumference (cm) <0.0001
<80 1,654 (29.9) 3,882 (70.1) 5,536 (55.4)
≥80 891 (20.0) 3,563 (80.0) 4,454 (44.6)
Sleep duration (hr) <0.0001
<7 729 (23.1) 2,424 (76.9) 3,153 (31.6)
7–8 1,166 (26.2) 3,281 (73.8) 4,447 (44.5)
>8 650 (27.2) 1,740 (72.8) 2,390 (23.9)
Aerobic physical activity practice <0.0001
Yes 1,222 (30.4) 2,793 (69.6) 4,015 (40.5)
No 1,309 (22.2) 4,593 (77.8) 5,902 (59.5)
Missing 73
Current smoking <0.0001
Yes 85 (16.7) 425 (83.3) 510 (5.1)
No 2,453 (26.0) 6,989 (74.0) 9,442 (94.9)
Missing 38
Drinking 0.25
Yes 148 (27.6) 388 (72.4) 536 (5.4)
No 2,392 (25.4) 7,027 (74.6) 9,419 (94.6)
Missing 35
Chronic disease <0.0001
0 1,406 (36.3) 2,469 (63.7) 3,875 (38.8)
1 705 (26.8) 1,928 (73.2) 2,633 (26.4)
≥2 434 (12.5) 3,048 (87.5) 3,482 (34.9
Year <0.0001
2016 870 (26.0) 2,475 (74.0) 3,345 (33.5)
2017 766 (23.5) 2,499 (76.5) 3,265 (32.7)
2018 909 (26.9) 2,471 (73.1) 3,380 (33.8)
Total 2,545 (25.5) 7,445 (74.5) 9,990 (100.0)
Values are presented as number (%).
Table 1. Continued
likely to have poor SRH compared to other groups (OR, 0.69; 95% CI, 0.58–0.83). The age group of 45–64 years (OR, 1.21; 95% CI, 1.03–1.41) had a higher risk of poor SRH. Compared to medical-aid insurance, self-employed (OR, 0.53; 95% CI, 0.36–0.78) and employee (OR, 0.52;
95% CI, 0.36–0.77) insurance were less likely to have poor SRH. The menstruation status of infertile women was higher in the poor SRH group than in the reference group (fertile) (OR, 1.22; 95% CI, 1.05–
1.43). Low education, low income, and two or more chronic diseases were associated with a high risk of poor SRH.
Subgroup analysis presents the relationship between poor SRH and the combination of household type and marital status stratified by socioeconomic status variables (Table 3). In college and higher educational level, women who were multi-person households and unmarried, and those who were one-person households and unmarried had a higher risk of poor SRH compared to those who were multi-person households and living with a spouse, respectively (women with multi-person household and unmarried: OR, 1.98; 95%
CI, 1.25–3.13; women with one-person household and unmarried:
OR, 1.28; 95% CI, 1.04–1.56).
DISCUSSION
The results of this analysis revealed the effects of the combination of marital status and household type on SRH among Korean women.
One-person households and unmarried women had the highest risk of
Variable Poor SRH (vs. good SRH)
Household type & marital status
Multi-person households with spouse 1.00
Multi-person households & no-spouse 0.69 (0.58–0.83) Multi-person households & unmarried 1.02 (0.87–1.19) One-person households with spouse 0.93 (0.61–1.43) One-person households & no-spouse 1.04 (0.82–1.31) One-person households & unmarried 1.45 (1.03–2.05) Age group (yr)
19–44 1.00
45–64 1.21 (1.03–1.41)
≥65 0.95 (0.78–1.17)
Education
Elementary school or less 2.09 (1.71–2.55)
Middle school 1.90 (1.54–2.35)
High school 1.27 (1.13–1.43)
College or more 1.00
p for trend <0.0001
Household income
Q1 1.42 (1.18–1.71)
Q2 1.36 (1.19–1.55)
Q3 1.22 (1.08–1.38)
Q4 1.00
p for trend <0.0001
Occupation
Yes 1.00
No 1.09 (0.99–1.20)
Type of insurance
Self-employed insured 0.53 (0.36–0.78)
Employee insured 0.52 (0.36–0.77)
Medical-aid 1.00
Menstruation status
Fertile 1.00
Infertile 1.22 (1.05–1.43)
Waist circumference (cm)
<80 1.08 (0.94–1.23)
≥80 1.05 (0.93–1.19)
Sleep duration (hr)
<7 1.08 (0.94–1.23)
7–8 1.05 (0.93–1.19)
>8 1.00
Aerobic physical activity practice
Yes 1.00
No 1.30 (1.18–1.43)
Current smoking
Yes 1.85 (1.43–2.39)
No 1.00
Drinking
Yes 0.97 (0.79–1.20)
No 1.00
(Continued on next page) Table 2. The association between poor SRH and the combination of household type and marital status
Variable Poor SRH (vs. good SRH)
Chronic disease
0 1.00
1 1.44 (1.29–1.61)
≥2 2.98 (2.57–3.45)
p for trend <0.0001
Year
2016 1.07 (0.95–1.20)
2017 1.24 (1.10–1.39)
2018 1.00
Values are presented as odds ratio (95% confidence interval). Adjusted for age group, education, household income, occupation, type of insurance, menstruation status, waist circumference, sleep duration, aerobic physical activity practice, current smoking, drinking, chronic disease, and year.
SRH, self-rated health.
Table 2. Continued
poor SRH, whereas multi-person households and no-spouse women had a lower risk of poor SRH compared to others. Additionally, we examined the trends in poor SRH according to risk factors among women with marital status and household type. Education and type of insurance were related to women’s poor SRH, depending on the marital status and household type.
Our findings demonstrated that 74.5% of the entire sample had poor SRH. Even though this study included only women, it was consistent with the findings of prior studies in which Korean women had higher levels of poor SRH than men [20]. It can also be observed in other countries [21,22]. Particularly, when comparing our results to those of the previous studies, the poor SRH was much higher. The poor SRH of previous studies only included “fair or poor SRH” or “poor or very poor SRH”. However, this study included “fair, poor, and very poor SRH” as poor SRH so the prevalence of SRH was much higher than previous research. Moreover, this study showed that various risk factors had a high prevalence of poor SRH than average prevalence, such as elderly (≥65 years old), lower educational level, low household income, medical aid, infertile status, and so forth.
Poor SRH was the highest risk among women who were in one-person households and unmarried. On the other hand, women
who were in multi-person households and no-spouse had a lower risk of poor SRH. In the relationship between household type and poor SRH, the results are consistent with previous studies that one-person households have a higher risk of poor SRH than multi-person households [7]. Particularly, these results are closely related to an increase in women’s health risk [23] and old age [24]. One-person individuals exhibit worse physical health status and health-promoting behaviors, including exercise and nutrition than multi-person individuals [6]. Moreover, poorer subjective stress levels, depression, and shorter sleep duration were associated with one-person households [24].
However, considering marital status, the results of unmarried women with a high risk of poor SRH and no-spouse women with a low risk of poor SRH are inconsistent with previous studies showing that no-spouse individuals had a higher risk of poor SRH [10]. Although marriage has been linked to health benefits [8], other studies have observed that marital happiness [25] or satisfaction [9] gaps in their marriage life cause more stress and unhealthy behaviors because of the poor psychological health of married people [25]. Moreover, married people tend to overestimate their health status. Consequently, they are unaware of their health problems until their actual health conditions
Variable
Poor SRH (vs. good SRH) Multi-person
households with spouse
Multi-person households &
no-spouse
Multi-person households &
unmarried
One-person households with
spouse
One-person households &
no-spouse
One-person households &
unmarried
p-value
*Age group (yr) 0.29
19–44 1.00 0.70 (0.40–1.22) 1.03 (0.87–1.21) 3.45 (0.78–15.36) 0.81 (0.14–4.77) 1.47 (1.01–2.16)
45–64 1.00 0.65 (0.49–0.85) 1.19 (0.50–2.86) 0.60 (0.35–1.01) 1.24 (0.79–1.94) 1.58 (0.59–4.28)
≥65 1.00 0.72 (0.55–0.96) 4.31 (0.53–34.73) 1.58 (0.58–4.29) 1.03 (0.77–1.38) 1.54 (0.33–7.32)
Education 0.01
Elementary school or less 1.00 0.69 (0.51–0.94) 0.34 (0.02–5.17) 1.09 (0.31–3.82) 0.95 (0.69–1.31) - Middle school 1.00 0.67 (0.39–1.15) 0.87 (0.15–5.03) 2.81 (0.35–22.71) 0.96 (0.53–1.74) 0.94 (0.11–8.19)
High school 1.00 0.66 (0.48–0.90) 0.69 (0.53–0.90) 0.51 (0.27–0.97) 1.69 (0.95–3.01) 0.79 (0.46–1.36)
College or more 1.00 0.57 (0.36–0.90) 1.28 (1.04–1.56) 1.44 (0.68–3.01) 1.15 (0.57–2.30) 1.98 (1.25–3.13)
Household income 0.29
Q1 1.00 0.62 (0.43–0.90) 0.85 (0.46–1.59) 3.63 (0.47–28.34) 1.17 (0.84–1.65) 0.99 (0.46–2.10)
Q2 1.00 1.17 (0.81–1.69) 1.04 (0.74–1.46) 0.81 (0.35–1.88) 0.97 (0.64–1.47) 1.27 (0.66–2.46)
Q3 1.00 0.54 (0.38–0.76) 1.05 (0.80–1.38) 0.77 (0.34–1.74) 0.70 (0.35–1.40) 1.89 (1.04–3.41)
Q4 1.00 0.52 (0.34–0.78) 1.00 (0.77–1.28) 0.87 (0.43–1.73) 1.53 (0.50–4.69) 1.90 (0.78–4.63)
Values are presented as odds ratio (95% confidence interval). Adjusted for occupation, type of insurance, menstruation status, waist circumference, sleep duration, aerobic physical activity practice, current smoking, drinking, chronic disease, and year, except for the stratum itself.
SRH, self-rated health.
*
![Table 2 lists the factors associated with poor SRH. The one-person households and unmarried women had the highest odds ratio (OR) of poor SRH (OR, 1.45; 95% confidence interval [CI], 1.03–2.05)](https://thumb-ap.123doks.com/thumbv2/123dokinfo/5442566.432475/3.918.91.829.732.1087/table-factors-associated-households-unmarried-highest-confidence-interval.webp)