Design of an Altitude Test Facility for Turbo Shaft Engine
Young-Hwan Choi, Sang-Joon Park, Joon-Won Lee, Chun-Taek Kim, Bong-Jun Cha, Iee-Ki Ahn AEROSPACE R&D CENTER - HANWHA Corporation
402-1 SINWOLRI SEONGGEEUP CHEONAN CHUNGNAM 330-835 KOREA
[email protected], [email protected], [email protected], [email protected] [email protected], [email protected] Keywords: : Altitude, Turbine Engine, Turbo Shaft Engine
Abstract
Gas turbine engine for aircraft are usually operated at the altitude condition which is quite different from the ground condition. In order to measure the precise performance data at the altitude condition, the engine should be tested at the altitude condition by a real flight test or an altitude simulation test with an altitude test facility. In this paper describes the design of altitude test facility for turbo shaft engine. This facility will be located in test cell #2 at the Korea Aerospace Research Institute. Test Cell #2 will be used for altitude testing engines with mass flow rate up to 40kg/s and inlet temperatures in the range from –65℃ to 200℃. The existing compressor/exhauster station with heater & cooler system will be used to simulate altitude conditions in Test Cell #2.
Introduction Purpose
The purpose of this paper is to specify the configuration, dimensions and aerodynamic performance of the KARI AETF Test Cell #2. Test cell #2 will be used for altitude testing engines with mass flow rate up to 40 kg/s and inlet temperatures in the range from -65°C to 200°C. The existing KARI compressor/exhauster station with heater & cooler systems will be used to simulate altitude conditions in test cell #2.
This paper introduces the design of test cell #2 aerodynamic elements including main venturi flowmeter, settling chamber, test chamber cooling, bleed, inlet particle separator systems, exhaust diffuser and others.
Test Cell #2 Aerodynamic System Flowmeter
Classical Venturi Tube (ISO STANDARD 5167- 4:2003) is used in the AETF Test Cell #2 as a flow meter to accurately measure the engine intake flow rate. The method of flow rate measurement by classical venturi tube is to measure static pressures in the upstream and throat sections of a venturi tube installed into a pipeline. The venturi tube has the lowest overall pressure losses, requires the lowest upstream/downstream straight lengths and provides the minimum pressure distortion of flow measuring devices. Venturi tube has the best repeatability and pressure recovery, due to the continuous geometry of the contraction, throat, and divergent sections.
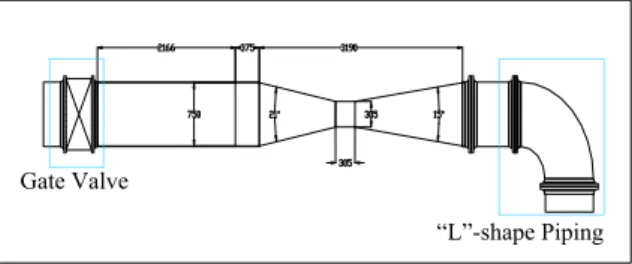
Fig. 1 Venturi Tube Shape
For the “L”-shape piping design the maximum available distance from the exit flange of ON/OFF gate valve to the venturi measuring section is L=2166 mm. The venturi upstream duct inside diameter is D=750mm. The maximum available L/D for this venturi is L/D=2.8. (see Fig.1)
Standard 5167-4:2003 specifies the required straight upstream lengths for the classical venturi tubes installed after various fitting. The required straight lengths for fully open gate valve are depicted in the Table.1.
To provide flow measurements with “zero additional uncertainty” the straight upstream length should be more than in column A. For the available upstream straight length of 2.8 the maximum diameter ratio is 0.4 (see Table.1), which correspond to the maximum throat diameter of approximately d=304.8 mm.
Without calibration the ASME and ISO 5167- 4:2003 Standard predictions for discharge coefficient accuracy are ±1.5% of reading. Venturi calibrations traceable to NIST in conjunction with standard instrumentation packages allow for a relative uncertainty of discharge coefficient ±0.5% of reading.
For downstream straight lengths, fitting or other disturbances situated at least four throat diameters downstream of the throat pressure tapping plane do not effect the accuracy of the measurement.
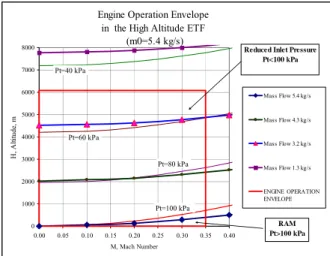
The engine operating range, in co-ordinates (H, M), is depicted on Fig. 2. The maximum Mach number for all engine flying modes is of 0.35 only, and the maximum altitude is of 20,000 ft.
Table.1 Required Straight Length For Classical Venturi Tubes Installed After Gate Valve Diameter
Ratio β = d/D
A Zero additional
uncertainty
B 0.5% additional
uncertainty
0.3 2.5 Not Available
0.4 2.5 Not Available
0.5 3.5 2.5
Gate Valve
“L”-shape Piping
Engine Operation Envelope in the High Altitude ETF
(m0=5.4 kg/s)
0 1000 2000 3000 4000 5000 6000 7000 8000
0.00 0.05 0.10 0.15 0.20 0.25 0.30 0.35 0.40
M, Mach Number
H, Altitude, m
Mass Flow 5.4 kg/s Mass Flow 4.3 kg/s Mass Flow 3.2 kg/s Mass Flow 1.3 kg/s
ENGINE OPERATION ENVELOPE Pt=40 kPa
Pt=60 kPa
Pt=80 kPa
Pt=100 kPa
Reduced Inlet Pressure Pt<100 kPa
RAM Pt>100 kPa
Fig .2 Engine Operating Envelop in Co-ordinates Mach Number & Altitude
The comparison of engine and classical venturi envelopes for different air temperatures are depicted on Fig. 3.
The venturi operation envelop (blue envelop) with minimum and maximum venturi delta-P of 100Pa and 3000Pa completely covers the engine operation envelop (red envelop). Based on these data, the venturi delta-P transducer should be in the range of 100Pa to 3000Pa and has an accuracy, which will satisfy total flow rate accuracy of ±0.8%. The venturi intake pressure transducer should be in the range of 35kPa (absolute) to 130 kPa (absolute).
Settling Chamber
The settling chamber is used to reduce velocity &
pressure distortions and intake airflow turbulence in the engine inlet duct.
The settling chamber design criteria is depicted in Table. 2.
The settling chamber is installed in the front of the engine bellmouth.
The settling chamber is consists of first flow screen, second flow screen, honeycomb, cylindrical body and bellmouth coupling flange. (See Fig. 4)
ENGINE AND CLASSICAL VENTURI OPERATION ENVELOPES
(D1=0.75m, d=0.305m, d/D=0.406, T=20C to 65C)
30 40 50 60 70 80 90 100 110 120 130
0.0 1.0 2.0 3.0 4.0 5.0 6.0 7.0 8.0
Mass Flow Rate, kg/s
Inlet Total Pressure, kPa
Engine Operation Envelope
Venturi Operetion Envelop delta-P= 100 Pa
delta-P= 3000 Pa
Fig .3 Engine & Venturi Operation Envelopes for Hot Air Temperatures of T = 20°C to 65°C
Table. 2 Settling Chamber Design Criteria
Unit Design Criteria
Pressure kPa 30 ~ 400 (abs)
Temperature °C -65 ~ 200
Mass Flow Rate kg/s 0 ~ 40
The requirements of total pressure distortion, velocity distortion and turbulence for settling chamber are depicted in the Table. 3.
The total pressure distortion index,
avg t
t t
P P P Pmax− min
δ = (1) in the engine bellmouth to meet engine manufacture’s specifications for performance testing, must be
% 15 .
<0
δP .
The velocity distortion index,
Vavg
V V Vmax− min
δ = (2) in the settling chamber measuring section corresponds to the total pressure distortion index in the same section.
For the engine mass flow rate of 10 kg/s at standard atmospheric conditions of P=101,325Pa, T=288K, the settling chamber velocity is Vavg =10.5m/s (Mach numberM =0.031). The velocity distortion in the settling chamber can be up to 100% and still satisfy the pressure distortion requirement.
For the engine mass flow rate of 40 kg/s, intake pressure of 200kPa and temperature of 200°C, the settling chamber velocity shall be Vavg =35.5m/s (Mach numberM =0.080).
The total pressure distortion index in the settling chamber will satisfy requirement δP<0.15% for all operation points if the velocity distortion index in the settling chamber below 15.0%.
Six total pressure and six temperature probes shall be installed in the settling chamber to monitor and control the pressure and temperature in the engine intake duct. The pressure and temperature probes can be easily approached through the rear end of the settling chamber.
The piping networks upstream of the settling chamber and settling chamber itself shall be insulated
Fig .4 Settling Chamber Configuration
Table. 3 Settling Chamber Operation Points and Design Requirements
Division Variables Unit Value Operation
Points
Mass Flow Rate kg/s 10 Temperature °C 15 Total Pressure kPa 100
Design Requirements
Total Pressure
Distortion % <0.15 Velocity Distortion % 15
Turbulence % <5
to prevent heat losses and to reduce the temperature distortion at the engine inlet.
The settling chamber performance was calculated using CFD ANSYS CFX-10 software.
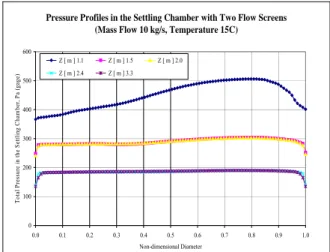
The results of the CFD analyses of settling chamber with two flow screens are depicted on Fig. 5 and Fig.
6. (Mass flow 10 kg/s, Temperature 15 °C)
There is a boundary layer on the settling chamber walls. Although the velocity and pressure drops in the boundary layer (where the non-dimensional diameter closes to 0 or 1.0), it has no influence on the velocity and pressure distortion indexes. The velocity and pressure distortion calculations include only velocity and pressure in the flow core outside boundary layer and do not include velocity and pressure in the boundary layer.
Results of CFD analyses show that pressure distortions in the settling chamber measuring section with two and three flow screens (0.012% & 0.004%
respectively) for the design point #2 are significantly lower than the maximum allowable pressure distortion of 0.15%.(see Table.4)
The velocity distortions and turbulence in both cases are also significantly below the upper limit.
The results of CFD analyses that two flow screens settling chamber (first – perforated plate, second – mesh) is sufficient to provide required quality of the air flow in the settling chamber with pressure distortion less than 0.15%, velocity distortion less than 15% and turbulence less than 5%. The third mesh screen can be installed in the settling chamber to
Fig. 5 Settling Chamber Velocity Contours
Pressure Profiles in the Settling Chamber with Two Flow Screens (Mass Flow 10 kg/s, Temperature 15C)
0 100 200 300 400 500 600
0.0 0.1 0.2 0.3 0.4 0.5 0.6 0.7 0.8 0.9 1.0
Non-dimensional Diameter
Total Pressure in the Settling Chamber, Pa (gage)
Z [ m ] 1.1 Z [ m ] 1.5 Z [ m ] 2.0 Z [ m ] 2.4 Z [ m ] 3.3
Fig .6 Settling Chamber Pressure Profiles satisfy the requirements of a very uniform flow with velocity distortion less than 10%.
Exhaust Diffuser-Ejector
Exhaust diffuser-ejector is used to direct the engine exhaust gas to the exhaust cooler, to recover the exhaust gas static pressure and to reduce exhaust gas temperature by mixing exhaust gas with test cell cooling air flow.
Calculations of the exhaust diffuser-ejector performance were done according to standard method of aerodynamic calculation for a high altitude test cell.
Empirical coefficients used in the applied mathematical model have been obtained during tests of aerodynamic models and full scale test cells.
The static pressure around the engine nozzle depends on the distance Ln between engine nozzle and exhaust diffuser-ejector. When spacing ratio Ln / Dn
Table. 4 Comparison of the Settling Chamber Performance with Two and Three Flow Screens for
Design Point #2 Unit Two Flow
Screen Three Flow Screen Mass Flow Rate kg/s 10 10
Temperature °C 15 15
Total Pressure in the Measuring
Section
kPa 101.3 101.3
Velocity m/s 10.5 10.5 Total Pressure
Distortion % 0.012 0.004 Settling
Chamber Total Pressure Loss
Pa 313 420
Velocity
Distortion % 9.9 3.5
Turbulence % 2.1 2.1
Pressure
Loss Coefficient N/A 1.5 2.0
is more than 1.0, the static pressure around nozzle is equal to test chamber static pressure. Static pressure around the nozzle is significantly less than test chamber static pressure for spacing ratio of
5 . 0 / n <
n D
L
.
The optimum distance from the engine nozzle to the exhaust diffuser varies with the test cell bypass ratio.
Increasing this distance increases the induced bypass airflow. When the bypass flow exceeds the exhaust system capacity, re-circulation occurs at the diffuser- ejector inlet. The intensive air/exhaust gas re- circulation can be expected for the test cell bypass ratio of 0.15 when spacing ratio greater than 1.0. On the other hand, spacing ratio should not be less than 0.5 for any test cell bypass ratios because of intensive static pressure fall at the exhaust diffuser inlet.
In order to control the spacing ratio Ln / Dn and static pressure around the engine nozzle, the diffuser- ejector shall have a movable telescopic inlet section which will allow placing the diffuser entrance in the range of Ln / Dn = 0.4 toLn / Dn = 1.2 . For the diffuser-ejector inlet diameter of approximately
mm
Dn = 500 the minimum and maximum distances from the engine nozzle to the diffuser flare plane should be 200mm & 600mm, respectively.
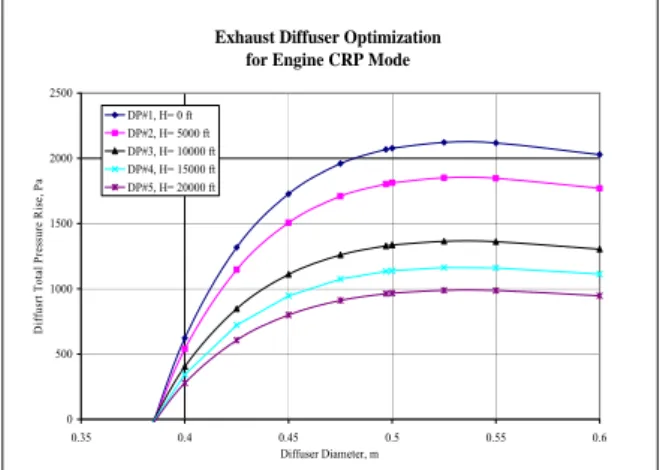
Results of diffuser-ejector calculations are depicted on the Fig. 7. The maximum pressure rise in the ejector occurs at diffuser diameter in the range from 500 mm to 550mm. A standard Ø20" duct with wall thickness of 0.218" has an optimum diffuser ID diameter of Ø497mm.
Fortunately, the diffuser-ejector diameter of Ø497mm is optimal for all attitudes and for all engine modes – the diffuser diameter is minimal with a maximum pressure rise. For the maximum CRP engine mode the pressure rise in the diffuser-ejector is approximately 2.0 kPa.
The downstream flare part of exhaust diffuser- ejector has a total cone angle of 14° and an exit ID of approximately Ø750mm.
The maximum exhaust gas temperature reduces due to mixing with the cooling air from 673°C in the engine nozzle to the average temperature of 599°C in the diffuser for the tested engine.
The minimum exhaust air temperature occurs in the diffuser-ejector during cold soaking test. The cold air with temperature of -65°C and flow rate up to 0.4 kg/s will be passed inside of the engine, and also will wash outside of the engine. This cold air flows from inside and outside of the engine will be directed to the diffuser. In diffuser-ejector the cold air (-65°C) will be mixed with warm cooling air flow with temperature approximately of 20°C to the mixed temperature not less thantmix = −20 0C . The mixing cold air with warm cooling air will prevent deep cooling of the diffuser downstream system, which includes augmenter tube, water spray system, exhaust throttle valve and ducting.
Exhaust Diffuser Optimization for Engine CRP Mode
0 500 1000 1500 2000 2500
0.35 0.4 0.45 0.5 0.55 0.6
Diffuser Diameter, m
Diffusrt Total Pressure Rise, Pa
DP#1, H= 0 ft DP#2, H= 5000 ft DP#3, H= 10000 ft DP#4, H= 15000 ft DP#5, H= 20000 ft
Fig. 7 Exhaust Diffuser-Ejector Performance at CRP Engine Mode
The maximum exhaust gas velocity for tested engine in the diffuser cylindrical part is of 72m/s. The maximum velocity at diffuser flare exit is of 32 m/s.
The minimum and maximum static pressure at the exhaust diffuser exit for tested engine are 47.2kPa (a) and 103.4kPa (a), respectively.
At sea level conditions the engine intake pressure and temperature are close to the ambient and test chamber static pressure close to the ambient.
The result of aerodynamic analyze that the test cell
#2 exhaust system will be used the optimized diffuser- ejector (Ø 497 mm), the existing the test cell #1 sea level exhaust stack and silencer for all engine mode at altitude H=0.
Test Chamber Cooling
The test chamber cooling system is used to ventilate test chamber, to prevent hot or cold air flow recirculation inside of the test chamber, to reduce the engine exhaust gas temperature by mixing in the diffuser-ejector, or to increase exhaust air temperature in diffuser during cold soaking test.
The cooling system sketches are depicted on Fig. 8.
Cooling system requirements for ground level and altitude conditions are depicted in the Table. 5.
Classical venturi tube is used in the AETF test cell
#2 as a cooling air flow meter to accurately measure the cooling flow rate.
Venturi for the cooling flow has inlet diameter of mm
D=200 and Venturi throat diameter of d=100mm . Venturi diameter ratio isβ =d/D=0.5. According to the ISO STANDARD the required minimum upstream length is 10.
Table.5 Cooling System Requirements Unit Design Requirements Cooling Air Mass
Flow Rate kg/s 0.1 to 4.0 Temperature °C -20 to +35 Total Pressure kPa 30 to 103 Test Chamber
Pressure kPa 30 to 102
Fig .8 Test Chamber Cooling System Inlet Particle Separator System
Inlet particle separator system is used to direct the air flow from engine inlet particle separator to the exhaust system and to measure the flow rate.
The inlet particle separator mass flow measuring system was optimized using five design points for different altitudes from 0 ft to 20,000 ft and at all engine testing modes.
The test chamber IPS system is depicted on Fig. 9.
The inlet particle separator system consists of a:
- Coupling flange to connect particle separator system to the engine particle separator blower flange - FCS controlled or manual ON/OFF valve - Transition section
- Classical Venturi - Venturi downstream
- Particle separator system to the test chamber exhaust For mach numbers in the range of 0.0 to 0.2 the engine inlet pressure is approximately equal to the altitude pressure at the diffuser exit. The IPS system exit is connected to the flange, where pressure is equal to the diffuser exit pressure. The pressure difference between the engine inlet pressure and IPS exit pressure (without IPS blower) is very low and can’t compensate pressure loss in the IPS system. The IPS blower is installed on the engine to provide required pressure to compensate pressure loss. The required pressures rises in the IPS blower were calculated for all engine modes and all altitudes since
SECTION A-A IPS TOP VIEW
SECTION B-B IPS SIDE VIEW
Fig .9 Test Chamber Inlet Particle Separator System
SECTION A-A RIGHT HAND EXHAUST
SECTION B-B RIGHT HAND EXHAUST
Fig .10 Bleed Line for R/H Exhaust
the actual performances of the IPS blower are not known.
Bleed System
Bleed lines are used to direct the engine bleed air flow to the exhaust cooler and to measure bleeds mass flow rate.
Bleed lines are used to direct the engine bleed air flow to the exhaust cooler and to measure bleeds mass flow rate.
The tested engine has two bleed lines, one for L/H (left hand) and one for R/H (right hand) engines.
These lines are identical and located symmetrically to the engine axial vertical plane. Each L/H or R/H engine has only one bleed line. Fig. 10 is showed bleed line for R/H exhaust sketches.
Each bleed line consists of a:
- Coupling flange to connect bleed line to the engine bleed flange
- FCS controlled ON/OFF valve - Transition section
- Classical Venturi - Venturi downstream duct - FCS control valve
- Bleed exhaust to the test chamber exhaust Exhaust Valve and Exhaust Ducting
Exhaust valve is used to control the engine backpressure and the test chamber pressure.
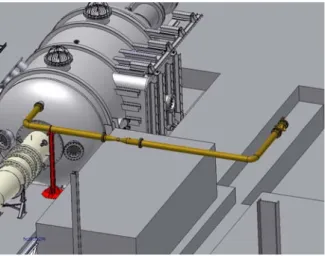
Exhaust valve is installed downstream of the exhaust gas spray cooler (see Fig .11). During altitude tests the exhaust gas temperature downstream of the cooler will not exceed 35°C (because of the exhaust compressor inlet temperature limitation). For the ground level engine tests the exhaust gas will be directed to the exhaust stack and there is no limitation for temperature. The maximum expected exhaust gas temperature in the exhaust duct downstream of the spray cooler is of 100°C.
The available distance from the flex joint to the exhaust collector axis is only 2.2m. On this length it is necessary to arrange the exhaust throttle valve Ø500mm diameter, diffuser from Ø500mm diameter to Ø750mm diameter and exhaust elbow with duct diameter of Ø750mm. The maximum available radius of the elbow curvature is approximately 560mm,
Fig. 11 Exhaust System with Throttle Valve, Diffuser
& Short Elbow
which is less than diameter of the duct of Ø750mm.
This “short” elbow has relative curvature radius of 0.75. The typical recommended relative curvature radius in the “long” elbows is about 1.5. The CFD analyses were performed in the “short” and “long”
elbows to calculate and compare the aerodynamic performance (pressure loss, pressure & velocity distortion, and turbulence) in the ducts downstream of the elbows.
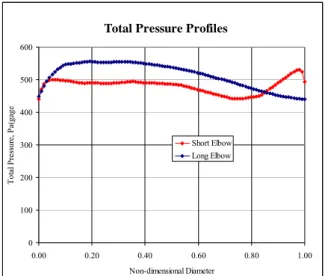
The results of CFD analyses are depicted on Fig .12 to 14. For the “short” and “long” elbows the combined pressure loss coefficients (including butterfly valve, diffuser and elbow) and turbulence are approximately equal. The pressure loss coefficient is of approximately 0.5 and turbulence is of 10%. The pressure and velocity distortions 4m downstream of the “short” elbow are approximately 0.13% and 33%, respectively. The pressure and velocity distortions downstream of the “long” elbow are approximately
Total Pressure Profiles
0 100 200 300 400 500 600
0.00 0.20 0.40 0.60 0.80 1.00
Non-dimensional Diameter
Total Pressure, Pa(gage)
Short Elbow Long Elbow
Fig. 12 Total Pressure Profiles Downstream Exhaust Elbow
Fig. 13 Velocity Vectors in Short Elbow
Fig 14 Velocity Vectors in Long Elbow 16% to 36%, which is even slightly more than for the
“short” elbow.
Pressure and velocity profiles are presented using non-dimensional diameter D
D = X
, where D is exhaust duct diameter of 750mm, X is the distance from the wall in the direction of x-axis.
The conclusion based on the results of CFD analyses is: the “short” elbow with curvature radius of 560 mm can be successfully used in the exhaust system. The combined pressure loss coefficient for this system including full open backpressure valve, short diffuser & short elbow will be approximately 0.5 with respect of the exhaust gas velocity in the duct of Ø500mm diameter.
The total pressure loss in the exhaust system with short elbow and for mass flow rate of 6.4 kg/s shall be approximately 250 Pa. For the mass flow rate of 10 kg/s the total pressure loss shall be 600 Pa.
Bypass System
AETF has two bypass lines to control engine intake flow rate
- The first main bypass (vent) line has duct diameter of 750 mm, the pressure control valve diameter of 350
mm and vent silencer diameter of 400 mm. This vent line is installed upstream of the air AETF cooler/heater. The air flow from the compressor can be released to atmosphere through this bypass (vent) line with the maximum compressor flow rate of 40 kg/s. This bypass line has large discharge capacity due to the large diameters of all components.
- The second bypass line has diameter of 200 mm with pressure control valve diameter of 100 mm. This bypass line is installed downstream of cooler/heater and close to the engine intake. This line is used to fine control of air intake flow rate by releasing air flow from the intake duct to the exhaust duct. The additional line diameter of 75 mm with temperature control valve diameter of 50 mm is used to control bypass flow exit temperature.
The main bypass (vent) line 750 mm diameter is used during engine start and for stationary modes.
This line can not be used for transient modes with the constant air inlet temperature. It is difficult to maintain or control temperature at the engine intake when the flow rate through the cooler/heater is not constant.
The second bypass line is located downstream of the cooler/heater and the total mass flow rate through the cooler/heater is approximately constant during the engine transient mode with this bypass line operation.
This bypass line is preferable for the transient modes with the constant engine intake total pressure and temperature.
The second bypass line will be used to control engine mass flow rate during transient mode without change of total pressure and temperature. The following transient modes are used to calculate bypass line performance and to define required modifications
- Transient Operation form Ground Idle to CRP mode (maximum power) at Mach M=0 and altitudes of H=0ft, 5,000ft and 10,000ft in one second.
- Transient Operation form Flight Idle to CRP mode (maximum power) at Mach M=0.1, 0.2, 0.3, 0.35 and altitudes of H=0ft, 5,000ft, 10,000ft, 15,000ft and 20,000ft in one second
Before the start of the transient mode the engine inlet mass flow rate, total pressure and temperature are equal to the parameters at start of the transient mode.
The mass flow rate downstream of the inlet main air pressure control valve will be setup equal to the mass flow rate at the end of the transient mode. The difference between the mass flow rate downstream of the inlet main air pressure control valve and engine inlet mass flow rate is the bypass mass flow rate through bypass line. During transient mode (2 to 5 second duration) the engine mass flow rate increases/decreases from the mass flow rate at the start of transient mode to the mass flow rate at the end of the transient mode. At the same time bypass flow rate decreases/increases by the same value. In this case, the total mass flow rate through compressor/exhauster is constant, the operation point is kept the same position on the compressor/exhauster map and the engine inlet pressures and temperatures are constant during the transient mode.
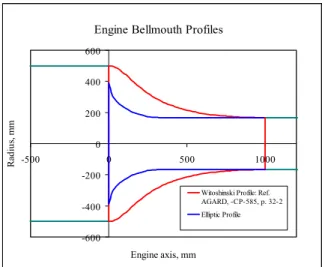
Engine Bellmouth Profiles
-600 -400 -200 0 200 400 600
-500 0 500 1000
Engine axis, mm
Radius, mm
Witoshinski Profile: Ref.
AGARD, -CP-585, p. 32-2 Elliptic Profile
Fig. 15 Engine Bellmouth Profiles Engine Bellmouth
Engine bellmouth is used to smoothly accelerate airflow, to reduce velocity distortion and turbulence levels in the engine inlet duct.
Engine bellmouth design criteria is showed at Table .6
The design of the engine bellmouth is directed mainly to avoidance of separation, to reduce boundary layer thickness and to producing the exit velocity profile with low velocity distortion index and low turbulence (ΔV < 1%, ε < 1% ).
Turbulence is calculated
u kt
ε = (3) u : x component velocity,
kt : turbulence kinetic energy
avg
t u
k = ( ′2) (4)
The aerodynamic performance of two geometrical profiles – Witoshinski Profile and Elliptic Profile were calculated using CFD ANSYS CFX-10.
Table. 6 Engine Bellmouth Design Criteria
Unit Design Criteria
Pressure kPa
(abs) 30 to 120 Temperature °C -65 to +65 Mass Flow Rate kg/s 0 to 10 Bellmouth Inlet
Diameter mm 1000
Bellmouth Exit
Diameter mm 334.0 ±1.5 Total Pressure
Distortion % < 0.15
Velocity Distortion % < 0.2 Turbulence % < 0.5
Fig. 16 Velocity Vectors at Elliptic Bellmouth Entrance
Fig. 17 Velocity Vectors at Witoshinski Bellmouth Entrance
Elliptic Profile is used in the venturi nozzles (see Fig. 15). This bellmouth is simpler and easier to manufacture. The length of the curvilinear part of the engine bellmouth L1 is equals the bellmouth exit diameterL1 = D2 = 2 R⋅ 2 .
The aerodynamic performance of both bellmouths were compared using the same overall bellmouth dimensions L= D1=1000 mm, D2 =334mm .
Upon entering the contraction section of the engine bellmouth, the flow begins to accelerate on the average, but locally close to the wall velocity decelerates due to the adverse pressure gradient along the wall.
The adverse pressure gradient (150 Pa/m) combined with large boundary layer displacement thickness (14.0mm) and low boundary layer external velocity (8.1 m/s) causes flow separation near the entrance of the Elliptic bellmouth (separation point located 172 mm upstream of the bellmouth entrance) as can be seen on Fig. 16.
The separation criterion is calculated dx
dp u
0 0 0
*
⋅ ⋅
= ρ
ζ δ (5)
δ* : displacement thickness,
Velocity Profiles 50 mm Upstream of the Engine Bellmouth
-5.0 0.0 5.0 10.0 15.0 20.0 25.0 30.0
-0.5 -0.4 -0.3 -0.2 -0.1 0.0 0.1 0.2 0.3 0.4 0.5
Non-dimensional Distance from the Axis, y/D2
Velocity Vx, m/s
Witoshinski1 Witoshinski2 Elliptic1 Elliptic2
Fig. 18 Velocity Profiles 50 mm Upstream Bellmouth Entrance
dx
dp0 : static pressure gradient along the wall u0 : flow velocity at y =δ
ρ : density
The flow separation criterion in this point is equal to ζ = 0.026 , which is exceeding separation criteria critical value ofζ critical = 0.014 .
For Witoshinski profile the boundary layer displacement thickness is much less (6.2mm) and the boundary layer external velocity is larger (8.9 m/s).
The flow separation criterion for Witoshinski profile is equal toξ = 0.0098 , which is less than separation criteria critical value ofζcritical = 0.014 . There is no flow separation at the entrance of Witoshinski profile as can be seen on Fig. 17.
The axial velocities profiles 50 mm upstream of the bellmouth entrance are depicted on Fig. 18.
The axial velocities close to the walls in Elliptic bellmouth are negative, indicating flow recirculation and boundary layer separation. The axial velocities in Witoshinski bellmouth are positive everywhere, indicating no boundary layer separation.
Flow separation in Elliptic bellmouth is the main reason of significantly thicker boundary layer (see Table. 7) at the exit of Elliptic bellmouth (16.6mm) with comparison to Witoshinski bellmouth (10.8 mm).
Consequently, the displacement & boundary layer momentum thicknesses for Witoshinski bellmouth are less than for Elliptic bellmouth.
The conclusion based on results of CFD analyses is:
the engine bellmouth with Witoshinski profile satisfies all aerodynamic design criteria and it can be used in KARI AETF Test Cell #2. The engine bellmouth with Elliptic profile has points with flow separation and, therefore, significantly larger boundary layer, pressure distortion and level of turbulence at the exit of bellmouth.
Seperation Point
To provide uniform pressure and velocity profiles with low turbulence in front of engine the engine
Table. 7 Comparison Aerodynamic Performance of Witoshinski and Elliptic Engine Bellmouths at the
Exit Plane Unit Witoshinski
Profile Elliptic Profile Contraction
Ratio N/A 9.0 9.0
Flow
Separation N/A No Yes
Boundary Layer
Thickness mm 10.8 16.6
Displacement
Thickness mm 1.2 2.1
Velocity
Distortion % 0.13 0.88
Total Pressure
Distortion % 0.015 0.11
Turbulence % 0.44 0.6
bellmouth with Witoshinski profile should be used at the exit of settling chamber.
Conclusion
The aerodynamic configurations and dimensions of aerodynamic systems including main venturi flowmeter, settling chamber with engine bellmouth, test chamber test chamber cooling system, bleed &
inlet particle separator systems, exhaust diffuser of AETF Test Cell #2 are developed, the aerodynamic performance characteristics of these systems are specified for engines testing.
The aerodynamic performance characteristics of the main venturi, settling chamber and test chamber cooling system are specified for future engines testing with mass flow rate up to 40 kg/s.
KARI AETF Cell #2 will be completed in course of this year.
Acknowledgement
This study has been supported by the KARI under KHP Dual-Use Component Development Program funded by the MOCIE.
References
1) Lee, J. K., Kim, C. T., Yang, S. S., Lee. D. S.:
Altitude Engine Test, Journal of the Korean Society of Propulsion Engineers, 9(4), 2005, pp.104-111.
2) Abdelwahab. M, Moore, A. S., Soeder, R. H., Sorge, R. H., and Delroso, R.: Design, Installation, and Evaluation of an Altitude Test Facility Modification, NASA/TM-97-206323, 1998.
3) Measuring of Fluid Flow by means of Pressure Differential Devices Inserted in Circular Cross- Section Conduits Running Full Part 4 : Venturi Tubes, ISO 5167-4:2003(E
)
, 2003.4) Hyeon. Y. Y. : A study on the system test methods for aero-gas turbine engines, Korea Aerospace Research Institute 97-NA-01-01-A-18, 1998.