나이관련황반변성 관련요인: 국민건강영양조사 2008-2012
Factors Associated with Age-related Macular Degeneration: The Korea National Health and Nutrition Examination Survey 2008-2012
임형택1, 강세웅2, 신재필3, 유승영4, 송수정5, 이승규1, 김성수1; 대한안과학회 역학조사위원회
Tyler Hyungtaek Rim
1, Se Woong Kang
2, Jae Pil Shin
3, Seung-Young Yu
4, Su Jeong Song
5, Christopher Seungkyu Lee
1, Sung Soo Kim
1; on behalf of the Epidemiologic Survey Committee of the Korean Ophthalmological Society
1연세대학교 의과대학 안과학교실 시기능개발연구소, 2성균관대학교 의과대학 삼성서울병원 안과학교실,
3경북대학교 의과대학 안과학교실, 4경희대학교 의과대학 안과학교실, 5성균관대학교 의과대학 강북삼성병원 안과학교실
1
The Institute of Vision Research, Department of Ophthalmology, Yonsei University College of Medicine, Seoul, Korea
2
Department of Ophthalmology, Samsung Medical Center, Sungkyunkwan University School of Medicine, Seoul, Korea
3
Department of Ophthalmology, School of Medicine, Kyungpook National University, Deagu, Korea
4
Department of Ophthalmology, Kyung Hee University School of Medicine, Seoul, Korea
5
Department of Ophthalmology, Kangbuk Samsung Hospital, Sungkyunkwan University School of Medicine, Seoul, Korea
Purpose: To evaluate the associations between early/late age-related macular degeneration (AMD) and systemic and ocular parameters
using national population-based data.Methods: From 2008 to 2012, a total of 16,897 participants of the Korea National Health and Nutrition Examination Survey underwent
ophthalmologic examinations by the Korean Ophthalmological Society. Cases of early and late (neovascular and geographic atrophy) AMD were identified using digital fundus images. Risk factors were identified using logistic regression.Results: Age-standardized prevalence of early and late AMD among subjects aged 40 years and older was 5.5% and 0.6%, respectively.
Increasing age was the most significant risk factor for both early and late AMD (adjusted odds ratio [aOR]: 1.09, 95% confidence interval [CI]; 1.07–1.10; aOR: 1.14, 95% CI: 1.10−1.19, respectively). Patients who slept, on average, more than nine hours per day (aOR: 0.68, 95% CI:
0.47−1.00) and who were in the lowest quintile (≤ 38.21 g/dL) of high-density lipoprotein (HDL) cholesterol (aOR: 0.68, 95% CI: 0.51−0.92) were significantly associated with a lower prevalence of early AMD. Increasing spherical equivalent (SE) [aOR: 0.53 of the first quintile of SE ≤ -1.38 diopters (D), 95% CI: 0.35−0.78; aOR: 1.41 of the fifth quintile of SE ≥ +0.69 D, 95% CI: 1.07−1.86] was associated with a higher prevalence of early AMD. Lower quartile of systolic blood pressure (≤ 110.0 mmHg) was associated with a lower prevalence of neovascu- lar AMD (aOR: 0.25, 95% CI: 0.09−0.67).
Conclusions: Aging was the most significant risk factor for both early and late AMD. Lower level of HDL cholesterol, longer duration of
sleep, and myopia had protective associations with early AMD, while lower systolic blood pressure had a protective association with neo- vascular AMD.Keywords: Age-related macular degeneration; Epidemiology; Risk factor
Address reprint requests to Sung Soo Kim, MD, PhD
The Institute of Vision Research, Department of Ophthalmology, Severance Hospital, Yonsei University College of Medicine, #50-1 Yonsei-ro, Seodaemun-gu, Seoul 03722, Korea
Tel: 82-2-2228-3570, Fax: 82-2-312-0541 E-mail: [email protected]
Received: 2017. 9. 21
Revised: 2018. 1. 8
Accepted: 2018. 1. 16
Introduction
There are currently insufficient data to determine whether the prevalence and incidence of age-related macular degener- ation (AMD) differ among different ethnic groups at varying or within the same geographic locations [1]. The Baltimore Eye Survey showed that more severe forms of early AMD and late AMD are more prevalent in whites compared to blacks [2]. However, the National Health and Nutrition Sur- vey (NHANES) III reported that, among subjects aged 40 to 59 years, the prevalence of AMD was actually higher in blacks than in whites [3]. Furthermore, AMD was generally thought to be less frequently found in Asian populations, based on earlier hospital-based observational studies, but a recent systematic review reported that the pooled prevalence estimates of early and late AMD were 6.8% and 0.56%, re- spectively, in Asian populations aged 40 to 79 years, which are comparable to those of the 8.8% and 0.59% found in corresponding prevalence estimates in white populations [4]. However, the epidemiological study of AMD in Asians is still limited, and prevalence data vary among Asian coun- tries or even within the same country [5-9]. In addition, age and smoking have been found to be significant risk factors for AMD [5,6,8-15]. Furthermore, studies involving other risk factors such as drinking, hyperopia, hypertension, and cataract have reported conflicting results [5,7,9,11,13,14].
Several previous studies reported the prevalence of early and late AMD in the Korea population using different time periods of the Korea National Health and Nutrition Exam- ination Survey (KNHANES) [16-18]. The prevalence of early and late AMD ranged between 6.0% and 6.7% and be- tween 0.6% and 0.7%, respectively. The purpose of the pres- ent study involving 16,897 subjects was to provide updated estimates of the prevalence of AMD in Korean adults ≥40 years old and to evaluate associated ocular and systemic risk factors as determined in the 2008 to 2012 KNHANES.
Materials and Methods
Study design and population
The Korea Centers for Disease Control and Prevention con- ducted a series of surveys of the KNHANES I, II, III, IV, and V starting in 1998 in order to examine the general health and nutritional status of Koreans. The KNHANES includes
three parts: a health interview, a health examination, and a nutrition survey. Ophthalmological interviews and examina- tions of participants were conducted for this survey, which was administered annually from July 2008 to December 2012. Participation percentages were 74.3% (2008), 79.2%
(2009), 77.5% (2010), 76.1% (2011), and 75.9% (2012). Partic- ipants who were ≥19 years old received ocular examinations, including slit lamp examination, visual acuity testing, auto refraction, and fundus photography. This study included 16,897 adults who were ≥40 years old. Fig. 1 provides a flow diagram of the study population. This study was reviewed and approved by the Institutional Review Board of the Korea Centers for Disease Control and Prevention. All participants provided written informed consent, and the study adhered to the tenets of the Declaration of Helsinki.
Outcome variables
A digital non-mydriatic fundus camera (TRC-NW6S; Top- con, Tokyo, Japan) and a Nikon D-80 digital camera (Nikon, Tokyo, Japan) were used for fundus photography. For each participant, a retinal image was taken for each eye. Each image was graded twice based on International Age-Re- lated Maculopathy Epidemiological Study Group criteria [19]. Nine retina specialists participated in rating the retinal images. Final grades were approved by a senior reading specialist in the Korean Ophthalmological Society (KOS).
The inter-rater reliability values for AMD grading (for the right eye and left eye, respectively) were 90.2% and 90.7% in 2008, 92.4% and 93.3% in 2009, 94.1% and 95.0% in 2010, and 96.2% and 96.6% in 2011. Early AMD was defined as the “presence of soft, indistinct drusen or reticular drusen”
or the “presence of hard or soft distinct drusen with pigmen-
tary abnormalities.” Late AMD includes either geographic
atrophy or neovascular AMD. Neovascular AMD includes
(1) retinal pigment epithelium detachment, (2) serous detach-
ment of neurosensory retina, (3) subretinal or subretinal pig-
ment epithelium hemorrhage, or (4) fibrous scars. Geograph-
ic atrophy includes the presence of round, sharply edged
areas of retinal pigment epithelium (RPE) hypopigmentation
that are ≥175 μm in diameter. If AMD severity was found
to vary between both eyes, the subject was given a higher
grade. To determine the prevalence of early AMD and late
AMD, 39 subjects with early AMD in one eye and late AMD
in another eye were designated as having late AMD.
Independent variables
Independent variables were divided into four categories: (1) socio-demographic factors, (2) health behavioral risk factors, (3) health examination variables, and (4) eye variables. Binge alcohol users included men who consumed more than seven drinks or women who consumed more than five drinks on a single occasion at least once per month [20]. Lifetime smok- ers were defined as participants who have smoked 100 or more cigarettes in their lifetime.
All refraction measurements were performed using an au- torefractor-keratometer (KR8800; Topcon, Tokyo, Japan) un- der non-cycloplegic conditions. If it was impossible to attain results with the auto-start mode, an ophthalmologist directly measured the refractive error using the manual mode. If this method also failed due to poor cooperation, severe lens opac- ity, or corneal opacity, we reported the results as missing. If a subject had no AMD in both eyes or had any AMD in both eyes, the average refractive error of both eyes was chosen as an independent variable. If the subject had AMD in one eye only, the refractive error of the corresponding eye was cho- sen as an independent variable.
Statistical methods
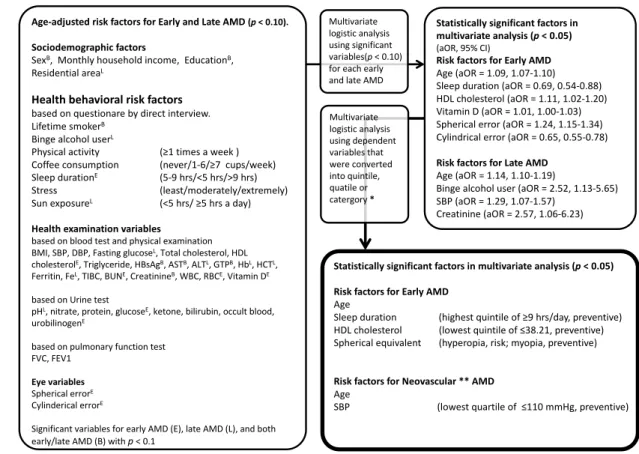
To determine the age-standardized prevalence of early and late AMD in Korea, prevalence according to age group and sex were estimated using a weight-defined method, based on the guidelines of the KNHANES administered from 2008 to 2012. A three-step multidimensional approach was used to evaluate AMD-associated predictive factors (Fig. 2). First, to identify age-adjusted risk factors associated with early AMD and late AMD, adjusted odds ratios (aORs) and 95%
confidence intervals (CIs) were calculated using age-adjust- ed univariable logistic regression analysis (Fig. 2, left col- umn). Second, multivariable logistic regression was used to evaluate risk factors from age-adjusted risk factors (p < 0.1), while considering all possible risk factors as either continu- ous or ordered variables. Some factors were not assessed for five years, so multivariable logistic regression analysis was performed in all cases except for these variables between 2008 and 2012, and additional multivariable logistic regres- sion was performed using these variables for the duration between 2010 and 2011. Statistically significant variables other than high-density lipoprotein (HDL)cholesterol were Figure 1. Flow diagram of the study population. The Korean Ophthalmological Society participated in the Korea National Health and Nutritional
Examination Survey (KNHANES) starting in July 2008 and ending in December 2012. AMD = age-related macular degeneration.A. Represents patients were considered as early AMD for prevalence B. + C. Represents patients were considered as late AMD for prevalence No AMD versus A: for risk factors of early AMD
No AMD versus B + C: for risk factors of late AMD
KNHANES 2008-2012 n = 45,811
Age ≥ 40 years n = 23,612
C. Late AMD, n = 70 A. Early AMD n = 1,152 B. One eye with early and another
eye with late AMD, n = 39 No AMD
n = 15,636
Age ≤ 39 years n = 22,199
Ophthalmic Examination starting
from July, 2008 n = 20,324
Completed a fundus photography for accessing
the AMD n = 16,897
Before July 2008 n = 3,288
Examination were incomplete
n = 3,427
the same for early AMD in both the years from 2008 to 2012 and 2010 to 2011 (see Table 1, 2 and Fig. 2, right upper cor- ner). Third, each independent risk factor for early AMD (age, sleep duration, HDL cholesterol, vitamin D, and spherical equivalent) was divided into quintiles or into five ordered categories, followed by the performance of multivariable lo- gistic analysis to determine clinical significance rather than using a simple relationship as a continuous independent vari- able. Sleep duration was divided into approximate quintiles.
Late AMD was analyzed by dividing neovascular AMD and geographic atrophy. Each independent variable (systolic blood pressure and creatine) was divided into quartiles, and multivariable logistic regression was used to confirm the tendency and clinical association with neovascular AMD.
Quartiles, instead of quintiles, for neovascular AMD were used because the number of subjects for each category was not enough for analysis, and mid-second and mid-third quartiles were considered as a single reference group. It was impossible to perform multivariable logistic regression using independent variables as a quartile for geographic atrophy because of the limited number of subjects. Multivariable logistic regression using dependent variables as continuous variables was there- fore performed for geographic atrophy. The variable of sex was included for the final model of early and late AMD for adjust- ing the sex-dependent differences of health examination vari- ables, including HDL cholesterol and creatine. All statistical tests were two-sided at 95% CI and performed using the Stata/
MP 14.0 software (StataCorp, College Station, TX, USA).
Figure 2. Framework of the study. A three-step multidimensional approach was used to evaluate the factors associated with early/late age-relat-
ed macular degeneration. BMI = body mass index; SBP = systolic blood pressure; DBP = diastolic blood pressure; HDL = high density lipoprotein;HBsAg = hepatitis B surface antigen; AST = aspartate aminotransferase; ALT = alanine aminotransferase; GTP = gamma-glutamyl transpeptidase;
Hb = hemoglobin; HCT = hematocrit; TIBC = total iron-binding capacity; BUN = blood urea nitrogen; WBC = white blood cell; RBC = red blood cell; FVC = forced vital capacity; FEV1 = forced expiratory volume in 1 second; aOR = adjusted odds ratio; CI = confidence interval. *Independent variables divided into quintile for early age-related macular degeneration (AMD), and divided into quartile for neovascular AMD due to the num- ber of subjects for each category was not enough to analysis; **Finally, Late AMD was analyzed by dividing neovascular AMD and geographic atrophy, but the prevalence of geographic atrophy was too low to analyze using categorical variables.
Age$adjusted+risk+factors+for+Early+and+Late+AMD+(p"<+0.10).+
Sociodemographic factors
SexB,&&Monthly&household&income,&&EducationB,&&
Residential&areaL
Health+behavioral+risk+factors+
based&on&questionare by&direct&interview.&
Lifetime&smokerB Binge&alcohol&userL
Physical&activity& (≥1×&a&week&)
Coffee&consumption& (never/1I6/≥7&&cups/week)
Sleep&durationE (5I9&hrs/<5&hrs/>9&hrs)
Stress (least/moderately/extremely)
Sun&exposureL (<5&hrs/&≥5&hrs a&day) Health+examination+variables
based&on&blood&test&and&physical&examination BMI,&SBP,&DBP,&Fasting&glucoseL,&Total&cholesterol,&HDL&
cholesterolE,&Triglyceride,&HBsAgB,&ASTB,&ALTL,>PB,&HbL,&HCTL,&
Ferritin,&FeL,&TIBC,&BUNE,&CreatinineB,&WBC,&RBCE,&Vitamin&DE based&on&Urine&test
pHL,&nitrate,&protein,&glucoseE,&ketone,&bilirubin,&occult&blood,&
urobilinogenE
based&on&pulmonary&function&test FVC,&FEV1
Eye+variables Spherical&errorE Cylinderical errorE
Significant&variables&for&early&AMD&(E),&late&AMD&(L),&and&both&
early/late&AMD&(B)&with&p"<&0.1
Statistically+significant+factors+in+
multivariate+analysis+(p <+0.05) (aOR,&95%&CI)
Risk+factors+for+Early+AMD+
Age&(aOR =&1.09,&1.07I1.10) Sleep&duration&(aOR =&0.69,&0.54I0.88)&
HDL&cholesterol&(aOR =&1.11,&1.02I1.20) Vitamin&D&(aOR =&1.01,&1.00I1.03) Spherical&error&(aOR =&1.24,&1.15I1.34) Cylindrical&error&(aOR =&0.65,&0.55I0.78) Risk+factors+for+Late+AMD
Age&(aOR =&1.14,&1.10I1.19)
Binge&alcohol&user&(aOR =&2.52,&1.13I5.65) SBP&(aOR =&1.29,&1.07I1.57)
Creatinine (aOR =&2.57,&1.06I6.23) Multivariate&
logistic&analysis&
using&significant&
variables(p"<&0.10)&
for&each&early&
and&late&AMD
Statistically+significant+factors+in+multivariate+analysis+(p <+0.05) Risk+factors+for+Early+AMD
AgeSleep&duration&&&&&&&&& (highest&quintile&of&≥9&hrs/day,&preventive) HDL&cholesterol&&&&&&&&&&&&&&&(lowest&quintile&of&≤38.21,&preventive) Spherical&equivalent&&&&& (hyperopia,&risk;&myopia,&preventive)
Risk+factors+for+Neovascular **+AMD
AgeSBP&&&&&&&&&&&&&&&&&&&&&&&&&&&&&&&&& (lowest&quartile&of&&≤110&mmHg,&preventive) Multivariate&
logistic&analysis&
using&dependent&
variables&that&
were&converted&
into&quintile,&
quatile or&
catergory*
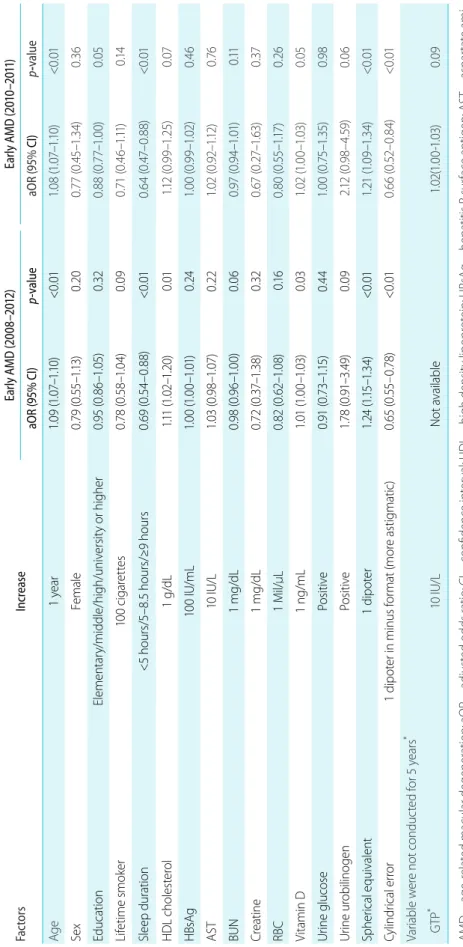
Ta bl e 1 . Fa ct or s a ss oc ia te d w ith e ar ly A M D u sin g s ur ve y d es ig n- m ul tiv ar ia te l og ist ic a na ly sis Fa ct or s In cr eas e Ea rly A M D ( 20 08 –20 12 ) Ea rly A M D ( 201 0– 201 1) aO R (9 5% C I) p- valu e aO R (9 5% CI) p- valu e Ag e 1 y ea r 1.0 9 ( 1.0 7– 1.1 0) <0 .01 1.0 8 ( 1.0 7– 1.1 0) <0 .01 Se x Fe m al e 0. 79 (0 .55 –1 .13 ) 0. 20 0. 77 (0 .45 –1 .3 4) 0. 36 Ed uc at io n El em en ta ry /mi dd le /hi gh /u ni ve rs ity o r hi gh er 0. 95 (0 .8 6– 1.0 5) 0. 32 0. 88 (0 .7 7– 1.0 0) 0. 05 Lif et ime smo ke r 10 0 c ig ar et tes 0. 78 (0 .5 8– 1.0 4) 0. 09 0. 71 (0 .4 6– 1.1 1) 0.1 4 Sl ee p du ra tio n <5 h ou rs/ 5– 8. 5 h ou rs/ ≥9 h ou rs 0. 69 (0 .5 4– 0. 88 ) <0 .01 0. 64 (0 .47 –0 .8 8) <0 .01 H DL c ho le st er ol 1 g /d L 1.1 1 ( 1.0 2– 1.2 0) 0. 01 1.1 2 ( 0. 99 –1. 25 ) 0. 07 H Bs Ag 10 0 I U/ mL 1.0 0 ( 1.0 0– 1.0 1) 0. 24 1.0 0 ( 0. 99 –1. 02 ) 0.4 6 AS T 10 IU /L 1.0 3 ( 0. 98 –1. 07 ) 0. 22 1.0 2 ( 0. 92 –1. 12 ) 0. 76 BU N 1 m g/d L 0.9 8 ( 0.9 6– 1.0 0) 0. 06 0.9 7 ( 0.9 4– 1.0 1) 0.11 Cre at in e 1 m g/d L 0. 72 (0 .37 –1 .3 8) 0. 32 0. 67 (0 .2 7– 1.6 3) 0. 37 RBC 1 M il/ μ L 0. 82 (0 .6 2– 1.0 8) 0.1 6 0. 80 (0 .55 –1 .17 ) 0. 26 Vi ta m in D 1 n g/ mL 1.0 1 ( 1.0 0– 1.0 3) 0. 03 1.0 2 ( 1.0 0– 1.0 3) 0. 05 Uri ne g lu co se Po sit iv e 0. 91 (0 .7 3– 1.1 5) 0.4 4 1.0 0 ( 0. 75 –1. 35 ) 0.9 8 Ur in e u ro bil in og en Po sit iv e 1.78 (0 .91 –3 .49 ) 0. 09 2.1 2 ( 0. 98 –4. 59 ) 0. 06 Sp he ric al e qu iv al en t 1 d ip ote r 1.2 4 ( 1.1 5– 1.3 4) <0 .01 1.2 1 ( 1.0 9– 1.3 4) <0 .01 Cy lin dr ic al e rro r 1 d ip ot er i n m in us f or m at ( m or e a sti gm ati c) 0. 65 (0 .55 – 0. 78 ) <0 .01 0. 66 (0 .5 2– 0. 84 ) <0 .01 Va ria bl e w er e n ot c on du ct ed f or 5 y ea rs
*G TP
*10 IU /L N ot a va ila bl e 1.0 2( 1.0 0- 1.0 3) 0 .0 9 AM D = a ge -rel at ed m ac ul ar d eg en er ati on ; a O R = a dj us te d o dd s r ati o; C I = c on fid en ce i nt er va l; HD L = h ig h d en sit y l ip op ro te in ; HB sA g = h ep ati tis B s ur fa ce a nti ge n; A ST = a sp ar ta te a m i- no tra ns fe ra se ; B UN = b lo od u re a n itr og en ; R BC = r ed b lo od c el l; G TP = g am m a- gl ut am yl t ra ns pe pti da se .
*Co nd uc te d b et w ee n 2 01 0 a nd 2 01 1.
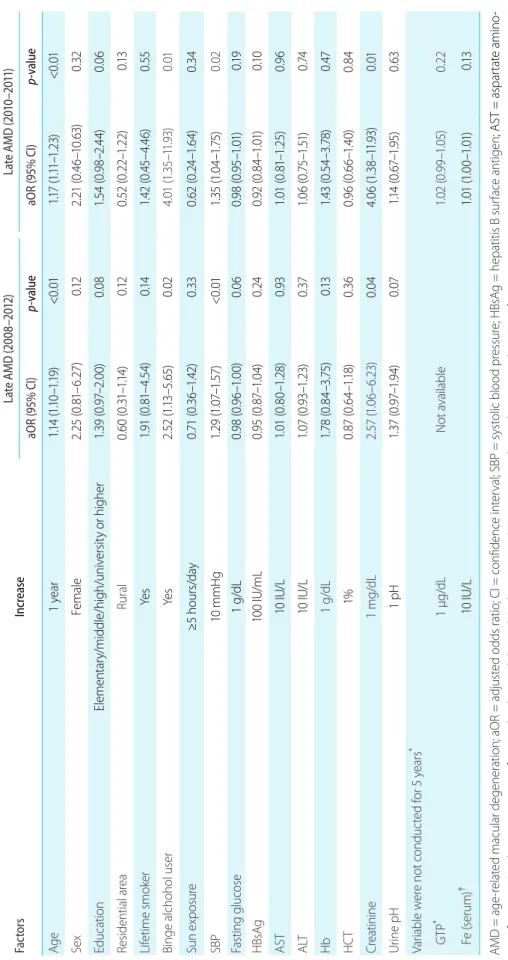
Ta bl e 2 . Fa ct or s a ss oc ia te d w ith l at e A M D u sin g s ur ve y d es ig n- m ul tiv ar ia te l og ist ic a na ly sis Fa ct or s In cr eas e La te A M D ( 20 08 –20 12 ) La te A M D ( 201 0– 201 1) aO R ( 95 % C I) p- valu e aO R ( 95 % C I) p- valu e Ag e 1 y ea r 1.1 4 ( 1.1 0– 1.1 9) <0 .01 1.1 7 ( 1.1 1– 1.2 3) <0 .01 Se x Fe m al e 2. 25 ( 0. 81 –6 .2 7) 0.12 2. 21 (0 .4 6– 10 .6 3) 0. 32 Ed uc at io n El em en ta ry /mi dd le /hi gh /u ni ve rs ity o r hi gh er 1.3 9 ( 0. 97 –2 .0 0) 0. 08 1.5 4 ( 0. 98 –2 .4 4) 0. 06 Re sid en tia l a re a Rur al 0. 60 (0 .31 –1 .14 ) 0.12 0. 52 (0 .22 –1 .22 ) 0.13 Lif et ime smo ke r Ye s 1.9 1 ( 0. 81 –4 .5 4) 0.1 4 1.4 2 ( 0.4 5– 4.4 6) 0. 55 Bi ng e a lc ho ho l u se r Ye s 2. 52 (1 .13– 5.6 5) 0. 02 4. 01 (1. 35 –1 1.9 3) 0. 01 Sun e xp os ur e ≥5 h our s/ da y 0. 71 (0 .3 6– 1.4 2) 0. 33 0. 62 (0 .24 –1 .6 4) 0. 34 SB P 10 m mH g 1.2 9 ( 1.0 7– 1.5 7) <0 .01 1.3 5 ( 1.0 4– 1.7 5) 0. 02 Fa sti ng g lu co se 1 g /d L 0.9 8 ( 0.9 6– 1.0 0) 0. 06 0.9 8 ( 0.9 5– 1.0 1) 0.19 H Bs Ag 10 0 I U/ mL 0. 95 (0 .8 7– 1.0 4) 0. 24 0. 92 (0 .8 4– 1.0 1) 0.1 0 AS T 10 IU /L 1.0 1 ( 0. 80 –1. 28 ) 0. 93 1.0 1 ( 0. 81 –1. 25 ) 0.9 6 ALT 10 IU /L 1.0 7 ( 0. 93 –1. 23 ) 0. 37 1.0 6 ( 0. 75 –1 .51 ) 0. 74 Hb 1 g /d L 1.7 8 ( 0. 84 –3 .75 ) 0.13 1.4 3 ( 0. 54 –3 .78 ) 0. 47 HC T 1% 0. 87 (0 .6 4– 1.1 8) 0. 36 0. 96 (0 .6 6– 1.4 0) 0. 84 Cre at in in e 1 m g/d L 2.5 7 ( 1.0 6– 6. 23 ) 0. 04 4. 06 (1. 38 –1 1.9 3) 0. 01 Uri ne p H 1 p H 1.3 7 ( 0. 97 –1. 94 ) 0. 07 1.1 4 ( 0. 67 –1. 95 ) 0. 63 Va ria bl e w er e n ot c on du ct ed f or 5 y ea rs
*G TP
*1 µg /d L N ot a va ila bl e 1.0 2 ( 0. 99 –1. 05 ) 0. 22 Fe (s eru m )
†10 IU /L 1.0 1 ( 1.0 0– 1.0 1) 0.13 AM D = age -re la te d m ac ul ar d ege ne ra tio n; a O R = a dj us te d o dd s r ati o; C I = c on fid en ce i nt er va l; S BP = sy st ol ic b lo od p re ss ur e; HB sA g = h ep ati tis B s ur fa ce a nti ge n ; A ST = a sp ar ta te a m in o- tra ns fe ra se ; A LT = a la ni ne a m in ot ra ns fe ra se ; H b = h em og lo bi n; H CT = h em at ocr it; G TP = g am m a- gl ut am yl t ra ns pe pti da se ; F e = f er riti n.
*Co nd uc te d b et w ee n 2 01 0 a nd 2 01 1;
†Co nd uc te d b et w ee n 2 01 0 a nd 2 01 2.
Results
Baseline characteristics of the study population The mean age of the 16,897 patients aged 40 years or older was 57.4 years [standard deviation (SD) ± 11.4] years. The percentage of female patients was 57.9%. The age-standard- ized prevalence of early AMD was 5.5% (95% CI: 5.1−5.9), and the age-standardized prevalence of late AMD was 0.6%
(95% CI: 0.4−0.7). Table 3 shows the age-standardized prev- alence of early AMD, late AMD, neovascular AMD, and geographic atrophy.
Factors associated with age-related macular degeneration
The independent risk factors associated with early or late AMD in age-adjusted univariable analysis are designated as
“B” for both early and late AMD; “E” for early AMD; and
“L” for late AMD in the left column of Fig. 2. Table 4 shows the results of age-adjusted logistic regression with aORs and
95% CIs for early and late AMD. See Table 2 for results of multivariable logistic analysis using significant variables (p
< 0.1) from age-adjusted logistic regression analysis.
Table 5 shows our final model for early AMD. Age (1 [reference] for 40 to 49 years of age; aOR: 3.29 for 50 to 59 years of age, 95% CI: 2.13−5.09; aOR: 7.94 for 60 to 69 years of age, 95% CI: 5.07−12.45; aOR: 15.07 for 70 to 79 years of age, 95% CI: 9.38−24.19; and aOR: 21.56 for ≥ 80 years of age, 95% CI: 11.10−41.87) was the most significant risk factor for early AMD. Subjects sleeping more than nine hours per day were less likely to have early AMD compared with those who were sleeping between 6.5 hours per day and seven hours per day as a reference group (aOR: 0.67, 95%
CI, 0.46−0.99). The lowest level of HDL cholesterol reduced the risk of early AMD in comparison with the mid-third quintile as a reference group (aOR: 0.68, 95% CI: 0.51−0.92).
Spherical equivalents (SE) (aOR: 0.53 in the first quintile [SE
≤ -1.38 diopters {D}], 95% CI: 0.35−0.78; aOR: 0.99 in the second quintile [-1.37 D ≤ SE ≤ -0.50 D], 95% CI: 0.71−1.40;
1 [reference] in the third quintile [-0.50 D < SE ≤ 0.00 D];
Table 3. Prevalence* of early and late AMD
Total Early AMD Late AMD Neovacular AMD Geographic atrophy
n % (95% CI) n % (95% CI) n % (95% CI) n % (95% CI)
≥40
Overall 16,897 1,152 5.5 (5.1–5.9) 109 0.6 (0.4–0.7) 86 0.5 (0.3–0.6) 25 0.1 (0.1–0.2)
Male 7,107 450 4.6 (4.1–5.2) 61 0.8 (0.5–1.0) 47 0.6 (0.4–0.8) 15 0.2 (0.1–0.3)
Female 9,790 702 6.3 (5.8–6.8) 48 0.4 (0.3–0.6) 39 0.3 (0.2–0.5) 10 0.1 (0.0–0.2)
≥65
Overall 4,956 695 14.5 (13.3–15.7) 75 1.8 (1.2–2.3) 56 1.2 (0.8–1.7) 21 0.6 (0.3–0.9)
Male 2,024 243 11.8 (10.1–13.5) 38 2.4 (1.4–3.5) 27 1.7 (0.8–2.6) 12 0.8 (0.3–1.4)
Female 2,932 452 16.2 (14.5–18.0) 37 1.3 (0.8–1.8) 29 0.9 (0.5–1.3) 9 0.5 (0.1–0.9)
Age group
40–49 5,047 58 1.2 (0.8–1.6) 7 0.1 (0.0–0.3) 7 0.1 (0.0–0.3) 0 No observation
50–59 4,787 222 4.5 (3.8–5.1) 16 0.4 (0.2–0.6) 15 0.4 (0.1–0.6) 1 0.0 (0.0–0.1)
60–69 4,010 404 10.2 (9.0–11.4) 32 1.1 (0.6–1.6) 24 0.7 (0.4–1.1) 8 0.4 (0.1–0.7)
70–79 2,624 387 15.3 (13.6–17.0) 40 1.5 (0.8–2.1) 31 1.2 (0.6–1.8) 10 0.4 (0.1–0.6)
≥80 429 81 16.5 (12.5–20.6) 14 3.5 (1.5–5.5) 9 2.3 (0.7–4.0) 6 1.7 (0.1–3.2)
AMD = age-related macular degeneration; CI = confidence interval.
*
Complex sample analysis was performed with reference to the weight, stratification variance, and cluster variance, following the statistical
guidelines of the Korea Centers for Disease Control and Prevention. Subjects with early AMD in one eye and late AMD in the opposite eye were
considered as late AMD.
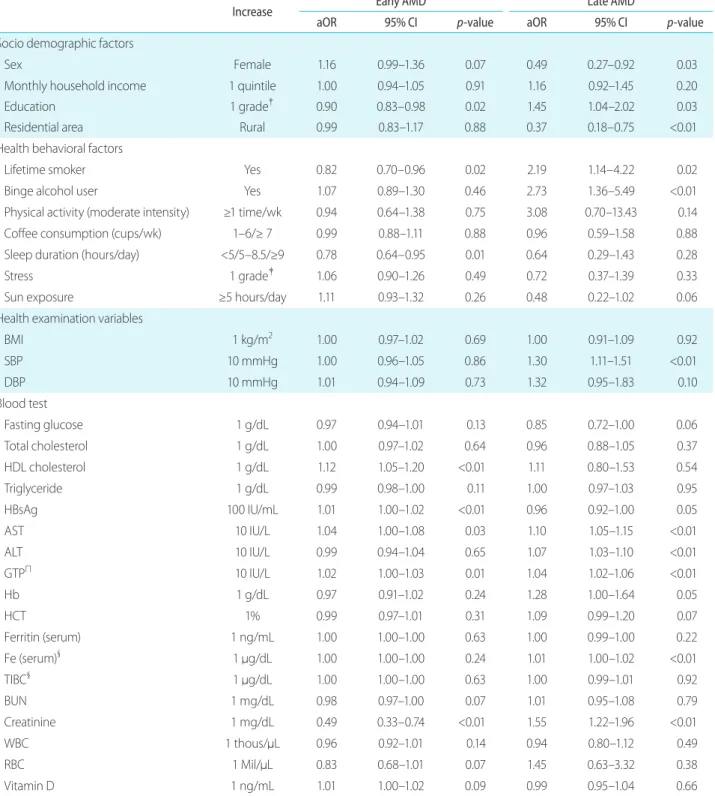
Table 4. Age-adjusted risk factors for early and late AMD using the survey design
Increase Early AMD Late AMD
aOR 95% CI
p-value
aOR 95% CIp-value
Socio demographic factors
Sex Female 1.16 0.99–1.36 0.07 0.49 0.27–0.92 0.03
Monthly household income 1 quintile 1.00 0.94–1.05 0.91 1.16 0.92–1.45 0.20
Education 1 grade† 0.90 0.83–0.98 0.02 1.45 1.04–2.02 0.03
Residential area Rural 0.99 0.83–1.17 0.88 0.37 0.18–0.75 <0.01
Health behavioral factors
Lifetime smoker Yes 0.82 0.70–0.96 0.02 2.19 1.14–4.22 0.02
Binge alcohol user Yes 1.07 0.89–1.30 0.46 2.73 1.36–5.49 <0.01
Physical activity (moderate intensity) ≥1 time/wk 0.94 0.64–1.38 0.75 3.08 0.70–13.43 0.14
Coffee consumption (cups/wk) 1–6/≥ 7 0.99 0.88–1.11 0.88 0.96 0.59–1.58 0.88
Sleep duration (hours/day) <5/5–8.5/≥9 0.78 0.64–0.95 0.01 0.64 0.29–1.43 0.28
Stress 1 grade‡ 1.06 0.90–1.26 0.49 0.72 0.37–1.39 0.33
Sun exposure ≥5 hours/day 1.11 0.93–1.32 0.26 0.48 0.22–1.02 0.06
Health examination variables
BMI 1 kg/m2 1.00 0.97–1.02 0.69 1.00 0.91–1.09 0.92
SBP 10 mmHg 1.00 0.96–1.05 0.86 1.30 1.11–1.51 <0.01
DBP 10 mmHg 1.01 0.94–1.09 0.73 1.32 0.95–1.83 0.10
Blood test
Fasting glucose 1 g/dL 0.97 0.94–1.01 0.13 0.85 0.72–1.00 0.06
Total cholesterol 1 g/dL 1.00 0.97–1.02 0.64 0.96 0.88–1.05 0.37
HDL cholesterol 1 g/dL 1.12 1.05–1.20 <0.01 1.11 0.80–1.53 0.54
Triglyceride 1 g/dL 0.99 0.98–1.00 0.11 1.00 0.97–1.03 0.95
HBsAg 100 IU/mL 1.01 1.00–1.02 <0.01 0.96 0.92–1.00 0.05
AST 10 IU/L 1.04 1.00–1.08 0.03 1.10 1.05–1.15 <0.01
ALT 10 IU/L 0.99 0.94–1.04 0.65 1.07 1.03–1.10 <0.01
GTPΠ 10 IU/L 1.02 1.00–1.03 0.01 1.04 1.02–1.06 <0.01
Hb 1 g/dL 0.97 0.91–1.02 0.24 1.28 1.00–1.64 0.05
HCT 1% 0.99 0.97–1.01 0.31 1.09 0.99–1.20 0.07
Ferritin (serum) 1 ng/mL 1.00 1.00–1.00 0.63 1.00 0.99–1.00 0.22
Fe (serum)§ 1 μg/dL 1.00 1.00–1.00 0.24 1.01 1.00–1.02 <0.01
TIBC§ 1 μg/dL 1.00 1.00–1.00 0.63 1.00 0.99–1.01 0.92
BUN 1 mg/dL 0.98 0.97–1.00 0.07 1.01 0.95–1.08 0.79
Creatinine 1 mg/dL 0.49 0.33–0.74 <0.01 1.55 1.22–1.96 <0.01
WBC 1 thous/μL 0.96 0.92–1.01 0.14 0.94 0.80–1.12 0.49
RBC 1 Mil/μL 0.83 0.68–1.01 0.07 1.45 0.63–3.32 0.38
Vitamin D 1 ng/mL 1.01 1.00–1.02 0.09 0.99 0.95–1.04 0.66
aOR: 1.23 in the fourth quintile [+0.06 D ≤ SE < +0.69 D], 95% CI: 0.91−1.68; and aOR: 1.41 in highest quintile [SE ≥ +0.69 D], 95% CI: 1.07−1.86) were statistically significant using multivariable analysis.
Table 6 shows our final model for neovascular AMD and geographic atrophy. Patients in the first quartile of systolic blood pressure (≤110 mmHg) were less likely to have neo- vascular AMD compared with patients in the second or third quartile (110.3−133.9 mmHg, reference). Only age was associated with geographic atrophy (aOR: 1.10, 95% CI:
1.05−1.17).
Discussion
Prevalence of age-related macular degenera- tion
The prevalence of early AMD and late AMD was 5.5% and
0.6%, respectively, in Korean adults aged 40 years or older.
A recent meta-analysis suggested that AMD was as com- mon in Asian adults as in Caucasian adults, with prevalence estimates of 6.8% and 0.6% for early and late AMD present in Asian adults aged ≥40 years, respectively [4]. In a Beijing eye study, the prevalence of early AMD was 4.2% in par- ticipants aged ≥40 years [21], while in a Singapore−Indian eye study, the prevalence of early AMD was 5.6% [22]. In a separate comparative study completed in Singapore and In- dia, the age-standardized prevalence of early and late AMD was 4.45% and 0.34%, respectively, in Singapore and 5.80%
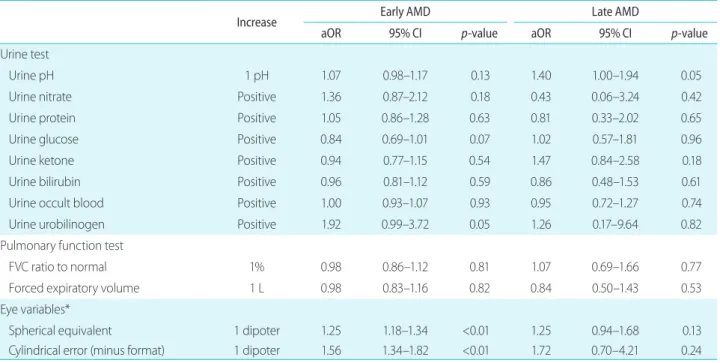
and 0.16% in India [12]. Another study using a multiethnic Asian cohort found that the age-standardized prevalence in subjects aged 40 years and older was similar in three Asian ethnic groups: specifically, Chinese with 7.3%; Malay with 7.7%; and Indian with 5.7% [23]. In the Funagata Study per- formed in Japan, the age-standardized prevalence of early and late AMD was 4.2% and 0.7%, respectively, in subjects Table 4. Continued
Increase Early AMD Late AMD
aOR 95% CI
p-value
aOR 95% CIp-value
Urine test
Urine pH 1 pH 1.07 0.98–1.17 0.13 1.40 1.00–1.94 0.05
Urine nitrate Positive 1.36 0.87–2.12 0.18 0.43 0.06–3.24 0.42
Urine protein Positive 1.05 0.86–1.28 0.63 0.81 0.33–2.02 0.65
Urine glucose Positive 0.84 0.69–1.01 0.07 1.02 0.57–1.81 0.96
Urine ketone Positive 0.94 0.77–1.15 0.54 1.47 0.84–2.58 0.18
Urine bilirubin Positive 0.96 0.81–1.12 0.59 0.86 0.48–1.53 0.61
Urine occult blood Positive 1.00 0.93–1.07 0.93 0.95 0.72–1.27 0.74
Urine urobilinogen Positive 1.92 0.99–3.72 0.05 1.26 0.17–9.64 0.82
Pulmonary function test
FVC ratio to normal 1% 0.98 0.86–1.12 0.81 1.07 0.69–1.66 0.77
Forced expiratory volume 1 L 0.98 0.83–1.16 0.82 0.84 0.50–1.43 0.53
Eye variables*
Spherical equivalent 1 dipoter 1.25 1.18–1.34 <0.01 1.25 0.94–1.68 0.13
Cylindrical error (minus format) 1 dipoter 1.56 1.34–1.82 <0.01 1.72 0.70–4.21 0.24
AMD = age-related macular degeneration ; aOR = adjusted odds ratio; CI = confidence interval; wk = weeks; BMI = body mass index; SBP = systolic blood pressure; DBP = diastolic blood pressure; HDL = high density lipoprotein; HBsAg = hepatitis B surface antigen; AST = aspartate aminotransferase; ALT = alanine aminotransferase; GTP = gamma-glutamyl transpeptidase; Hb = hemoglobin; HCT = hematocrit; Fe = ferri- tin; TIBC = total iron-binding capacity; BUN = blood urea nitrogen; WBC = white blood cell; RBC = red blood cell; FVC = forced vital capacity.
*
Patients who received cataract surgery were excluded (n = 1,325). For patients with any AMD in one eye, we used the spherical or cylindrical error of the same eye; for patients with or without any AMD in both eyes, we used the average value between the two eyes;
†Elementary/
middle/high/university or higher;
ǂLeast/mod/extremely;
§Conducted between 2010 and 2012 (n = 11,922);
ΠConducted between 2010 and
2011 (n = 8,007).
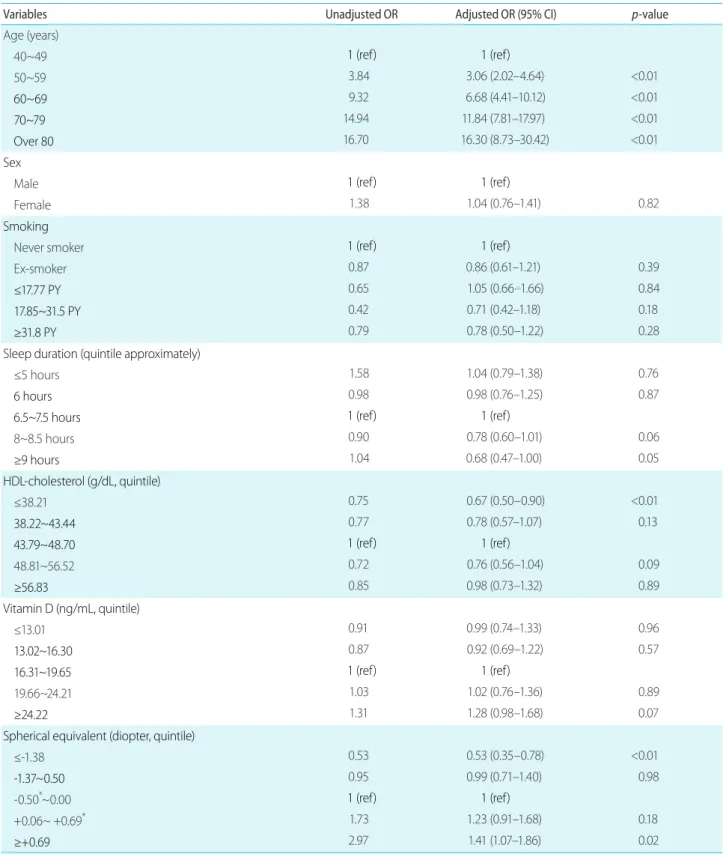
Table 5. Factors associated with early AMD-multivariable logistic regression analysis using dependent variables as quintile or categorical
variablesVariables Unadjusted OR Adjusted OR (95% CI)
p-value
Age (years)
40~49
1 (ref) 1 (ref)
50~59 3.84 3.06 (2.02–4.64) <0.01
60~69
9.32 6.68 (4.41–10.12) <0.0170~79
14.94 11.84 (7.81–17.97) <0.01Over 80
16.70 16.30 (8.73–30.42) <0.01Sex
Male
1 (ref) 1 (ref)
Female 1.38 1.04 (0.76–1.41) 0.82
Smoking
Never smoker
1 (ref) 1 (ref)
Ex-smoker 0.87 0.86 (0.61–1.21) 0.39
≤17.77 PY
0.65 1.05 (0.66–1.66) 0.8417.85~31.5 PY
0.42 0.71 (0.42–1.18) 0.18≥31.8 PY
0.79 0.78 (0.50–1.22) 0.28Sleep duration (quintile approximately)
≤5 hours 1.58 1.04 (0.79–1.38) 0.76
6 hours
0.98 0.98 (0.76–1.25) 0.876.5~7.5 hours 1 (ref) 1 (ref)
8~8.5 hours 0.90 0.78 (0.60–1.01) 0.06
≥9 hours
1.04 0.68 (0.47–1.00) 0.05HDL-cholesterol (g/dL, quintile)
≤38.21 0.75 0.67 (0.50–0.90) <0.01
38.22~43.44
0.77 0.78 (0.57–1.07) 0.1343.79~48.70 1 (ref) 1 (ref)
48.81~56.52 0.72 0.76 (0.56–1.04) 0.09
≥56.83
0.85 0.98 (0.73–1.32) 0.89Vitamin D (ng/mL, quintile)
≤13.01 0.91 0.99 (0.74–1.33) 0.96
13.02~16.30
0.87 0.92 (0.69–1.22) 0.5716.31~19.65 1 (ref) 1 (ref)
19.66~24.21 1.03 1.02 (0.76–1.36) 0.89
≥24.22
1.31 1.28 (0.98–1.68) 0.07Spherical equivalent (diopter, quintile)
≤-1.38 0.53 0.53 (0.35–0.78) <0.01
-1.37~0.50
0.95 0.99 (0.71–1.40) 0.98-0.50*~0.00
1 (ref) 1 (ref)
+0.06~ +0.69* 1.73 1.23 (0.91–1.68) 0.18
≥+0.69
2.97 1.41 (1.07–1.86) 0.02AMD = age-related macular degeneration; OR = odds ratio; CI = confidence interval; PY = pack year, tertile in current smokers; HDL = high density lipoprotein; ref = reference.
*Not included, 0.50 or 0.69.
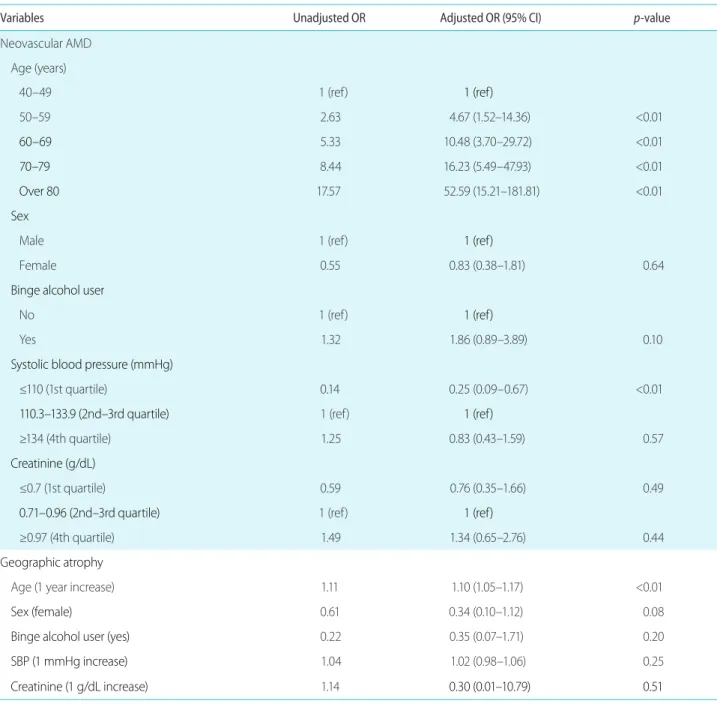
Table 6. Factors associated with neovascular AMD and geographic atrophy-multivariate logistic regression analysis using dependent variables
as quartile or categorical variables for neovascular AMD and as continuous variables for geographic atrophy due to lack of numberVariables Unadjusted OR Adjusted OR (95% CI)
p-value
Neovascular AMD Age (years)
40–49 1 (ref)
1 (ref)
50–59 2.63 4.67 (1.52–14.36) <0.01
60–69
5.33 10.48 (3.70–29.72) <0.0170–79
8.44 16.23 (5.49–47.93) <0.01Over 80
17.57 52.59 (15.21–181.81) <0.01Sex
Male 1 (ref)
1 (ref)
Female 0.55 0.83 (0.38–1.81) 0.64
Binge alcohol user
No 1 (ref)
1 (ref)
Yes 1.32 1.86 (0.89–3.89) 0.10
Systolic blood pressure (mmHg)
≤110 (1st quartile) 0.14 0.25 (0.09–0.67) <0.01
110.3–133.9 (2nd–3rd quartile)
1 (ref)1 (ref)
≥134 (4th quartile) 1.25 0.83 (0.43–1.59) 0.57
Creatinine (g/dL)
≤0.7 (1st quartile) 0.59 0.76 (0.35–1.66) 0.49
0.71–0.96 (2nd–3rd quartile)
1 (ref)1 (ref)
≥0.97 (4th quartile) 1.49 1.34 (0.65–2.76) 0.44
Geographic atrophy
Age (1 year increase) 1.11 1.10 (1.05–1.17) <0.01
Sex (female)
0.61 0.34 (0.10–1.12) 0.08Binge alcohol user (yes)
0.22 0.35 (0.07–1.71) 0.20SBP (1 mmHg increase)
1.04 1.02 (0.98–1.06) 0.25Creatinine (1 g/dL increase)
1.140.30 (0.01–10.79) 0.51
AMD = age-related macular degeneration; OR = odds ratio; CI = confidence interval; ref = reference; SBP = systolic blood pressure.
aged 35 years and older [8]. In the Hadan Eye Study per- formed in a rural Chinese population, the age-standardized prevalence among subjects aged 50 years and older for early and late AMD was 4.7% and 0.2%, respectively [23]. In the present study, the prevalence of early AMD was 8.6% in subjects aged 50 years and older (data not shown). Overall, in Asia, the prevalence of early AMD was 4.2% to 7.7%, and that of late AMD was 0.34% to 0.7% in Asian adults aged
≥40 years.
Risk factors for early age-related macular de- generation
Age
Increasing age strongly correlated with increasing preva- lence of early AMD. Adjusted ORs for early and late AMD were 1.09 (95% CI: 1.07−1.10) and 1.14 (95% CI: 1.10−1.19), respectively, for each year increase in patients aged 40 years and older (Fig. 2; see Table 1, 2). At 10-year intervals, the prevalence of early AMD increased gradually (1.2% in the 40s, 4.5% in the 50s, 10.2% in the 60s, 15.3% in the 70s, and 16.5% in the 80s), whereas the prevalence of late AMD increased rather abruptly in subjects aged 80 years and old- er, especially in those with geographic atrophy (0.0% in the 50s, 0.4% in the 60s, 0.4% in the 70s, and 1.7% in the 80s or older) (Table 3). These findings suggest that development of geographic atrophy is associated with the cumulative effects of senile changes and may progress rapidly after 80 years of age. However, no clear explanation for this trend has yet been determined [24,25].
Refractive error
Regarding an association between refraction error and AMD, previous studies have been inconsistent. The Sin- gapore Indian Eye Study [26], the Los Angeles Latino Eye Study (LALES) [27], and other studies [23] have reported that eyes that were more myopic were associated with a lower prevalence of AMD, while the Singapore Malay Eye Study [28], the Rotterdam Study [29], the Age-Related Eye Disease Study [10], the France-DMLA Study [30], the Blue Mountains Eye Study [31], and others [32,33] found a cor- relation between hyperopic eyes and a higher prevalence of early AMD. Additionally, LALES [27], and the Singapore
Indian Eye Study [34], reported that there was no association between hyperopia and early AMD, though there was an association between myopia and a lower prevalence of early AMD. The Blue Mountains Eye Study [35] and the Beaver Dam Eye Study [36] reported no association between refrac- tive error and early AMD. However, care must be taken in interpreting these previous studies because the definition of refractive error was different in cut values.
The present study found that myopia correlated with a lower prevalence of early AMD but not with late AMD (Table 5). Currently, there is no confirmed reason for an association between AMD and refractive error. However, potential caus- es for this association could include differences in vitreous body properties, the prevalence of posterior vitreous detach- ment [37], hemodynamic factors [33], or differences in the intraocular concentration of cytokines between myopic eyes and hyperopic eyes [38]. Differences in hemodynamic fac- tors could be partly explained by the character of the sclera in hyperopic eyes. Hyperopic eyes are generally smaller and have thicker sclera [39]. Some experimental results obtained using laser Doppler flow measurements showed an increased choroidal resistance in AMD [10]. Flow measurements may decrease during the exchange of metabolic products across the RPE, resulting in drusen formation [28],
Sleep duration and HDL cholesterol
The proportions of subjects with sleep times less than five hours per day or nine or more hours per day increased at older ages (data not shown). Thus, age may be a confounding factor in characterizing a possible association between sleep hours and AMD prevalence. Even after age was controlled, multivariable logistic regression showed that subjects who slept nine or more hours per day (highest approximate quin- tile) were less likely to have early AMD (aOR: 0.68, 95%
CI: 0.46−0.99, Table 5). However, there was no association between sleep duration and late AMD.
For analysis of blood test results, we chose to use quintiles
for independent variables rather than raw values. Increas-
ing HDL cholesterol was associated with increasing early
AMD (aOR: 1.11, 95% CI: 1.02−1.20 in Table 1). However,
when patients were divided into quintiles, the lowest quintile
(≤38.21 g/dL) of HDL cholesterol was associated with a low-
er prevalence of early AMD (aOR: 0.68, 95% CI: 0.51−0.92),
while the highest quintile of HDL cholesterol was not associ-
ated with a higher prevalence of early AMD (Table 5). There has been controversy over whether HDL cholesterol levels are associated with early AMD [40-42]. Although logistic regression using HDL cholesterol showed a positive associa- tion between HDL cholesterol level and prevalence of AMD, an alternative conclusion could be that lower levels of HDL cholesterol had a protective effect rather than higher levels.
Based upon these observations, further study is warranted on the role of HDL cholesterol in AMD.
Risk factors for late age-related macular degen- eration
Neovascular age-related macular degeneration
Multivariable logistic regression showed that increasing age was associated with a higher prevalence of neovascular AMD, while low systolic blood pressure was associated with a lower prevalence of neovascular AMD (Table 6). Various measures of hypertension or blood pressure have been as- sociated with AMD [34,43]. Our findings suggest that low systolic blood pressure (≤110 mmHg) had a protective effect on the development of neovascular AMD rather than higher blood pressure.
Geographic atrophy
Among continuous variables including age, binge alcohol use, systolic blood pressure, and creatine, multivariable lo- gistic regression analysis showed that only increasing age was associated with geographic atrophy (Table 6). However, the total number of patients associated with geographic atro- phy was too small for further analysis, and more cumulative data are needed to obtain further conclusions.
Since this was a cross-sectional study, it was limited in that the temporal cause-and-effect relationships could not be definitively established. More detailed analysis according to severity of AMD (e.g., intermediate AMD) was impos- sible, as the original data provided classified variables of early, late, and neovascular AMD and geographic atrophy.
In addition, early AMD was identified using non-mydriatic fundus photography, which may have resulted in potential misdiagnosis. In addition, participants were required to be able to visit the mobile laboratory to undergo their examina- tions. Therefore, in some cases, even if certain people were
selected as target subjects, their examinations may not have actually been completed, leading to selection bias. The as- sociation between smoking and AMD is well-known. In the present study, a significant association was observed in uni- variate analysis, while smoking was excluded from the final model in multivariate analysis. Other variables may be con- sidered more important than smoking, due to the analysis of various independent variables. On one hand, this may have been caused by some uncontrolled confounding factors, such as sun exposure. In addition, personal biases or recall biases could not be completely eliminated from the data.
In conclusion, age-standardized prevalence of early AMD and late AMD among subjects aged 40 years and older was 5.5% (95% CI: 5.1−5.9) and 0.6% (95% CI: 0.4−0.7), respec- tively. This study confirmed that increasing age was the most important risk factor for any AMD. Longer sleep duration (nine or more hours per day), low serum level of HDL cho- lesterol (≤ 38.21 g/dL), and myopia (SE ≤ -1.38 D) were asso- ciated with a lower prevalence of early AMD, while hypero- pia (SE > +0.69 D) was associated with a higher prevalence of early AMD. Low systolic pressure (≤110 mmHg) was associated with a lower prevalence of neovascular AMD, but higher systolic pressure (≥ 134 mmHg) was not associated with increased neovascular AMD. There were no significant risk factors for geographic atrophy except increasing age.
Authorship statement
The authors alone are responsible for the content and writing of this paper.
Conflicts of interest
The authors declare no conflicts of interest relevant to this article.
References
1. Klein R, Klein BE, Cruickshanks KJ. The prevalence of age-related maculopathy by geographic region and ethnicity. Prog Retin Eye Res 1999;18:371-89.
2. Friedman DS, Katz J, Bressler NM, et al. Racial differences in the prevalence of age-related macular degeneration: the Baltimore Eye Survey. Ophthalmology 1999;106:1049-55.
3. Klein R, Rowland ML, Harris MI. Racial/ethnic differences in age-related maculopathy. Third National Health and Nutrition Examination Survey. Ophthalmology 1995;102:371-81.
4. Kawasaki R, Yasuda M, Song SJ, et al. The prevalence of age-re- lated macular degeneration in Asians: a systematic review and meta-analysis. Ophthalmology 2010;117:921-7.
5. Krishnaiah S, Das T, Nirmalan PK, et al. Risk factors for age-relat- ed macular degeneration: findings from the Andhra Pradesh eye disease study in South India. Invest Ophthalmol Vis Sci 2005;46:4442-9.
6. Krishnaiah S, Das TP, Kovai V, Rao GN. Associated factors for age-related maculopathy in the adult population in southern India: the Andhra Pradesh Eye Disease Study. Br J Ophthalmol 2009;93:1146-50.
7. Chen SJ, Cheng CY, Peng KL, et al. Prevalence and associated risk factors of age-related macular degeneration in an elderly Chinese population in Taiwan: the Shihpai Eye Study. Invest Ophthalmol Vis Sci 2008;49:3126-33.
8. Kawasaki R, Wang JJ, Ji GJ, et al. Prevalence and risk factors for age-related macular degeneration in an adult Japanese popula- tion: the Funagata study. Ophthalmology 2008;115:1376-81, 1381.
e1-2.
9. Klein R, Klein BE, Knudtson MD, et al. Prevalence of age-related macular degeneration in 4 racial/ethnic groups in the multi-eth- nic study of atherosclerosis. Ophthalmology 2006;113:373-80.
10. Age-Related Eye Disease Study Research Group. Risk factors as- sociated with age-related macular degeneration. A case-control study in the age-related eye disease study: Age-Related Eye Dis- ease Study Report Number 3. Ophthalmology 2000;107:2224-32.
11. Fraser-Bell S, Wu J, Klein R, et al. Smoking, alcohol intake, estro- gen use, and age-related macular degeneration in Latinos: the Los Angeles Latino Eye Study. Am J Ophthalmol 2006;141:79-87.
12. Gemmy Cheung CM, Li X, Cheng CY, et al. Prevalence and risk factors for age-related macular degeneration in Indians: a comparative study in Singapore and India. Am J Ophthalmol 2013;155:764-73, 773.e1-3.
13. Klein R, Klein BE, Tomany SC, Moss SE. Ten-year incidence of age-related maculopathy and smoking and drinking: the Beaver Dam Eye Study. Am J Epidemiol 2002;156:589-98.
14. Butt AL, Lee ET, Klein R, et al. Prevalence and risks factors of age-related macular degeneration in Oklahoma Indians: the Vision Keepers Study. Ophthalmology 2011;118:1380-5.
15. Rim TH, Cheng CY, Kim DW, et al. A nationwide cohort study of cigarette smoking and risk of neovascular age-related macular degeneration in East Asian men. Br J Ophthalmol 2017;101:1367-
73.
16. Park SJ, Lee JH, Woo SJ, et al. Age-related macular degeneration:
prevalence and risk factors from Korean National Health and Nutrition Examination Survey, 2008 through 2011. Ophthalmol- ogy 2014;121:1756-65.
17. La TY, Cho E, Kim EC, et al. Prevalence and risk factors for age-re- lated macular degeneration: Korean National Health and Nutri- tion Examination Survey 2008-2011. Curr Eye Res 2014;39:1232-9.
18. Cho BJ, Heo JW, Kim TW, et al. Prevalence and risk factors of age-related macular degeneration in Korea: the Korea National Health and Nutrition Examination Survey 2010-2011. Invest Oph- thalmol Vis Sci 2014;55:1101-8.
19. Bird AC, Bressler NM, Bressler SB, et al. An international classifi- cation and grading system for age-related maculopathy and age-related macular degeneration. The international ARM epi- demiological study group. Surv Ophthalmol 1995;39:367-74.
20. Obesity: preventing and managing the global epidemic. Re- port of a WHO consultation. World Health Organ Tech Rep Ser 2000;894:i-xii, 1-253.
21. You QS, Xu L, Yang H, et al. Five-year incidence of age-related macular degeneration: the Beijing Eye Study. Ophthalmology 2012;119:2519-25.
22. Cheung N, Tay WT, Cheung GC, et al. Is aspirin intake associated with early age-related macular degeneration? The Singapore Indian Eye Study. Br J Ophthalmol 2013;97:785-8.
23. Cheung CM, Tai ES, Kawasaki R, et al. Prevalence of and risk fac- tors for age-related macular degeneration in a multiethnic Asian cohort. Arch Ophthalmol 2012;130:480-6.
24. Vingerling JR, Dielemans I, Hofman A, et al. The prevalence of age-related maculopathy in the Rotterdam Study. Ophthalmol- ogy 1995;102:205-10.
25. Varma R, Fraser-Bell S, Tan S, et al. Prevalence of age-related macular degeneration in Latinos: the Los Angeles Latino eye study. Ophthalmology 2004;111:1288-97.
26. Pan CW, Cheung CY, Aung T, et al. Differential associations of myopia with major age-related eye diseases: the Singapore Indi- an Eye Study. Ophthalmology 2013;120:284-91.
27. Fraser-Bell S, Choudhury F, Klein R, et al. Ocular risk factors for age-related macular degeneration: the Los Angeles Latino Eye Study. Am J Ophthalmol 2010;149:735-40.
28. Lavanya R, Kawasaki R, Tay WT, et al. Hyperopic refractive error and shorter axial length are associated with age-related macular degeneration: the Singapore Malay Eye Study. Invest Ophthal- mol Vis Sci 2010;51:6247-52.
29. Ikram MK, van Leeuwen R, Vingerling JR, et al. Relationship be-
tween refraction and prevalent as well as incident age-related maculopathy: the Rotterdam Study. Invest Ophthalmol Vis Sci 2003;44:3778-82.
30. Chaine G, Hullo A, Sahel J, et al. Case-control study of the risk factors for age related macular degeneration. France-DMLA Study Group. Br J Ophthalmol 1998;82:996-1002.
31. Wang JJ, Mitchell P, Smith W. Refractive error and age-related maculopathy: the Blue Mountains Eye Study. Invest Ophthalmol Vis Sci 1998;39:2167-71.
32. Friberg TR, Bilonick RA, Brennen PM. Risk factors for conversion to neovascular age-related macular degeneration based on lon- gitudinal morphologic and visual acuity data. Ophthalmology 2012;119:1432-7.
33. Böker T, Fang T, Steinmetz R. Refractive error and choroidal per- fusion characteristics in patients with choroidal neovasculariza- tion and age-related macular degeneration. Ger J Ophthalmol 1993;2:10-3.
34. Pan CW, Ikram MK, Cheung CY, et al. Refractive errors and age-related macular degeneration: a systematic review and me- ta-analysis. Ophthalmology 2013;120:2058-65.
35. Wang JJ, Jakobsen KB, Smith W, Mitchell P. Refractive status and the 5-year incidence of age-related maculopathy: the Blue Mountains Eye Study. Clin Exp Ophthalmol 2004;32:255-8.
36. Wong TY, Klein R, Klein BE, Tomany SC. Refractive errors and 10-
year incidence of age-related maculopathy. Invest Ophthalmol Vis Sci 2002;43:2869-73.
37. Hayreh SS, Jonas JB. Posterior vitreous detachment: clinical cor- relations. Ophthalmologica 2004;218:333-43.
38. Jonas JB, Tao Y, Neumaier M, Findeisen P. VEGF and refractive error. Ophthalmology 2010;117:2234.e1.
39. Sandberg MA, Tolentino MJ, Miller S, et al. Hyperopia and neo- vascularization in age-related macular degeneration. Ophthal- mology 1993;100:1009-13.
40. Tan JS, Mitchell P, Smith W, Wang JJ. Cardiovascular risk fac- tors and the long-term incidence of age-related macular degeneration: the Blue Mountains Eye Study. Ophthalmology 2007;114:1143-50.
41. Klein R, Cruickshanks KJ, Nash SD, et al. The prevalence of age-related macular degeneration and associated risk factors.
Arch Ophthalmol 2010;128:750-8.
42. Fan Q, Maranville JC, Fritsche L, et al. HDL-cholesterol levels and risk of age-related macular degeneration: a multiethnic genetic study using Mendelian randomization. Int J Epidemiol 2017;46:1891-902.
43. Klein R, Klein BE, Tomany SC, et al. Ten-year incidence and progression of age-related maculopathy: The Beaver Dam eye study. Ophthalmology 2002;109:1767-79.
![Table 5 shows our final model for early AMD. Age (1 [reference] for 40 to 49 years of age; aOR: 3.29 for 50 to 59 years of age, 95% CI: 2.13−5.09; aOR: 7.94 for 60 to 69 years of age, 95% CI: 5.07−12.45; aOR: 15.07 for 70 to 79 years of age, 95% CI: 9.](https://thumb-ap.123doks.com/thumbv2/123dokinfo/5436814.648903/7.892.84.812.150.503/table-shows-final-model-early-reference-years-years.webp)