© 2017 The Korean Ophthalmological Society
This is an Open Access article distributed under the terms of the Creative Commons Attribution Non-Commercial License (http://creativecommons.org/licenses /by-nc/3.0/) which permits unrestricted non-commercial use, distribution, and reproduction in any medium, provided the original work is properly cited.
Original Article
Age-related macular degeneration (AMD) has been rec- ognized as one of the leading causes of visual loss in elder- ly people in Western countries [1,2]. The number of elderly people is increasing substantially in Asian countries, and the prevalence of AMD is also increasing in this part of the world [3,4].
Depressive Symptoms and Quality of Life in Age-related Macular Degeneration Based on Korea National Health and Nutrition
Examination Survey (KNHANES)
So Jung Ryu
1, Won June Lee
2, Leslie Bishop Tarver
3, Yong Un Shin
1, Min Ho Kang
1, Mincheol Seong
1, Hee Yoon Cho
11
Department of Ophthalmology, Hanyang University Guri Hospital, Hanyang University College of Medicine, Guri, Korea
2
Department of Ophthalmology, Seoul National University Hospital, Seoul National University College of Medicine, Seoul, Korea
3
Department of Psychiatry, Massachusetts General Hospital, Harvard Medical School, Boston, MA, USA
Purpose: This study was conducted to investigate the depressive symptoms and quality of life (QOL) in patients with age-related macular degeneration (AMD) using data obtained from the Korea National Health and Nutri- tional Examination Survey V-2 (KNHANES V-2) conducted in 2011.
Methods: This was a population-based, cross-sectional study that selected 329 participants from the fifth KN- HANES (2011) who were diagnosed with AMD by an ophthalmologist based on fundus photography. The prev- alence of depressive symptoms and the health-related QOL (using EuroQol indices) in this cohort were also estimated. Factors associated with depressive symptoms, including socioeconomic status, QOL indices, and associated chronic diseases, were investigated using multivariate regression models.
Results: Depressive symptoms were observed more frequently in AMD patients than in non-AMD controls (p
= 0.013). Among the total 329 AMD participants, 65 (19.8%) had depressive symptoms. There were 16 males (24.6%) and 49 females (75.4%). Upon multivariate analysis, significant factors found to be associated with de- pressive symptoms were female gender (odds ratio [OR], 2.082; 95% confidence interval [CI], 1.001 to 4.330), being in the “dependent” group for activities of daily living (OR, 4.638; 95% CI, 2.061 to 10.435), and having
“some problems” in the “anxiety-depression” dimension of the EQ-5D (OR, 7.704; 95% CI, 1.890 to 31.408).
Conclusions: Female gender and being dependent on others for activities of daily living increased the associ- ation of depressive symptoms in this cohort of AMD participants. Screening for depressive symptoms in East Asian AMD patients with these characteristics should be an important component of their care.
Key Words: Age-related macular degeneration, Depression, Korea National Health and Nutritional Examination Survey, Quality of life
Received: August 16, 2016 Accepted: December 21, 2016
Corresponding Author: Hee Yoon Cho, MD. Department of Ophthalmol-
ogy, Hanyang University Guri Hospital, Hanyang University College of
Medicine, #153 Gyeongchun-ro, Guri 11923, Korea. Tel: 82-31-560-2353,
Fax: 82-31-564-9479, E-mail: [email protected]
The type of vision loss can lead to significant changes in a person’s life, including a loss of independence, an inabil- ity to continue one’s usual activities/hobbies, and increased social isolation due to decreased mobility and daily func- tioning. These factors are common for someone diagnosed with a chronic disease and are particularly typical in those with vision loss [5], which explains the expected associa- tion of depression and AMD.
Several studies have reported a relationship between de- pression and AMD, with a higher prevalence of depression in AMD cases than in the general population [6-9]. These studies are mostly from developed Western countries; we could not find any previous reports on the risk factors for depression in AMD patients in East Asian countries. Be- cause many patients with AMD already have two major de- pression risk factors (advanced age and visual impairment), these covariates need to be carefully considered when eval- uating depressive symptoms in this disease population.
Previously, we studied depression in Korean AMD pa- tients before treatment with intravitreal ranibizumab in- jections [10]. The prevalence of depression in AMD was substantial and similar to previously reported rates. How- ever, there were several methodological limitations. The study was a hospital-based pilot study with a limited sam- ple size, and socioeconomic factors of the participants were not assessed.
Quality of life (QOL) in AMD patients was evaluated in several previous studies whose results indicated that the health-related and vision-related QOL were significantly associated with AMD [11-14]. However, these studies are also mostly from developed Western countries; no studies have been conducted in East Asia, particularly in Korea.
Therefore, to identify depressive symptoms and QOL among Korean AMD patients and to also identify associat- ed factors that predispose AMD patients to develop de- pression, we used the data acquired from the fifth Korea National Health and Nutritional Examination Survey V-2 (KNHANES V-2) performed to sample households that represent the entire nation of Korea in 2011.
Materials and Methods
Design and study population
The KNHANES is a nationwide population-based sur-
vey of the health and nutritional status of non-institution- alized Korean people. It began in 1998, and surveys were conducted in 1998, 2001, and 2005, and also in 2007–2009 and 2010–2012. A stratified, multi-stage, clustered proba- bility design was used to select a representative sample of civilian, non-institutionalized Korean adults. The KN- HANES consists of three parts: (1) a Health Interview Survey, (2) a Health Examination Survey, and (3) a Nutri- tional Survey. The Health Interview Survey was adminis- tered to all study participants, but the Health Examination Survey and Nutritional Survey were administered to only approximately one-third of the participants who were randomly selected from those who completed the Health Interview Survey. In all, 8,518 individuals participated in the 2011 KNHANES V-2. For our analyses, 2,888 partici- pants were excluded because they did not finish the Health Interview Survey and/or the Health Examination Survey, and 3,790 were excluded because they were younger than 60 years. This left 1,840 people aged 60 years and older who finished the Health Interview Survey and the Health Examination Survey and were therefore eligible for our analyses (Fig. 1).
Fig. 1. Flow diagram of the study participants. KNHANES = Korea National Health and Nutrition Examination Survey; AMD
= age-related macular degeneration.
8,518 KNHANES V-2
1,840 Enrolled patients 2,888
Health Interview Survery (–) Health Examination Survery (–) Exclusion
3,790 Age <60 yr
329 AMD
65 Depressive
symptom (+) 264 Depressive symptom (–)
1,511 Non-AMD Exclusion
This survey was reviewed and approved by the institu- tional review board of the Korea Centers for Disease Con- trol and Prevention (No. 2011-02CON-06-C), and all par- ticipants provided written informed consent.
Measurement
We collected data from the KNHANES V-2 database re- garding various sociodemographic factors obtained through direct interviews using standardized question- naires.
1) Depressive symptoms
In the KNHANES V (2010–2012), the depressive symp- tom group was defined as those who answered “yes” to the following question: “have you felt sorrow or despair that has affected your daily life for more than 2 weeks continu- ously during the past year? [15].” This indicator has been previously used in other KNHANES V studies [16,17].
2) Demographic and health questionnaire
The education levels were divided into “elementary school or less,” “less than middle school,” “high school or less,” and “some university.” Family income was classified into quartiles. Chronic diseases included hypertension, stroke, ischemic heart disease, osteoarthritis, and diabetes.
A participant was classified as having cancer if he or she had received at least one cancer diagnosis. Each disease was defined as “yes” if the participants answered positive- ly to “did a doctor diagnose the disease?” so as to reduce errors from subjective self-diagnoses. Smoking status was classified as “current,” “ex-smoker,” and “never-smoker.”
Drinking frequency was classified into the following groups: “less than once per month,” “1–4 times per month,”
and “more than twice per week.”
For activities of daily living (ADL), “independent” was defined as a response of “no” to the question “do you have any disturbances in everyday life?” “dependent” was de- fined as an answer of “yes” to this same question. The re- spondents’ perceived health was determined using the question “how is your health in general? is it very good, good, average, bad, or very bad?” The participants were dichotomized into two groups based on their answers: one group for those who responded “very good, good, or aver- age” and another group for those who responded “bad or very bad.” The EuroQol was used to evaluate the health-re-
lated QOL. The EuroQol consists of two parts: the health-status descriptive system (EQ-5D) and a visual ana- logue scale (EQ-VAS). The EQ-5D records the level of self-reported problems across five dimensions (mobility, self-care, usual activities, pain/discomfort, and anxiety/de- pression) [18,19]. Each of these dimensions is assessed us- ing a single question with three response levels (no prob- lems, some problems, and extreme problems). A single health index score was calculated from a combination of these items using the Korea valuation set developed by the Korea Centers for Disease Control and Prevention [20].
Scores on the EQ-5D index range from –0.171 to 1, where 1 indicates no problems in any of the five dimensions, zero indicates death, and negative values suggest a health status worse than death. Finally, the respondents described their own health status using a VAS ranging from 0 (worst imaginable health) to 100 (best imaginable health) [18].
3) Ophthalmic examinations and definition of AMD A digital non-mydriatic fundus camera (TRC-NW6S;
Topcon, Tokyo, Japan) was used to obtain fundus photo- graphs. For each participant, one 45° non-mydriatic digital retinal image centered on the fovea was taken per eye for a total of two images per person. The digital images were captured under physiological mydriasis. These images were graded twice (a preliminary grade and a detailed grade) using the grading protocol of the International Age-related Maculopathy Epidemiological Study Group [21]. Patients were defined as having early AMD if they met any of the following criteria: (1) the presence of soft indistinct drusen or reticular drusen or (2) the presence of hard or soft distinct drusen with pigmentary abnormalities (increased pigmentation or hypopigmentation of the retinal pigment epithelium) in the absence of signs of late AMD.
Late AMD included the presence of signs of wet AMD or geographic atrophy. Wet AMD was defined as retinal pig- ment epithelial detachment or serous detachment of the sensory retina, subretinal or sub-RPE hemorrhages, and subretinal fibrous scars. Geographic atrophy was defined as a circular discrete area (at least 175 μm in diameter) of retinal depigmentation with visible choroidal vessels in the absence of signs of wet AMD.
The best-corrected visual acuity was measured at a dis-
tance of 4 m using an international standard vision chart
based on the logarithm of the minimum angle of resolution
(logMAR) scale (Jin’s Vision Chart, Seoul, Korea) [22]. Vi-
sual impairment was defined as a best-corrected visual acuity of 0.32 or worse in the best eye.
Statistical analysis
Descriptive statistical methods were used to describe the basic characteristics of the study population. Numbers and percentages were reported for each variable. The preva- lence of depressive symptoms and the EuroQol indices in AMD patients versus non-AMD age-matched controls were estimated. Differences between those included in the analyses were assessed using the independent-samples t-test for continuous variables, such as age or visual acuity.
For qualitative or categorical variables, such as educational status or gender, we used the chi-square test for analysis.
A two-step, multidimensional approach was used to identify the factors associated with depressive symptoms in AMD patients. First, to identify factors associated with
depressive symptoms, odds ratios and 95% confidence in- tervals (CI) were calculated using univariate logistic re- gression analysis. Second, multivariate logistic regression was used to determine independent associated factors. All associated factors that were identified as affecting depres- sive symptoms by univariate analysis were included in the multivariate analysis to determine which factors were in- dependently associated with depressive symptoms. All sta- tistical tests were performed using PASW ver. 18.0 (SPSS Inc., Chicago, IL, USA).
Results
The prevalence of depressive symptoms in Korean AMD patients
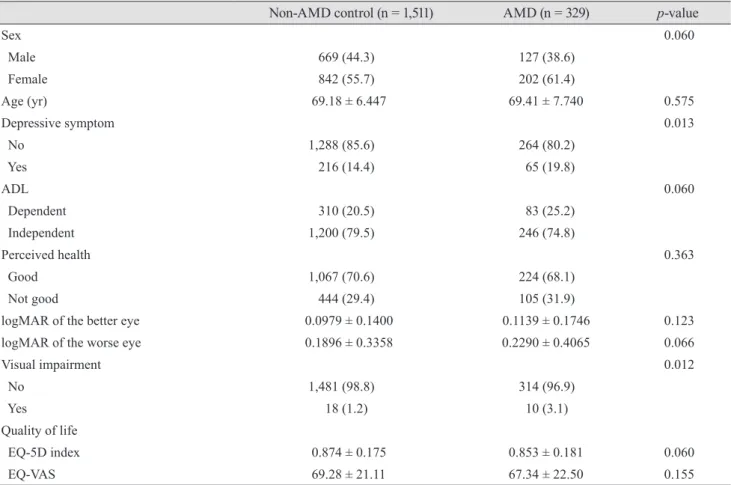
Table 1 provides the baseline characteristics of the study
Table 1. Baseline characteristics of the study population and prevalence of depressive symptoms
Non-AMD control (n = 1,511) AMD (n = 329) p-value
Sex 0.060
Male 669 (44.3) 127 (38.6)
Female 842 (55.7) 202 (61.4)
Age (yr) 69.18 ± 6.447 69.41 ± 7.740 0.575
Depressive symptom 0.013
No 1,288 (85.6) 264 (80.2)
Yes 216 (14.4) 65 (19.8)
ADL 0.060
Dependent 310 (20.5) 83 (25.2)
Independent 1,200 (79.5) 246 (74.8)
Perceived health 0.363
Good 1,067 (70.6) 224 (68.1)
Not good 444 (29.4) 105 (31.9)
logMAR of the better eye 0.0979 ± 0.1400 0.1139 ± 0.1746 0.123
logMAR of the worse eye 0.1896 ± 0.3358 0.2290 ± 0.4065 0.066
Visual impairment 0.012
No 1,481 (98.8) 314 (96.9)
Yes 18 (1.2) 10 (3.1)
Quality of life
EQ-5D index 0.874 ± 0.175 0.853 ± 0.181 0.060
EQ-VAS 69.28 ± 21.11 67.34 ± 22.50 0.155
Values are presented as number (%) or mean ± standard deviation.
AMD = age-related macular degeneration; ADL = activities of daily living; logMAR = logarithm of the minimum angle of resolution.
EQ-5D/mobility
p = 0.084Serious problem Some problem No problem
35.5 1.8 62.7
41.3 2.4 56.2
Non-AMD AMD
100 80 60 40 20 0
EQ-5D/usual activity
p = 0.028Serious problem Some problem No problem
19.9 3.8 76.3
26.3 4.1 69.6
Non-AMD AMD
100 80 60 40 20 0 EQ-5D/self-care
p = 0.466
Serious problem Some problem No problem
11.2 0.9 87.9
13.4 1.2 85.4
Non-AMD AMD
100 80 60 40 20 0
EQ-5D/pain-discomfort
p = 0.005Serious problem Some problem No problem
30.3 6.9 62.8
39.5 6.4 54.1
Non-AMD AMD
100 80 60 40 20 0
EQ-5D/anxiety-depression
p = 0.446Serious problem Some problem No problem
13.8 1.5 84.8
16.4 1.2 82.4
Non-AMD AMD
100 80 60 40 20 0
(%) (%) (%)
(%) (%)
participants and a comparison of the characteristics be- tween AMD patients and non-AMD age-matched controls.
Of the 329 AMD patients, 65 (19.8%) exhibited depressive symptoms. Of the 1,511 non-AMD age-matched controls, 216 (14.4%) had depressive symptoms (p = 0.013).
Health-related QOL in Korean AMD patients
The mean EQ-5D index score was 0.853 for those with AMD and 0.874 for those without AMD (p = 0.060). The mean EQ-VAS score was 67.34 for those with AMD and 69.28 for those without AMD (p = 0.155). Both indices representing the health-related QOL were not significantly different between the two groups.
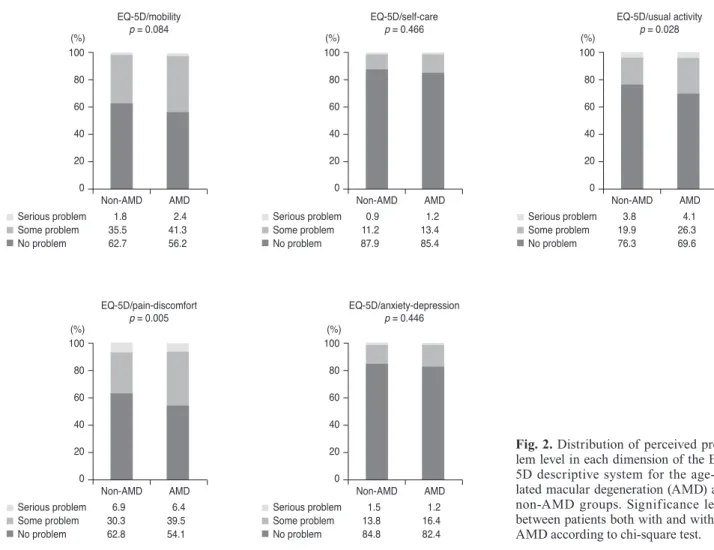
The percentages of participants who had problems with each scale of the EQ-5D index are shown in Fig. 2. Patients with AMD were more likely to have difficulty with usual activities and to experience pain/discomfort than were
controls without AMD. All other scales showed no signifi- cant difference between the two groups.
A comparison of characteristics according to depres- sive symptoms among AMD patients
Table 2 provides a comparison of the characteristics be- tween AMD patients both with and without depressive symptoms. Patients with depressive symptoms were more likely to be female than patients without depressive symp- toms (75.4% vs. 58.0%, p = 0.010). Patients who reported depressive symptoms were more likely to be dependent on others for their ADL than patients without depressive symptoms (56.9% vs. 17.4%, p < 0.001). Those with depres- sive symptoms were also more likely to perceive their health as “bad” than patients without depressive symptoms (55.4% vs. 26.1%, p < 0.001). All EuroQol indices, includ- ing the EQ-5D and EQ-VAS, showed significant differenc-
Fig. 2. Distribution of perceived prob-
lem level in each dimension of the EQ-
5D descriptive system for the age-re-
lated macular degeneration (AMD) and
non-AMD groups. Significance level
between patients both with and without
AMD according to chi-square test.
Table 2. A comparison of the characteristics of AMD patients both with and without depressive symptoms Depressive symptom
p-value
No (n = 264) Yes (n = 65)
Sex 0.010
Male 111 (42.0) 16 (24.6)
Female 153 (58.0) 49 (75.4)
Age (yr) 69.8 ± 7.712 67.86 ± 7.719 0.071
Education 0.179
≤Elementary school 161 (61.0) 45 (69.2)
≤Middle school 33 (12.5) 10 (15.4)
≤High school 48 (18.2) 9 (13.8)
≥University 22 (8.3) 1 (1.5)
Income 0.293
1st (lowest) 77 (29.7) 27 (42.2)
2nd 60 (23.2) 13 (20.3)
3rd 68 (26.3) 11 (20.3)
4th (highest) 54 (20.8) 11 (17.2)
Hypertension 0.778
No 137 (51.9) 35 (53.8)
Yes 127 (48.1) 30 (46.2)
Stroke 0.686
No 253 (95.8) 63 (96.9)
Yes 11 (4.2) 2 (3.1)
IHD 0.182
No 248 (93.9) 58 (89.2)
Yes 16 (6.1) 7 (10.8)
Osteoarthritis 0.076
No 192 (72.7) 40 (61.5)
Yes 72 (27.3) 25 (38.5)
Diabetes 0.518
No 235 (89.0) 56 (86.2)
Yes 29 (11.0) 9 (13.8)
Cancer 0.784
No 254 (96.2) 63 (96.9)
Yes 10 (3.8) 2 (3.1)
Smoking status 0.064
Current smoker 41 (15.4) 7 (10.8)
Ex-smoker 60 (22.8) 8 (12.3)
Non-smoker 162 (61.6) 50 (76.9)
Drinking status 0.890
<1 Times per month 227 (86.3) 55 (84.6)
1–4 Times per month 27 (10.3) 7 (10.8)
≥2 Times per week 9 (3.4) 3 (4.6)
es between patients both with and without depressive symptoms. Other characteristics showed no significant dif- ferences between patients with and without depressive symptoms.
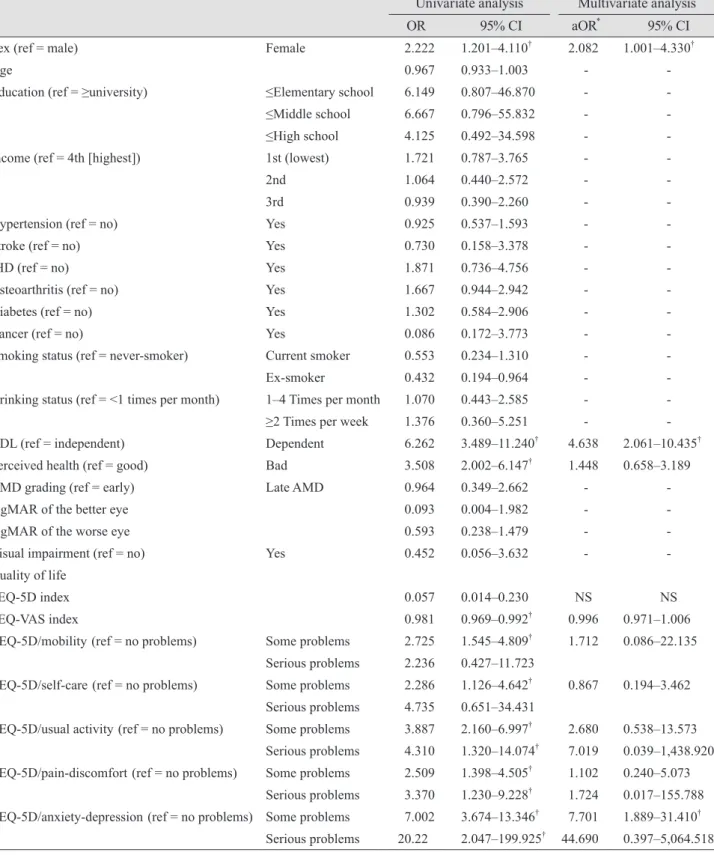
Factors associated with depressive symptoms in Kore- an AMD patients
Table 3 shows the factors associated with depressive symptoms in Korean AMD patients. Univariate logistic re- gression analysis determined that gender, dependency in ADL, perceived health status, and some EuroQol indices were significantly associated with depressive symptoms in Korean AMD patients. Multivariate logistic regression analysis (reported as adjusted odds ratio [aORs]) identified
that gender, dependency in ADL, and having “some prob- lems” on the “anxiety/depression” dimension of the EQ-5D were significantly and independently associated with de- pressive symptoms in Korean AMD patients. The results indicated a relationship between gender and depressive symptoms in Korean AMD patients: women were more likely to have depressive symptoms than men (aOR, 1.96;
95% CI, 1.017 to 3.787). Participants who were in the ADL
“dependent” group were more likely to report depressive symptoms than participants who were in the ADL “inde- pendent” group (aOR, 4.792; 95% CI, 2.493 to 9.211). Par- ticipants with “some problems” on the “anxiety/depres- sion” dimension of the EQ-5D were more likely to have depressive symptoms than participants reporting “no prob- lems” on the “anxiety/depression” dimension of the EQ- Depressive symptom
p-value
No (n = 264) Yes (n = 65)
ADL <0.001
Dependent 46 (17.4) 37 (56.9)
Independent 218 (82.6) 28 (43.1)
Perceived health <0.001
Good 195 (73.9) 29 (44.6)
Bad 69 (26.1) 36 (55.4)
AMD grading 0.944
Early AMD 243 (92.0) 60 (92.3)
Late AMD 21 (8.0) 5 (7.7)
logMAR of the better eye 0.1207 ± 0.1900 0.0857 ± 0.0800 0.154
logMAR of the worse eye 0.2418 ± 0.4251 0.1762 ± 0.3155 0.251
Visual impairment 0.693
No 252 (96.6) 62 (98.4)
Yes 9 (3.4) 1 (1.6)
Quality of life
EQ-5D index 0.875 ± 0.166 0.767 ± 0.209 <0.001
EQ-VAS 69.45 ± 22.18 59.22 ± 22.11 0.001
EQ-5D (no / some / severe problem)
EQ-5D/mobility 61.2 / 36.5 / 2.3 36.9 / 60.0 / 3.1 0.001
EQ-5D/self-care 88.2 / 11.0 / 0.8 75.4 / 21.5 / 3.1 0.018
EQ-5D/usual activity 76.0 / 20.9 / 3.0 44.6 / 47.7 / 7.7 <0.001
EQ-5D/pain-discomfort 58.9 / 35.7 / 5.3 35.4 / 53.8 / 10.8 0.002
EQ-5D/anxiety-depression 89.7 / 9.9 / 0.4 53.8 / 41.5 / 4.6 <0.001
Values are presented as number (%) or mean ± standard deviation.
AMD = age-related macular degeneration; IHD = ischemic heart disease; ADL = activities of daily living; logMAR = logarithm of the minimum angle of resolution.
Table 2. Continued
Table 3. The univariate and multivariate analyses of factors associated with depressive symptoms in Korean AMD patients Univariate analysis Multivariate analysis
OR 95% CI aOR
*95% CI
Sex (ref = male) Female 2.222 1.201–4.110
†2.082 1.001–4.330
†Age 0.967 0.933–1.003 - -
Education (ref = ≥university) ≤Elementary school 6.149 0.807–46.870 - -
≤Middle school 6.667 0.796–55.832 - -
≤High school 4.125 0.492–34.598 - -
Income (ref = 4th [highest]) 1st (lowest) 1.721 0.787–3.765 - -
2nd 1.064 0.440–2.572 - -
3rd 0.939 0.390–2.260 - -
Hypertension (ref = no) Yes 0.925 0.537–1.593 - -
Stroke (ref = no) Yes 0.730 0.158–3.378 - -
IHD (ref = no) Yes 1.871 0.736–4.756 - -
Osteoarthritis (ref = no) Yes 1.667 0.944–2.942 - -
Diabetes (ref = no) Yes 1.302 0.584–2.906 - -
Cancer (ref = no) Yes 0.086 0.172–3.773 - -
Smoking status (ref = never-smoker) Current smoker 0.553 0.234–1.310 - -
Ex-smoker 0.432 0.194–0.964 - -
Drinking status (ref = <1 times per month) 1–4 Times per month 1.070 0.443–2.585 - -
≥2 Times per week 1.376 0.360–5.251 - -
ADL (ref = independent) Dependent 6.262 3.489–11.240
†4.638 2.061–10.435
†Perceived health (ref = good) Bad 3.508 2.002–6.147
†1.448 0.658–3.189
AMD grading (ref = early) Late AMD 0.964 0.349–2.662 - -
logMAR of the better eye 0.093 0.004–1.982 - -
logMAR of the worse eye 0.593 0.238–1.479 - -
Visual impairment (ref = no) Yes 0.452 0.056–3.632 - -
Quality of life
EQ-5D index 0.057 0.014–0.230 NS NS
EQ-VAS index 0.981 0.969–0.992
†0.996 0.971–1.006
EQ-5D/mobility (ref = no problems) Some problems 2.725 1.545–4.809
†1.712 0.086–22.135 Serious problems 2.236 0.427–11.723
EQ-5D/self-care (ref = no problems) Some problems 2.286 1.126–4.642
†0.867 0.194–3.462 Serious problems 4.735 0.651–34.431
EQ-5D/usual activity (ref = no problems) Some problems 3.887 2.160–6.997
†2.680 0.538–13.573 Serious problems 4.310 1.320–14.074
†7.019 0.039–1,438.920 EQ-5D/pain-discomfort (ref = no problems) Some problems 2.509 1.398–4.505
†1.102 0.240–5.073
Serious problems 3.370 1.230–9.228
†1.724 0.017–155.788 EQ-5D/anxiety-depression (ref = no problems) Some problems 7.002 3.674–13.346
†7.701 1.889–31.410
†Serious problems 20.22 2.047–199.925
†44.690 0.397–5,064.518 AMD = age-related macular degeneration; OR = odds ratio; CI = confidence interval; aOR = adjusted odds ratio; IHD = ischemic heart disease; ADL = activities of daily living; logMAR = logarithm of the minimum angle of resolution; NS = not significant.
*