† 교신저자:권민택(전북대학교 경영학부) E-mail:[email protected] TEL:063-270-4585
FAX:063-270-2985
기업이미지에 대한 환경친화적 CI 비쥬얼 디자인의 효과
The Effect of Green-oriented CI Visual Design on Corporate Image
나광진*ㆍ박혜상*ㆍ권민택†
Na, Kwang Jin*ㆍPark, Hye Sang*ㆍKwon, Min Taek†
브루넬 대학교 디자인공학부*
School of Engineering & Design, Brunel University, London, UK
전북대학교 경영학부†
Dept. of Business Administration, Chonbuk National University
Abstract : The purpose of this research was to identify the difference between expected and actual corporate image in the market and to verify the possibility of green-oriented corporate identity (CI) visual design as a useful method for communicating with consumers. In addition, this research suggests how green-oriented CI visual design can effectively convey corporate image to consumers.
The methods of research used to achieve this aim were case studies and questionnaire surveys. In regard to the results, the difference between consumers’perceived favourable corporate image and companies’ expectation about corporate image was found. Moreover, the results show that green-oriented visual identity (VI) design can improve corporate image. In turn, the gap between the expected and actual perception of corporate image can be decreased through green-oriented design.
Based on these results, a method of effective development for green-oriented VI design is recommended.
Key words: corporate image, corporate identity (CI), visual identity (VI), CI green design.
1. Introduction
New products are introduced to the market every day, and consumers evaluate these products based on various criteria. Of these criteria, corporate image is the most important, more influential than other criteria such as quality or price. When consumers purchase a product, they make their purchasing decisions based more on corporate image than the primary attributes or features of the product (Dick et al., 1990). In addition, consumer criticism of company policies leads to consumers tending to distrust a company that has not been responsible in their duty of care and sense of social responsibility, and purchasing products for reasons other than superior quality and high brand reputation (Brown and Dacin, 1997).
Therefore, as many companies make desperate efforts to establish a favourable image for themselves in the market, the management of corporate image is becoming increasingly important. There are, however, two questions inherent in corporate image management. The first is how to build up or improve upon that corporate image, and second, how to convey that enhanced corporate image to the market.
Regarding the development of a positive corporate image, many companies consider being
"eco-friendly" to be an important issue.
Today’s global environment is threatened by such issues as global warming, the destruction of the ozone layer, and pollution.
Moreover, the number of "green consumers" who are motivated by environmental conservation is growing.
Indeed, the starting point for addressing environmental issues is consumers perceiving the seriousness of environmental contamination. Such recognition prompts companies to introduce green marketing campaigns, and re-establishing a "green" corporate image.
Many companies are now paying attention to being "eco-friendly" in order to create a favourable corporate image. However, companies need a green communication strategy to introduce an eco-friendly corporate image. If companies do not respect or reflect the changes in the market or respond to these changes over time, they will suffer significant losses.
Green communication strategy should be developed into an effective corporate management strategy, which considers societies and environments beyond their basic marketing plan.
Regarding the question of conveying their corporate image to the market, more companies are paying attention to the visual design of corporate identity (CI) in order to convey their image to their market. CI is a management activity involving the creation and management of corporate image as a
whole, from corporate ideology to visualization, and is a communication tool to convey corporate philosophy to consumers. Visual elements such as symbol, logo, colour and slogan are the main methods to convey corporate image to consumers, because visual information is the most important way for consumers to acquire information.
Characteristics of visual identity (VI), which is a part of CI, such as familiarity, memorability and salience, help consumers to memorize corporate image. Therefore, VI plays an important role, not only in creating a company’s image in the market, but also in bridging the perceptual gap between companies and consumers.
To summarize, despite the growth in the importance of corporate image, many companies have experienced problems in creating a positive image and delivering it to the market.
Therefore, the goal of this research is to identify these problems by exploring the difference between expected and actual corporate image in the market, and verifying the possibility of green-oriented CI visual design as a useful method for communicating with consumers. Finally, this research suggests how to effectively use green-oriented CI visual design to convey corporate image to consumers.
2. Theoretical Background
2.1 Eco-friendly Management
With the recent interest in environmental issues, a "green" trend has emerged in products and advertisements. Companies use
"eco-friendly"in their product names in order to present a better, cleaner image. There has been a green marketing boom in electronic goods, automobiles, chemicals, the financial industry, the distribution industry, the construction industry and the food industry, as many companies are introducing green concepts such as non-pollution, no preservatives, natural materials and recycling. These phenomena mean that companies are trying to create an eco-friendly image.
The purpose of the eco-friendly management of corporations is to contribute to environmental protection and enhance corporate competitiveness through environmental preservation activities. When companies make an effort to solve environmental problems together with concerned consumers, they can establish an eco-friendly management system that society will acknowledge. Consequently, they not only address environmental problems, but also create a favourable image among consumers who are sensitive to the environment. The success of corporate image management therefore increasingly lies in creating and
perpetuating an eco-friendly image.
2.2 The Visual Identity for Corporate Image
CI is made up of planned or unplanned verbal and visual factors that communicate with the public. While it is the difference between companies that identify their styles, CI provides a standard for the maintenance of products and image, and to give employees a set of rules. CI can help the company build its own image andstyle. Thus, the purpose of VI is to develop a design symbolising CI in all the fields in which a company works, which must be approved by both management and society. The development of this design concept is a creative management activity (Lee, 1990).
The main functions of VI are as follows:
1) Helps to demonstrate that a specific part belongs to the company.
2) A complete design concept will result in a long-lasting cumulative effect.
3) Helps the company to identify and integrate a clear image.
Saddoris (1988) noticed that most Korean companies do not have the ability to present a positive image to consumers. He argued that a good symbol and logo must be maintained for
at least 25 years, so effective research is essential for the success of CI.
CI must use consistent visual materials, presenting a VI that is friendly, easy to read and remember, and raises the company’s reputation;
from there, increased profit and development may follow. Employees and consumers are strongly influenced by visual elements, therefore CI strategy must pay close attention to symbol, logo, slogan, colour and brand.
2.3 The Necessity of Green-oriented VI Design for Making a
Favourable Corporate Image
The importance of CI increases when green design strategy has great purchasing power and influences consumers. Demonstrating interest in environmental preservation assists in establishing a friendly representation of the company to consumers (Yeo, 1995), therefore communicating with consumers using a green image is an excellent method of establishing a company’s eco-friendly reputation, which increases differentiation with competing companies. However, it takes a long time to deliver a green-oriented company image to consumers. Effective VI design is the best method.
Companies now adopt marketing strategies that communicate interest in the environment using VI. The colour green, representing nature, has come to represent a company’s eco-friendly
attitude, which leads environmentally conscious consumers to purchase eco-friendly products. Many companies have therefore implemented a green-oriented VI design strategy.
A green-oriented VI design strategy raises a company’s reputation and develops a sense of reliability. For example, Korean company Pulmuone’s symbol is a green curve, which represents the preservation of the environment and signifies a bowl containing nature. In addition, well-known coffee shop Starbucks uses green to suggest their concern for the environment. Thus, green-oriented VI design plays an important role in helping customers to recognise eco-friendly companies (Breaem, 1985).
3. Research Questions
The purpose of this study is to identify the problems with conveying corporate image to consumers, and to provide companies with effective VI design strategies to reduce the difference between the perception of companies (expected level) and consumers (actual level) regarding corporate image. This is achieved through investigating the effect of green-oriented VI design on corporate image, analysing the VI design of Korean companies, and the VI strategies of global companies that
carry out eco-friendly management.
For the purpose of this research, we build up following research questions.
① Is there the difference between expected and actual image of companies in the market?
② Is there the relationship between environmental and favourable image of companies?
③ Do Consumers perceive VI elements designs of Korean companies as green-oriented designs?
④ Can consumers’ perception of green-oriented visual identity (colour, brand, logo, slogan and symbol) design influence
companies’ image and
consumers’ preference?
4. Methodology
This research is composed of three studies. In study 1, two types of surveys were conducted in order to investigate the differences between the perception of consumers and companies regarding corporate image. In study 2, a survey was conducted to investigate not only the relationship between companies’environmental and favourable images, but also the consumers’perception of the VI design of Korean companies. Finally, a survey was conducted and the effects of green-oriented VI design upon
corporate image and the preference for and perception of the product quality of the companies was tested in study 3.
5. Study 1
The purpose of this study is to find the gap between expected corporate image and actual corporate image in the market. Two times of surveys were conducted to investigate the perception of consumers and companies about corporate images.
5.1 Stimuli
Three Korean companies that are well-known in Korea market were chosen randomly in out of top 10 companies, because the respondents for surveying consumers’ perception of companies had to associate images of companies easily.
5.2 Sample
① Survey with employees of three companies: The sample was 105 employees in three Korean companies (35 employees in each company). The average length of services was 5.7 years and working places of respondents were marketing and design department.
② Survey with consumers: The sample selected for this survey
was 50 undergraduate students from Korea. In terms of the demographic distribution of the respondents, 50% were male and 50% were female, and the mean age was 23. The students studied a wide range of subjects.
5.3 Measure
① Measure for survey with companies: The expectancy of employees about corporate images of their companies were measured on a seven-point scale (1 = not at all, 7 = very much) of the degree to which 1) expected level of consumers’ likeness about our company, 2) expected level of consumers’ favourable feeling about our company, 3) expected level of consumers’ positive feeling about our company. The scale in Muehling’s study (1987) was adapted to measure the preference of companies.
② Measure for survey with consumers: In order to compare the gap between the perception of companies and consumers, three items which are same as the measure of survey with companies were used. The perception of consumers about corporate images of three companies were measured on a seven-point scale (1 = do not agree at all, 7 = strongly agree) of the degree to
which consumers 1) like each company, 2) when they associate with the company they get a favourable feeling, and 3) when they associate with the company they get a positive feeling.
5.4 Results
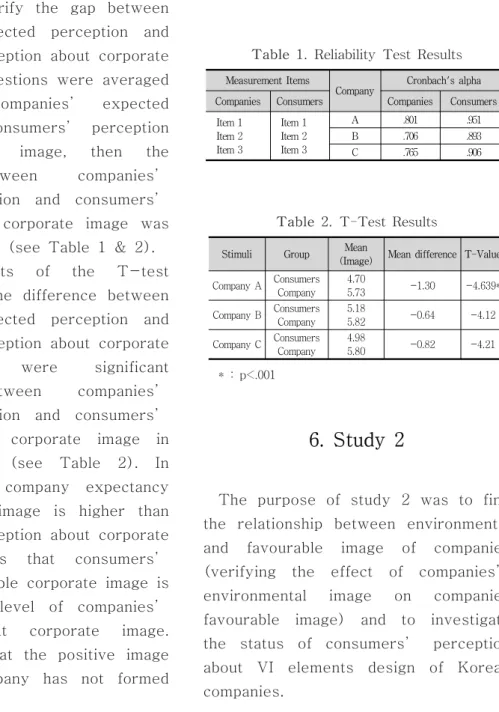
In order to verify the gap between companies’ expected perception and consumers’ perception about corporate image, each 3 questions were averaged and used as companies’ expected perception and consumers’ perception about corporate image, then the difference between companies’
expected perception and consumers’
perception about corporate image was tested by T- test (see Table 1 & 2).
As the results of the T-test concerned with the difference between companies’ expected perception and consumers’ perception about corporate image, there were significant differences between companies’
expected perception and consumers’
perception about corporate image in three companies (see Table 2). In every company, company expectancy about corporate image is higher than consumers’ perception about corporate image. It means that consumers’
perceived favourable corporate image is lower than the level of companies’
expectancy about corporate image.
There seemed that the positive image pursued by company has not formed
properly than that of consumers in the marketplace, and which represents perceive of the company image to the great estrangement within them(see Table 2). Thus, in the first step, the difference between consumers’
perceived favourable corporate image and companies’ expectancy about corporate image was found.
Table 1. Reliability Test Results
Measurement Items
Company Cronbach's alpha Companies Consumers Companies Consumers Item 1
Item 2 Item 3
Item 1 Item 2 Item 3
A .801 .951
B .706 .893
C .765 .906
Table 2. T-Test Results
Stimuli Group Mean
(Image) Mean difference T-Value Company A Consumers
Company 4.70
5.73 -1.30 -4.639*
Company B Consumers Company
5.18
5.82 -0.64 -4.12
Company C Consumers Company
4.98
5.80 -0.82 -4.21
* : p<.001
6. Study 2
The purpose of study 2 was to find the relationship between environmental and favourable image of companies (verifying the effect of companies’
environmental image on companies favourable image) and to investigate the status of consumers’ perception about VI elements design of Korean companies.
6.1 Pilot Study (Finding words relating environment)
To investigate whether consumers perceive companies as the environmental companies, respondents were asked to indicate the degree to which each company could match with words relating environment. In addition, in order to investigate whether consumers perceive VI elements designs of companies as the green-oriented design, respondents were asked to indicate the degree to which each VI design (logo, symbol, colour and slogan) could be related to words relating environment.
In order to generate words relating environment, a free-association task was conducted. 50 respondents were asked to write down the word that first came to mind when thinking about environment. 4 words (green, clean, eco-friendly, well-being) which were answered most frequently were selected.
6.2 Main Survey 6.2.1 Survey Design
The criteria for selecting companies were famousness and whether they have well-established VI such as logo, symbol, colour and slogan. 20 Korean companies which were satisfied with these criteria were selected as stimuli.
In order to avoid fatigue of
respondents, four different questionnaires were developed and information of VI design of five different companies was included in each questionnaire. Therefore, every respondent was exposed to 5 companies and 5 VI elements designs (symbol, logo, slogan, colour and brand) which mean 25 stimuli (5 companies * 5 VI elements designs).
The sample selected for study constituted 240 undergraduate students from a Korean university. They were randomly assigned to one of the four different questionnaires (60 respondents in each questionnaire). In terms of the demographic distribution of the respondents, 52% were male and 48% were female, and the mean age was 22. The students studied a wide range of subjects.
Respondents were asked to indicate the degree to which the image of each company could match with four words which are related to environment (green, Clean, eco-friendly, well-being). Respondents were also asked to indicate the degree to which each VI design (logo, symbol, colour, slogan and brand) could match with four words relating environment.
6.2.2 Results
6.2.2.1 The Relationship between the Company’s Eco-friendly Image and Favourable Image
The company’s eco-friendly image
was measured with four items (eco-friendly, green, well-being, and clean) which were found in pilot study.
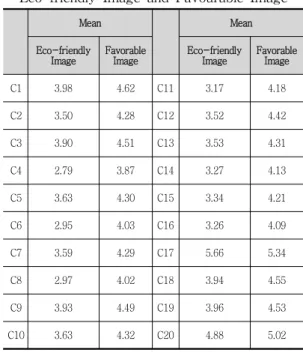
The company’s favorable image was measured with three items (the degree of likeness, favourable feeling and positive feeling). To explore the relationship between a company’s eco-friendly image and favourable image, this study verified the discrepancy between two variable’s values which was summated and averaged (see Table 3&4).
The results show that there are similar patterns in values of eco-friendly image and favourable image which means when the companies’ eco-friendly images are high, the companies’ favourable images are also high (see Figure 1).
To test the relationship between eco-friendly image and favourable image of companies, correlation analysis with means of eco-friendly and favourable image of 20 companies was run. The results show that Pearson correlation value between eco-friendly image and favourable image was significantly high (person correlation value=.989, p<.001). It means that the better a company’s eco-friendly image is, the higher the company’s favourable image is.
Table 3. The Results of Cronbach’s Alpha Test
Cronbach's alpha Cronbach's alpha
Eco-friendly
Image Favorable
Image Eco-friendly
Image Favorable Image
C1 .785 .870 C11 .722 .902
C2 .720 .854 C12 .804 .927
C3 .614 .860 C13 .799 .926
C4 .844 .920 C14 .824 .870
C5 .826 .920 C15 .841 .895
C6 .787 .821 C16 .904 .885
C7 .618 .912 C17 .763 .891
C8 .836 .875 C18 .839 .925
C9 .741 .892 C19 .767 .885
C10 .820 .891 C20 .789 .935
Table 4. The Mean Comparison of Eco-friendly Image and Favourable Image
Mean Mean
Eco-friendly
Image Favorable
Image Eco-friendly
Image Favorable Image
C1 3.98 4.62 C11 3.17 4.18
C2 3.50 4.28 C12 3.52 4.42
C3 3.90 4.51 C13 3.53 4.31
C4 2.79 3.87 C14 3.27 4.13
C5 3.63 4.30 C15 3.34 4.21
C6 2.95 4.03 C16 3.26 4.09
C7 3.59 4.29 C17 5.66 5.34
C8 2.97 4.02 C18 3.94 4.55
C9 3.93 4.49 C19 3.96 4.53
C10 3.63 4.32 C20 4.88 5.02
Figure 1. The relationship between eco-friendly image and favourable image
6.2.2.2 VI Design Elements of Korean Companies
In order to understand consumers’
perception of the eco-friendliness of the VI design elements of Korean companies, consumer perception of every VI design element of the 20 Korean companies was analysed. The results show that consumers’
perception of the eco-friendliness of the logos of the 20 companies is lower than the other VI design elements. In overall, VI design elements of two companies (C16 and C18) are perceived to be more eco-friendly than the others in four words which are related to eco-friendliness (see Table 5-9).
Table 5. Mean of Symbol Image Eco-friendly Green Well-being Clean
C1 3.90 2.85 5.24 4.98
C2 3.83 4.93 3.47 4.68
C3 5.00 5.24 4.25 4.92
C4 2.90 2.56 3.14 3.47
C5 2.90 3.15 2.59 3.63
C6 3.08 3.63 3.53 4.69
C7 3.93 3.63 4.12 4.63
C8 2.81 2.63 3.07 3.83
C9 2.86 3.22 3.42 4.25
C10 3.31 3.12 3.54 4.29
C11 3.13 2.63 3.83 4.33
C12 4.82 3.73 4.03 4.55
C13 3.30 3.03 3.40 3.90
C14 2.90 3.10 3.35 4.30
C15 3.37 3.27 3.13 4.00
C16 5.20 6.17 5.64 5.69
C17 3.59 3.17 4.32 4.61
C18 4.76 4.54 4.54 5.39
C19 3.85 3.63 3.81 4.31
C20 4.10 4.07 3.63 4.46
Table 6. Mean of Logo Image Eco-friendly Green Well-being Clean
C1 1.92 2.15 3.32 4.05
C2 2.08 2.56 2.46 3.42
C3 2.78 3.46 2.85 3.97
C4 2.24 2.19 2.51 3.14
C5 2.36 2.54 2.31 3.07
C6 2.32 3.20 3.20 4.25
C7 2.76 2.98 3.53 4.14
C8 2.53 2.51 2.71 3.56
C9 4.36 4.29 4.31 4.00
C10 2.73 2.88 2.97 3.78
C11 2.20 2.58 2.75 3.33
C12 2.87 2.82 2.98 3.55
C13 2.43 2.63 2.87 3.50
C14 2.65 2.90 2.92 3.65
C15 2.72 2.92 2.60 3.48
C16 3.59 4.59 4.76 5.29
C17 3.15 3.02 3.85 4.31
C18 3.42 3.86 4.03 4.78
C19 3.03 3.05 3.42 3.75
C20 3.92 4.02 3.42 4.29
Table 7. Mean of Colour Image Eco-friendly Green Well-being Clean
C1 2.02 2.46 4.49 3.83
C2 2.02 2.44 2.54 3.05
C3 2.58 2.83 3.31 3.64
C4 3.25 2.61 3.61 3.25
C5 2.47 3.15 2.47 3.24
C6 2.73 3.19 3.95 4.34
C7 3.19 3.17 3.88 4.34
C8 2.75 2.63 3.08 3.75
C9 3.80 4.14 4.34 3.97
C10 3.25 2.98 3.37 3.36
C11 3.38 3.77 4.43 4.20
C12 3.23 3.18 3.83 3.72
C13 3.25 3.23 3.92 3.83
C14 2.73 2.98 3.27 3.60
C15 3.05 3.03 3.50 3.62
C16 4.47 5.63 5.54 5.59
C17 3.58 3.17 4.80 4.59
C18 5.20 4.66 4.83 5.63
C19 3.73 3.41 3.76 3.93
C20 3.76 3.85 3.61 4.24
Table 8. Mean of Slogan Image Eco-friendly Green Well-being Clean
C1 3.86 3.20 4.73 4.88
C2 3.66 4.73 3.66 4.34
C3 4.29 4.80 4.20 4.63
C4 2.51 2.36 2.49 2.97
C5 3.25 3.63 2.86 3.76
C6 3.44 3.32 3.73 4.44
C7 3.49 3.17 3.75 4.02
C8 2.75 2.53 2.86 3.59
C9 4.27 4.27 4.22 3.88
C10 2.80 2.76 3.05 3.46
C11 2.77 2.60 3.05 3.75
C12 3.22 3.08 3.25 3.65
C13 2.68 2.75 3.03 3.60
C14 3.33 3.08 3.23 4.10
C15 3.17 3.08 2.95 3.87
C16 4.71 5.66 5.15 5.46
C17 2.92 2.64 3.76 3.88
C18 4.81 4.39 4.31 5.22
C19 4.00 3.46 3.81 3.83
C20 4.29 4.05 3.85 4.63
Table 9. Mean of Brand Image Eco-friendly Green Well-being Clean
C1 3.31 2.97 4.97 4.69
C2 3.14 4.08 3.07 3.75
C3 3.69 4.17 3.66 4.10
C4 2.85 2.41 2.93 3.00
C5 2.68 3.02 2.63 3.49
C6 2.98 3.39 3.76 4.42
C7 3.14 3.17 3.81 4.27
C8 2.81 2.61 2.90 3.59
C9 3.63 3.92 4.10 4.10
C10 2.98 2.88 3.14 3.71
C11 3.10 3.02 3.88 4.10
C12 3.50 3.38 3.50 3.75
C13 3.12 2.95 3.28 3.73
C14 2.88 3.12 3.30 4.07
C15 3.12 3.15 3.03 3.75
C16 5.44 5.88 5.63 5.73
C17 3.54 3.36 4.37 4.53
C18 4.85 4.59 4.56 5.53
C19 3.59 3.39 3.69 3.88
C20 3.92 3.90 3.49 4.56
7. Study 3
The purpose of study 3 is to verify if the successful green-oriented VI design can decrease the gap between the expected corporate image (company’s perception) and the actual corporate image (consumers’
perception). For this purpose, a field survey conducted and the effects of the green-oriented visual identity (VI) design on corporate image, preference and perception of the product quality of companies was tested. If the positive relationship between the green-oriented VI design and corporate image is found, it could suggest that
green-oriented VI design can decrease the gap between the expected and actual perception of corporate image, because corporate image can be increased by the green-oriented VI design in market.
Two Korean companies which were perceived as the eco-friendly company from the Study 2 were chosen. The data about consumers’ perception about green-oriented VI design of these companies was collected.
7.1 Survey Design
It was found that two companies were perceived as the most eco-friendly company by consumers in Study 2. In addition, the VI elements designs of these companies were perceived as the green-oriented design highly compared to other companies’
VI design. Thus, two Korean companies were selected as stimuli to investigate the effects of the green-oriented visual identity(VI) design on corporate image, preference and perception of the product quality of companies.
The sample selected for study was 250 undergraduate students from a Korean university. In terms of the demographic distribution of the respondents, 65% were male and 35%
were female, and the mean age was 23.
The perception of consumers about VI design of companies were measured on a seven-point scale (1 = do not agree at all, 7 = strongly agree) of the
degree to which consumers think 1) that each VI design (brand, logo, symbol, colour and slogan of a company) is eco-friendly, and 2) that each VI design is highly concerned for the environment.
7.2 Measure
The preference of companies was measured on a seven-point scale (1 = do not agree at all, 7 = strongly agree) of the degree to which consumers 1) like each company, 2) when they associate with the company they get a favourable feeling, and 3) when they associate with the company they get a positive feeling.
The perception of the eco-friendly image of companies was measured on a seven-point scale (1 = do not agree at all, 7 = strongly agree) of the degree to which consumers think, 1) the company is highly concerned for the environment, and 2) the company behaves responsibly regarding the environment.
The perception of the quality of the products was measured on a seven-point scale (1 = do not agree at all, 7 = strongly agree) of the degree to which consumers think 1) the quality of the products of the company is good, and 2) the quality of the products of the company is better than the quality of the products of other companies.
7.3 Results
Cronbach’s alpha was calculated to assess the reliability of each concept.
The resulting values were high, which indicates high levels of internal reliability. Table 11 shows the results of the reliability test.
To test the relationship between the perception of VI element design and company’s outcomes such as the perception as an eco-friendly company, company’s preference and the quality of a company’s product, correlation analysis was run. The results show that every Pearson correlation value between the design of VI elements and company’s outcomes was significantly high in two companies. Also there are strong relationships between the perception of VI elements design and the company’s outcomes(see Table 10).
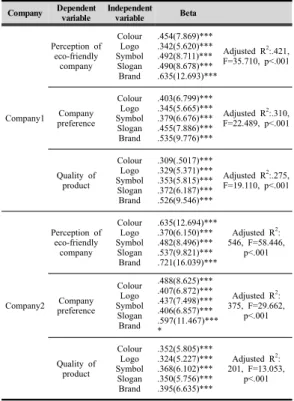
In addition, to determine the incremental impact of the perception about VI elements design on company’s outcomes, multiple regression analysis was run. Table 13 reports the results from a multiple regression on company outcome (perception as an eco-friendly company, company’s preference, and the quality of the company’s products) in which the independent variables (perception of the degree of eco-friendly colour, logo, symbol, slogan, and brand) were included.
As the results show, there were
significant positive effects of perception about VI elements design on a company’s outcomes for every company (see Table 12). These results show that VI elements design such as colour, logo, symbol, slogan and brand can influence a company’s outcomes.
In other words, green-oriented VI design can increase the perception of eco-friendly company, company’s preference, and the quality of a company’s products. Therefore, it can be concluded that the green-oriented VI design can improve the corporate image, in turn, the gap between the expected and actual perception of corporate image can be decreased by the green-oriented design.
Table 10. Correlations Matrix Company1
Colour Symbol Logo Slogan Brand Eco Preference Quality
Colour 1
Symbol .834***a) 1
Logo .528*** .516*** 1
Slogan .559*** .554*** .781*** 1 Brand .692*** .677**** .546*** .642*** 1 Eco .531*** .527*** .498*** .551*** .609*** 1 Preference .273*** .239*** .218*** .236*** .326*** .524*** 1 Quality .288*** .292*** .121* .140** .276*** .436*** .717*** 1
Company2
Colour Symbol Logo Slogan Brand Eco Preference Quality
Colour 1
Symbol .628*** 1
Logo .437*** .440*** 1
Slogan .413*** .528*** .457*** 1 Brand .589*** .610*** .450*** .616*** 1 Eco .454*** .492*** .342*** .490*** .635*** 1
Preference .403*** .397*** .345*** .455*** .535*** .693*** 1 . Quality .309*** .353*** .329*** .372*** .526*** .600*** .798*** 1
Company Measurement items Cronbach’s Alpha
Company 2
Colour is eco-friendly
Colour of is highly concerned for the environment .940 Logo is eco-friendly
Logo is highly concerned for the environment .957 Symbol is eco-friendly
Symbol is highly concerned for the environment .970 Slogan is eco-friendly
Slogan is highly concerned for the environment .943 Company 2 is a green brand
Company 2 is highly concerned for the
environment .933
Company 2 is highly concerned for the environment
Company 2 is a company that behaves responsibly regarding the environment
.923
I like Company 2
When I associate with Company 2, I get a favourable feeling
When I associate with Company 2, I get a positive feeling
.935
The quality of products of Company 2 is good The quality of products of Company 2 is better than the quality of products of other companies .911
Table 11. Reliability Test Results
Company Measurement items Cronbach’s
Alpha
Company 1
Colour is eco-friendly
Colour is highly concerned for the environment .898 Logo is eco-friendly
Logo is highly concerned for the environment .879 Symbol is eco-friendly
Symbol is highly concerned for the environment .944 Slogan is eco-friendly
Slogan is highly concerned for the environment .921 Company 1 brand is a green brand
Company 1 brand is highly concerned for the
environment .925
Company 1 is highly concerned for the environment Company 1 behaves responsibly regarding the
environment .894
I like Company 1
When I associate with Company 1, I get a favourable feeling
When I associate with Company 1, I get a positive feeling
.891
The quality of products of Company 1 is good The quality of products of Company 1 is better than the quality of products of other companies .883
Table 12. The Results of the Regression Test
Company Dependent
variable Independent variable Beta
Company1
Perception of eco-friendly
company Colour SymbolLogo Slogan Brand
.454(7.869)***
.342(5.620)***
.492(8.711)***
.490(8.678)***
.635(12.693)***
Adjusted R2:.421, F=35.710, p<.001
Company preference
Colour Logo Symbol Slogan Brand
.403(6.799)***
.345(5.665)***
.379(6.676)***
.455(7.886)***
.535(9.776)***
Adjusted R2:.310, F=22.489, p<.001
Quality of product
Colour Logo Symbol Slogan Brand
.309(.5017)***
.329(5.371)***
.353(5.815)***
.372(6.187)***
.526(9.546)***
Adjusted R2:.275, F=19.110, p<.001
Company2
Perception of eco-friendly
company Colour
Logo Symbol Slogan Brand
.635(12.694)***
.370(6.150)***
.482(8.496)***
.537(9.821)***
.721(16.039)***
Adjusted R2: 546, F=58.446,
p<.001
Company preference
Colour Logo Symbol Slogan Brand
.488(8.625)***
.407(6.872)***
.437(7.498)***
.406(6.857)***
.597(11.467)***
*
Adjusted R2: 375, F=29.662,
p<.001
Quality of product
Colour Logo Symbol Slogan Brand
.352(5.805)***
.324(5.227)***
.368(6.102)***
.350(5.756)***
.395(6.635)***
Adjusted R2: 201, F=13.053,
p<.001
Note: a t-value
*** p<0.01 ** p<0.05 * p<0.1
8. Discussion
8.1 The Significant Gap between Expected and Actual Perception of Corporate Image
Corporate image management is becoming more important. In the fierce competition of the international market, companies need to make a constant effort to attract consumers’ attention.
The success of corporate in the future lies in corporate image management.
Corporate image is the one of the most important criteria to evaluate and purchase products.
Therefore, there is a close positive correlation between corporate image and corporate revenue and success.
Therefore, every company want to build up favourable corporate image in the market.
However, as this study found, there is the big difference between the images which is pursued by companies and the images which is perceived by consumers. It means this gap causes the leakage of consumers in the market and companies which have this difference in their market can loose actual and potential consumers.
Therefore, it is very important for a company to find an effective tool which can increase the favourable corporate image up to the level which the company pursues. As the results of this study show, making the eco-friendly corporate image can improve the favourable corporate image and it can fill up the difference between pursued and actual corporate image. In addition, to build up the eco-friendly image, green-oriented VI elements (symbol, logo, colour, slogan, and brand) design can be a useful tool.
9. Managerial Implications
This study focused upon VI element design strategy and verified that green-oriented VI design can decrease the gap between expected and actual
image of company in the market.
According to the results of this study, the following guidelines for corporate image management through green oriented VI design strategy are proposed.
Firstly, eco-friendly image makes the company develop corporate activities more effectively and plays an important role in enhancing corporate image according to strategic intentions.
Green-oriented VI design strategy is an effective tool to make the brand recognizable to consumers and to enhance corporate value as an eco-friendly company. Although companies can emphasize environmental protection aspects of individual products, it is better and more economical to compose a corporate image that performs green marketing with the effective VI elements design.
This means that all the efforts to deliver an eco-friendly message should be through VI design strategy. This will play an important role in ensuring the company is remembered as an eco-friendly company.
Secondly, green design strategy for VI elements such as brand, symbol, colour, slogan and logo can be tools that perform important roles in corporate green image composition. As consumers get most of their information from visual elements, symbol, logo, character and colour become very important tools. Through green-oriented VI design strategies,