Introduction
The anterior cruciate ligament (ACL) plays an important role in the stability of the knee joint, and ACL injuries are increas
ing with the recent increase in athletic activities and traffic ac
cidents
1). An ACL injury increases instability of the knee joint and causes damage to the cartilage and meniscus, leading to early arthritic changes
2). Therefore, early diagnosis and treatment of an ACL rupture is important for improving prognosis. The early diagnosis rate of ACL ruptures was found to be 19.2%, which is higher than 9.2% reported in the past but still very low
2,3). This is because it is difficult to measure knee joint laxity owing to pa
tients’ pain and physicians’ inexperience
4).
For the diagnosis of an ACL rupture, the Lachman test (30°
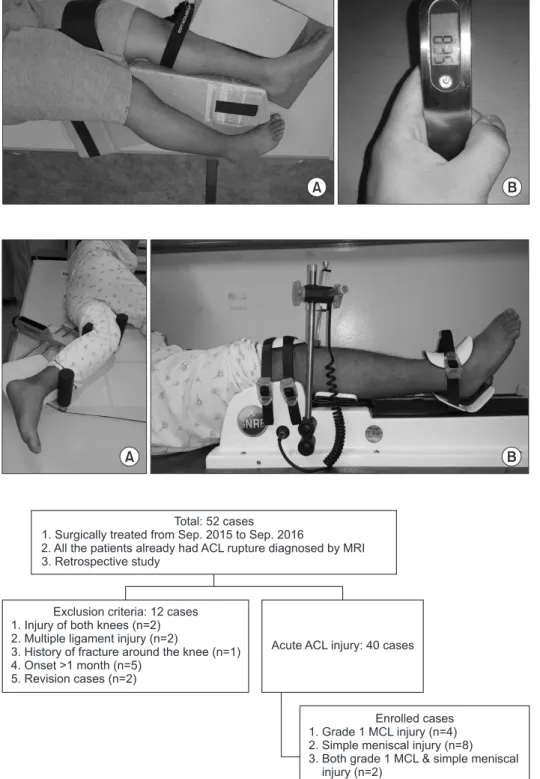
stress physical examination) (Fig. 1) and stress radiography us
ing a Telos device (GmbH, Hungen, Germany) (Fig. 2A) are commonly used
5,6). Since the Lachman test is a manual test, it is subject to errors depending on the applied strength and posture and thus has a low degree of reproducibility
7,8). The Telos test is more reproducible and objective than the Lachman test, but it has the disadvantage of exposing the patient to radiation and potentially damaging the ACL during test. Recently, the GNRB arthrometer (Genourob, Laval, France) was introduced to solve these problems, and it is now possible to measure laxity of the knee joint quickly and accurately without exposure to radiation or application of an excessive force (Fig. 2B)
9). There have been some reports that the GNRB is a useful tool for evaluation and followup of patients with ACL injuries
10,11). However, to the best of our knowledge, no previous study comparing the diagnostic accuracy of the GNRB with that of other diagnostic tools used for acute ACL injury has been reported.
The purpose of this study was to compare the accuracy of the GNRB, Lachman test, and Telos test in acute ACL injuries. The hypothesis of this study was that the diagnostic accuracy of the
Diagnostic Tools for Acute Anterior Cruciate Ligament Injury: GNRB, Lachman Test, and Telos
Seung Min Ryu, MD, PhD, Ho Dong Na, MD, and Oog Jin Shon, MD
Department of Orthopedic Surgery, Yeungnam University Medical Center, Daegu, Korea
Purpose: The purpose of this study is to compare the accuracy of the GNRB arthrometer (Genourob), Lachman test, and Telos device (GmbH) in acute anterior cruciate ligament (ACL) injuries and to evaluate the accuracy of each diagnostic tool according to the length of time from injury to examination.
Materials and Methods: From September 2015 to September 2016, 40 cases of complete ACL rupture were reviewed. We divided the time from injury to examination into three periods of 10 days each and analyzed the diagnostic tools according to the time frame.
Results: An analysis of the area under the curve (AUC) of a receiver operating characteristic curve showed that all diagnostic tools were fairly informative. The GNRB showed a higher AUC than other diagnostic tools. In 10 cases assessed within 10 days after injury, the GNRB showed statistically significant sidetoside difference in laxity (p<0.001), whereas the Telos test and Lachman test did not show significantly different laxity (p=0.541 and p=0.413, respectively).
Conclusions: All diagnostic values of the GNRB were better than other diagnostic tools in acute ACL injuries. The GNRB was more effective in acute ACL injuries examined within 10 days of injury. The GNRB arthrometer can be a useful diagnostic tool for acute ACL injuries.
Keywords: Knee, Anterior cruciate ligament, Injury, Diagnosis, GNRB Arthrometer, Telos pISSN 2234-0726 · eISSN 2234-2451
Knee Surgery & Related Research
Received February 21, 2017; Revised June 5, 2017;
Accepted June 14, 2017
Correspondence to: Oog Jin Shon, MD
Department of Orthopedic Surgery, Yeungnam University Medical Center, 170 Hyeonchungro, Namgu, Daegu 42415, Korea Tel: +82536203640, Fax: +82536284020
Email: maestro[email protected]
121
This is an Open Access article distributed under the terms of the Creative Commons Attribution NonCommercial License (http://creativecommons.org/licenses/bync/4.0/) which permits unrestricted noncommercial use, distribution, and reproduction in any medium, provided the original work is properly cited.
Copyright © 2018 KOREAN KNEE SOCIETY
www.jksrr.org
GNRB arthrometer is better than that of the Lachman test and Telos test. We also planned to evaluate the accuracy of each di
agnostic tool according to the time from injury to examination, presence of an accompanying injury, sex, and age.
Materials and Methods
1. Patient Selection
This study was approved by the Institutional Review Board of our hospital. The medical records of all patients (n=52) who
A B
Fig. 1. (A) Lachman test. A 23yearold male was lying on a radiolucent table with the knee positioned in 30° of knee flexion and drawn anteriorly. (16 days after injury).
(B) We conducted the Lachman test at the power of 80 N approximately.
A B
Fig. 2. (A) Telos (GmbH) device. A 19yearold male was lying on a radiolucent table with the knee in 30° of flexion. The tibia was pressed anteriorly. We could mea
sure the displaced distance by radiographic imaging. (20 days after injury) (B) GNRB arthrometer (Genourob). The 19yearold male was lying on the GNRB arthrometer.
The patient’s leg was fixed on the arthrom
eter at 30° of knee flexion. The patient’s tibia was pressed anteriorly and we could check the displaced distance.
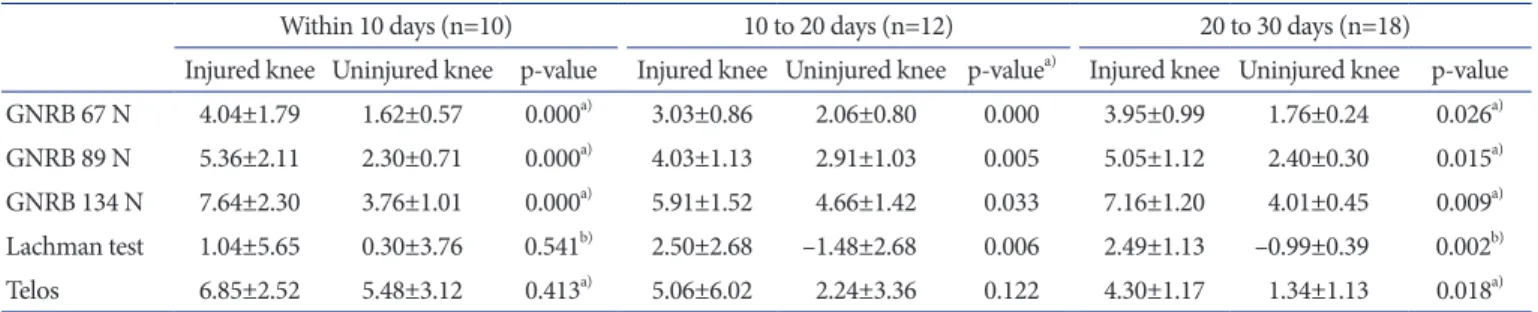
Total: 52 cases
1. Surgically treated from Sep. 2015 to Sep. 2016
2. All the patients already had ACL rupture diagnosed by MRI 3. Retrospective study
Exclusion criteria: 12 cases 1. Injury of both knees (n=2) 2. Multiple ligament injury (n=2)
3. History of fracture around the knee (n=1) 4. Onset >1 month (n=5)
5. Revision cases (n=2)
Acute ACL injury: 40 cases
Enrolled cases 1. Grade 1 MCL injury (n=4) 2. Simple meniscal injury (n=8) 3. Both grade 1 MCL & simple meniscal
injury (n=2)
Fig. 3. Flow diagram of inclusion and ex
clusion of the study participants. ACL:
an te rior cruciate ligament, MRI: magnetic re sonance imaging, MCL: medial collateral liga ment.
were diagnosed with total ACL ruptures by magnetic resonance imaging from September 2015 to September 2016 were reviewed.
An ACL rupture was diagnosed when fibers of the ligament were completely ruptured (grade III injury). Exclusion criteria included injury to both knees (n=2), multiple ligament injury (n=2), history of fracture around the knee (n=1), elapsed time of more than 1 month after injury (n=5), and ACL rerupture (n=2).
However, cases with grade I medial collateral ligament (MCL) injuries (n=4)
12), simple meniscal injuries (n=8), or both (n=2) were included. Finally, 40 patients were selected. The mean age of the patients was 29.6 years (range, 16 to 57 years), and the sex distribution was 26 males and 14 females. The mean time from injury to test was 19.1 days (range, 2 to 30 days). Clinical details of the patients are described in Fig. 3.
2. Laxity Measurement Protocol
All diagnostic tests were performed preoperatively. The Lach
man test and the Telos test were done at 80 N with 30° knee flexion, and the GNRB test was performed continuously from 0 N to 134 N. All patients were examined on both the injured and uninjured knees by two observers independently. To determine the interobserver reliability, the two observers independently measured laxity using all diagnostic tools. The interobserver reliability was analyzed using intraclass correlation coefficients (ICCs) with 95% confidence intervals (CIs).
The Lachman test and Telos test confirmed anterior laxity of
the knee by radiographically measuring displacement of the mid
point between the tangents to the posterior contours of the tibial condyles drawn perpendicular to the tibial plateau and relative to the corresponding midpoint between the 2 posterior aspects of the femoral condyles (Fig. 4)
9). The results of the GNRB were confirmed with a graph (Fig. 5). When performing the Lachman test and Telos test, the examiner did not exert more force on a patient if the patient complained of severe pain. We created stan
dards for the two tests such as strict lateral radiography (posterior intercondylar distance <1 mm), knee flexion of 30°, and match
ing of the two tibial plateau lines.
3. Evaluation of Factors Affecting Diagnosis
We divided the time from injury to test into three 10day inter
vals and analyzed the tools for ACL injury diagnosis according to the time frame (time≤10 days, n=10; 10 days<time≤20 days, n=12; and 20 days<time≤30 days, n=18). In addition, we com
pared the effects of the presence of accompanying injuries such as a simple meniscal tear or a grade I MCL rupture on the ACL injury examination. Sex and age were also evaluated for their ef
fects on ACL injury examination.
4. Statistical Analysis
The means and ranges were calculated for all continuous vari
ables and all statistical analyses were performed using IBM SPSS ver. 23.0 (IBM Co., Armonk, NY, USA). All dependent variables were tested for distribution normality and equality of variances was assessed using the Kolmogorov Smirnov test. The paired
ttest and Wilcoxon ranksum test were used to determine statistical significance in the Lachman test, Telos test, and GNRB
8.77 mm 8.77 mm
3.69 mm 3.69 mm Lachman
Telos
0.02 mm 0.02 mm
0 mm 0 mm
Fig. 4. The Lachman test and the Telos test were performed at 80 N with 30° knee flexion. The anterior laxity of the knee joint is measured by displacement of the midpoint between the tangents to the posterior contours of the tibial condyles drawn perpendicular to the tibial plateau and relative to the location of the corresponding midpoint between the 2 posterior aspects of the femoral condyles.
0 50 100 150 200 250 300
Injured side
Healthy side
0 20
15
10
Displacement(mm) 5
GNRB results
Force (N) GNRB
Fig. 5. GNRB (Genourob) results graph. The GNRB test was performed continuously from 0 N to 134 N in both knees.
test between the injured knee and the uninjured knee. Correla
tions between the possible influencing factors and the diagnostic tools were also evaluated by Pearson correlation coefficient. The diagnostic value of each diagnostic tool was evaluated by analy
sis of the area under the curve (AUC) of a receiver operating characteristic (ROC) curve: null (AUC=0.5), poorly informative (0.5≤AUC<0.7), fairly informative (0.7≤AUC<0.9), highly infor
mative (0.9≤AUC<1), or perfect (AUC=1)
13). All statistical analy
ses were done using IBM SPSS ver. 23.0 (IBM Co.), and p<0.05 was considered statistically significant.
Results
1. General Accuracy of Each Diagnostic Tool
All diagnostic tools detected differences in laxity between the two sides at statistically significant levels (Table 1). The mean laxities measured by the GNRB arthrometer with three testing forces of 67 N, 89 N, and 134 N (GNRBs) were 3.83 mm, 4.95 mm, and 7.00 mm, respectively, in the injured knees, and 1.87 mm, 2.58 mm, and 4.18 mm, respectively, in the uninjured knees (all p=0.000). In the Lachman test, the mean laxity was 2.52 mm in injured knees and –0.26 mm in uninjured knees (p=0.000).
Using the Telos device, the mean laxity was 3.13 mm in injured
knees and 0.72 mm in uninjured knees (p=0.003).
The AUC analysis showed that all diagnostic tools were fairly informative. The GNRBs had higher AUCs than did the Telos and Lachman tests, so GNRBs were more reliable than the other diagnostic tools.
2. Accuracy of Each Diagnostic Tool according to Possible Influencing Factors
In the 10 cases examined within 10 days after injury, the GN
RBs showed statistically different laxity between the two sides (all p=0.000), but the Telos and Lachman tests did not show sta
tistically significant differences in laxity (p=0.541 and p=0.413, respectively) (Table 2). In the 12 cases examined between 10 and 20 days after injury, the GNRBs and Lachman test showed statistically significant differences in laxity between the two sides (p=0.000, p=0.005, and p=0.033 for the GNRB at 67 N, 89 N, and 13 N, respectively and p=0.006 for the Lachman test), but the Telos test did not show a statistically significant sidetoside difference in laxity (p=0.122). In the 18 cases examined from 20 to 30 days after injury, all diagnostic tools showed statistically significant differences in laxity between the two sides (p=0.026, p=0.015, and p=0.009 for the GNRB at 67 N, 89 N, and 13 N, respectively, p=0.002 for the Lachman test, and, p=0.018 for the
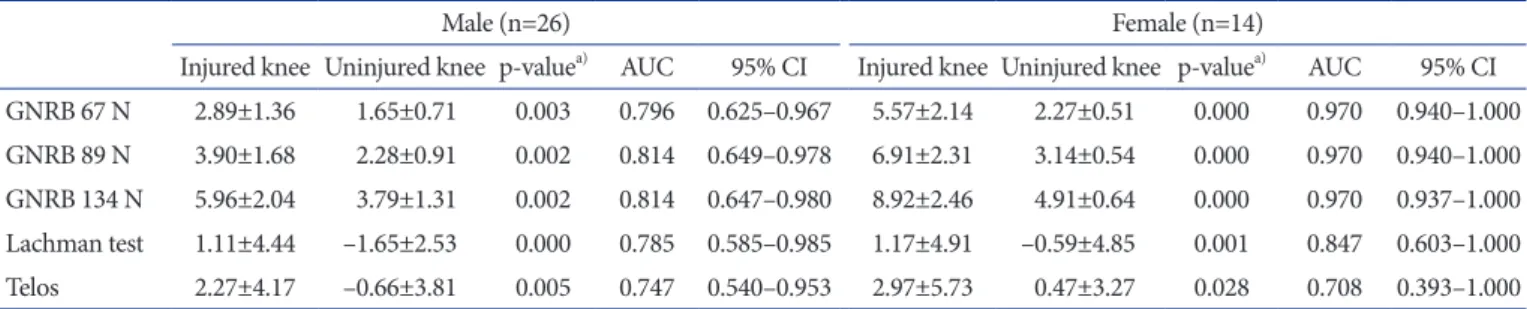
Table 2. SidetoSide Difference in Laxity (mm) on All Diagnostic Tools according to Time of Examination
Within 10 days (n=10) 10 to 20 days (n=12) 20 to 30 days (n=18)
Injured knee Uninjured knee pvalue Injured knee Uninjured knee pvaluea) Injured knee Uninjured knee pvalue GNRB 67 N 4.04±1.79 1.62±0.57 0.000a) 3.03±0.86 2.06±0.80 0.000 3.95±0.99 1.76±0.24 0.026a) GNRB 89 N 5.36±2.11 2.30±0.71 0.000a) 4.03±1.13 2.91±1.03 0.005 5.05±1.12 2.40±0.30 0.015a) GNRB 134 N 7.64±2.30 3.76±1.01 0.000a) 5.91±1.52 4.66±1.42 0.033 7.16±1.20 4.01±0.45 0.009a) Lachman test 1.04±5.65 0.30±3.76 0.541b) 2.50±2.68 –1.48±2.68 0.006 2.49±1.13 –0.99±0.39 0.002b) Telos 6.85±2.52 5.48±3.12 0.413a) 5.06±6.02 2.24±3.36 0.122 4.30±1.17 1.34±1.13 0.018a) Values are presented as mean±standard deviation.
a)Paired ttest.
b)Wilcoxon rank sum test.
Table 1. SidetoSide Difference in Laxity and AUC on All Diagnostic Tools in All Cases
Injured knee (mm) Uninjured knee (mm) pvaluea) AUC 95% CI
GNRB 67 N 3.83±2.09 1.87±0.70 0.000 0.826 0.700–0.953
GNRB 89 N 4.95±2.39 2.58±0.90 0.000 0.833 0.708–0.957
GNRB 134 N 7.00±2.59 4.18±1.24 0.000 0.840 0.714–0.966
Lachman test 2.52±4.71 –0.26±3.63 0.000 0.779 0.620–0.937
Telos 5.13±4.55 0.72±3.50 0.003 0.736 0.566–0.906
Values are presented as mean±standard deviation.
AUC: area under the curve, CI: confidence interval.
a)Paired ttest.
Telos test).
Regardless of the presence of a combined injury, all diagnostic tools showed significant differences in laxity between the two sides (Table 3). The AUC analysis showed that the diagnostic tools were fairly to highly informative in patients with combined injuries, and poorly to fairly informative in patients with isolated ACL injuries.
Regardless of sex, all diagnostic tools showed statistically signif
icant differences in laxity between the two sides, and knee joint relaxation tended to be greater on both the injured and the un
injured sides in women (Table 4). The AUC analysis showed that the diagnostic tools were fairly to highly informative in female patients and only fairly informative in male patients.
On the correlation analysis between age and diagnostic tools, only the GNRBs showed statistically significant correlation for detection of ACL injuries (for testing forces of 67 N, 89 N, and 134 N, the correlation coefficients were 0.551, 0.523, and 0.501, respectively and p=0.012, p=0.018, and p=0.025, respectively).
However, the Lachman test and Telos test showed no statistically significant correlations with age in the injured knees. In addition, in the uninjured knees, no statistically significant correlations were found between the diagnostic tools and age.
3. Inter-Observer Reliability
The ICCs for interobserver reliability in the assessment of lax
ity using all five diagnostic tools are summarized in Table 5. ICCs ranged from 0.853 to 0.972. The GNRBs showed slightly higher ICCs than did other diagnostic tools.
Discussion
The most important objective of this study was to compare the accuracy of the Lachman test, Telos test, and GNRB test in acute
Table 3. SidetoSide Difference in Laxity (mm) and AUC on All Diagnostic Tools according to Accompanied Meniscus or MCL injury Isolated anterior cruciate ligament injury (n=26) Combined injury (n=14)
Injured knee Uninjured knee pvaluea) AUC 95% CI Injured knee Uninjured knee pvaluea) AUC 95% CI GNRB 67 N 3.66±2.23 1.93±0.71 0.000 0.790 0.614–0.966 4.12±1.85 1.74±0.70 0.000 0.918 0.772–1.000 GNRB 89 N 4.80±2.60 2.66±0.95 0.000 0.805 0.635–0.974 5.22±2.00 2.44±0.81 0.000 0.918 0.772–1.000 GNRB 134 N 6.98±2.90 4.31±1.32 0.000 0.822 0.656–0.989 7.04±2.00 3.94±1.08 0.000 0.878 0.689–1.000 Lachman test 0.88±4.58 –1.64±3.09 0.012 0.760 0.559–0.961 5.56±3.32 2.28±3.22 0.000 0.861 0.634–1.000 Telos 4.72±4.65 2.22±4.23 0.023 0.674 0.450–0.897 5.90±4.41 1.50±0.91 0.012 0.931 0.768–1.000 Values are presented as mean±standard deviation.
AUC: area under the curve, MCL: medial collateral ligament, CI: confidence interval.
a)Paired ttest.
Table 4. SidetoSide Difference in Laxity (mm) and AUC on All Diagnostic Tools according to Sex Distribution
Male (n=26) Female (n=14)
Injured knee Uninjured knee pvaluea) AUC 95% CI Injured knee Uninjured knee pvaluea) AUC 95% CI GNRB 67 N 2.89±1.36 1.65±0.71 0.003 0.796 0.625–0.967 5.57±2.14 2.27±0.51 0.000 0.970 0.940–1.000 GNRB 89 N 3.90±1.68 2.28±0.91 0.002 0.814 0.649–0.978 6.91±2.31 3.14±0.54 0.000 0.970 0.940–1.000 GNRB 134 N 5.96±2.04 3.79±1.31 0.002 0.814 0.647–0.980 8.92±2.46 4.91±0.64 0.000 0.970 0.937–1.000 Lachman test 1.11±4.44 –1.65±2.53 0.000 0.785 0.585–0.985 1.17±4.91 –0.59±4.85 0.001 0.847 0.603–1.000 Telos 2.27±4.17 –0.66±3.81 0.005 0.747 0.540–0.953 2.97±5.73 0.47±3.27 0.028 0.708 0.393–1.000 Values are presented as mean±standard deviation.
AUC: area under the curve, CI: confidence interval.
a)Paired ttest.
Table 5. Intraclass Correlation Coefficients (ICCs) for InterObserver Reliability in the Assessment of Laxity Using All Diagnostic Tools
Injured knee Uninjured knee
ICC 95% CI ICC 95% CI
GNRB 67 N 0.924 0.797–0.972 0.939 0.790–0.983 GNRB 89 N 0.987 0.966–0.995 0.936 0.834–0.975 GNRB 134 N 0.972 0.922–0.990 0.941 0.780–0.984 Lachman test 0.872 0.782–0.951 0.853 0.793–0.945
Telos 0.891 0.803–0.958 0.882 0.821–0.957
CI: confidence interval.