Tuberc Respir Dis 2012;73:210-218
CopyrightⒸ2012. The Korean Academy of Tuberculosis and Respiratory Diseases. All rights reserved.
Urine Cotinine for Assessing Tobacco Smoke Exposure in Korean:
Analysis of the Korea National Health and Nutrition Examination Survey (KNHANES)
Sungmo Jung, M.D., In Seon Lee, M.D., Sae Byol Kim, M.D., Chan Soo Moon, M.D., Ji Ye Jung, M.D., Young Ae Kang, Ph.D., Moo Suk Park, Ph.D., Young Sam Kim, Ph.D., Se Kyu Kim, Ph.D., Joon Chang, Ph.D., Eun Young Kim, M.D.
Division of Pulmonology, Department of Internal Medicine, Severance Hospital, Yonsei University College of Medicine, Seoul, Korea
Background: The level of urine cotinine is an indicator of tobacco smoke exposure. The purpose of this study is to investigate urine cotinine for the purpose of assessing the smoking status of Korean smokers and non-smokers exposed to tobacco smoke.
Methods: The subjects were identified from the 2007-2009 and the 2010 data sets of the Korea National Health and Nutrition Examination Survey (KNHANES). They were assigned as non-smokers, current smokers and ex-smokers. Non-smokers were also divided into three subset groups according to the duration of smoke exposure.
Each group was stratified by gender prior to analysis.
Results: The median value of urine cotinine in the male current smokers was 1,221.93 ng/mL which was the highest among all groups. The difference between levels of urine cotinine for male and the female groups was statistically significant (p<0.01). In the female group, passive smoke exposure groups reported higher urine cotinine levels than non-exposure groups (p=0.01). The cutoff point for the discrimination of current smokers from non-smokers was 95.6 ng/mL in males and 96.8 ng/mL in females. The sensitivity and specificity were 95.2% and 97.1%, respectively, in males, 96.1% and 96.5% in females. However, the determination of urine cotinine level was not useful in distinguishing between passive smoke exposure groups and non-exposure groups.
Conclusion: Urine cotinine concentration is a useful biomarker for discriminating non-smokers from current smokers.
However, careful interpretation is necessary for assessing passive smoke exposure by urine cotinine concentration.
Key Words: Urine; Cotinine; Smoking; Tabacco Smoke Pollution
Address for correspondence: Eun Young Kim, M.D.
Department of Internal Medicine, Yonsei University College of Medicine, 50, Yonsei-ro, Seodaemun-gu, Seoul 120-752, Korea
Phone: 82-2-2228-2267, Fax: 82-2-393-6884 E-mail: [email protected]
Received: Jul. 31, 2012 Revised: Sep. 3, 2012 Accepted: Sep. 26, 2012
CCIt is identical to the Creative Commons Attribution Non-Commercial License (http://creativecommons.org/licenses/by-nc/3.0/).
Introduction
Smoking, which includes second-hand smoke, is a significant risk factor for various diseases such as can- cers, respiratory diseases, heart problems and various
forms of stroke
1-3. It also contributes to the patients' death in most cases
4. Therefore, exact assessments of the epidemiology of normal populations associated with current smoking status or second-hand smoke are im- portant to control disease and set up public health poli- cy
4,5.
Although there are many reports to investigate tobac-
co smoke exposure, most of assessments are based on
self-reported questionnaires. However, there are some
limitations in these measures because some respondents
answer inaccurately about their smoking habits
5-7.
Wilcox et al.
6showed that true percentage of previous
smokers who actually had quit smoking was between
46% and 53% by biological marker studies. Therefore,
objective methods to estimate smoking status and sec- ond-hand smoke exposure are needed.
There are many toxic metabolites in tobacco, which have been suggested as biomarkers to assess tobacco smoke exposure. For example, thiocyanate, carbon monoxide, carboxyhemoglobin, hydroxyprolin and ar- omatic amines can be used. However most of these bio- markers have a low specificity and sensitivity because they are influenced by environmental factors
8,9. There- fore, they are not considered to good markers.
Cotinine is major proximate metabolite of nicotine, which is oxidized in the liver by CYP2A6 and dis- tributed in various body fluids including the blood, sali- va and urine
10. Moreover, cotinine has a much longer half-life (16 to 20 hours) than nicotine (2 hours)
1,9and presents higher concentrations in body fluids than nic- otine
11. Therefore, cotinine is considered a good bio- marker to distinguish non-smokers from current smok- ers
12and urinary cotinine is a preferred marker because urine can be obtained easily and non-invasively. How- ever, Signorello et al.
13reported that urinary cotinine level was different for various ethnic backgrounds. In Korea, there are several studies about the usefulness of urinary cotinine to assess tobacco smoke exposure in a small number of subjects
5,14. The purpose of this study is to investigate the role of urine cotinine for assessing the smoking status of people exposed to tobacco smoke in Korean based on large population study, Korea National Health and Nutrition Examination Survey (KNHANES) investigated from 2007 to 2010.
Materials and Methods
In this study, we use the data set of KNHANES IV (2007∼2009) and the first year of KNHANES V (2010).
The KNHANES is a nationwide survey that included 500 survey areas drawn from the census populations and housing units by considering the proportion of each subgroup. This survey was executed by the Centers of Disease Control (CDC) of Korea to get statistically reli- able and representative data, which include health, food, and lifestyle of the Korean population. Trained
interviewers administered a questionnaire on the smok- ing status and other health information. There were 9 questions and 7 sub-questions about smoking and 33,829 subjects answered those questions. Subjects' age was reclassified to 4 subsets (18∼24, 25∼44, 45∼64, and ≥65).
Smoking status was divided to three groups: non- smokers, current smokers, and ex-smokers. Non-smok- ers included both never smokers and smokers who had smoked under 100 cigarettes in their lifetime. Non- smokers were also divided to three groups according to their passive tobacco exposure time: non-exposure, exposure less an hour, and exposure over an hour per day groups. Tobacco smoke exposure was investigated at the working place and home. If subjects were ex- posed to tobacco smoke for less an hour in both places, we assigned them as the exposures for over an hour group.
On the other hand, we are able to assume that the urine cotinine concentration is higher in the men be- cause a lot of men tend to smoke more than women.
This hypothesis suggests the cutoff value to distinguish smokers from non-smokers can be different between men and women. Therefore each group was stratified by gender before analysis.
There were 33,829 subjects who replied on their smoking-related questions. According to the above cri- teria, 14,315 (42.3%), 4,973 (14.7%), and 3,088 (9.1%) subjects were assigned to the non-smokers, current smokers, and ex-smokers, respectively. In the same way, 14,315 subjects who answered the questionnaires, the subjects with non-exposure, exposure for less an hour, and over an hour group were assigned to 159 (1.1%), 770 (5.4%), and 1,673 (11.7%) persons, respec- tively.
Urine cotinine level was measured by gas chromatog- raphy mass spectrometry using the Perkin Elmer Clarus 600T (PerkinElmer, Turku, Finland). All data were measured in a standardized manner and reviewed by central quality control center.
All statistical analyses were performed with SAS ver-
sion 9.2 (SAS Institute Inc., Cary, NC, USA). The differ-
Table 1. Characteristics of subjects stratified by smoking status
Non-smoker Current smoker Ex-smoker p-value
Sex, n (%)
Male 2,151 (15.03) 4,237 (85.20) 2,646 (85.69)
Female 12,164 (84.97) 736 (14.80) 442 (14.31)
Age, mean±SD, n (%)
18∼24 816 (6.25) 259 (5.71) 61 (2.16)
25∼44 4,776 (36.59) 2,154 (47.53) 800 (28.27)
45∼64 4,536 (34.75) 1,449 (31.97) 1,024 (36.18)
≥65 2,925 (22.41) 670 (14.78) 945 (33.39)
Cotinine, median value (IQR)*, ng/mL
Male 5.31 (14.59) 1,221.93 (1,257.00) 8.14 (23.71) <0.01
Female 4.49 (14.93) 822.93 (926.80) 7.83 (38.35) <0.01
*Urine cotinine is expressed median value (IQR) because it does not follow a normal distribution.
n: a total number of subjects; SD: standard deviation; Cotinine: level of urine cotinine; IQR: interquartile range.
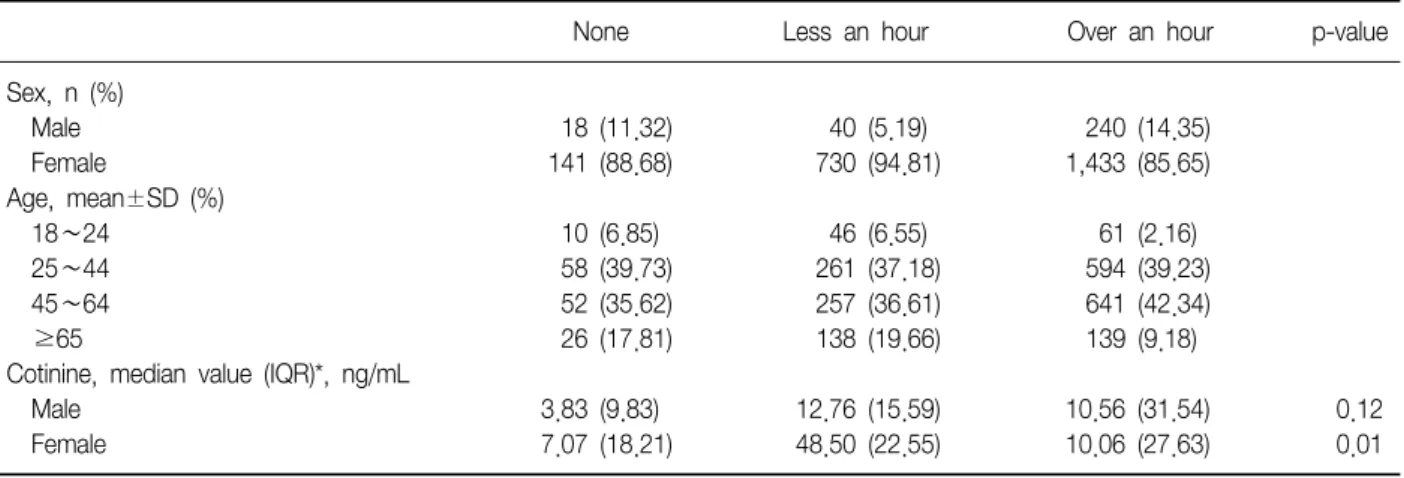
Table 2. Duration of daily passive smoke exposure among non-smokers
None Less an hour Over an hour p-value
Sex, n (%)
Male 18 (11.32) 40 (5.19) 240 (14.35)
Female 141 (88.68) 730 (94.81) 1,433 (85.65)
Age, mean±SD (%)
18∼24 10 (6.85) 46 (6.55) 61 (2.16)
25∼44 58 (39.73) 261 (37.18) 594 (39.23)
45∼64 52 (35.62) 257 (36.61) 641 (42.34)
≥65 26 (17.81) 138 (19.66) 139 (9.18)
Cotinine, median value (IQR)*, ng/mL
Male 3.83 (9.83) 12.76 (15.59) 10.56 (31.54) 0.12
Female 7.07 (18.21) 48.50 (22.55) 10.06 (27.63) 0.01
*Urine cotinine is expressed median value (IQR) because it does not follow normal distribution.
n: a total number of subjects; SD: standard deviation; Cotinine: level of urine cotinine; IQR: interquartile range.
ence of urine cotinine level between each group was analyzed by the Kruskal-Wallis test because the level of urine cotinine did not follow a normal distribution. The statistical significance was considered by the p-value of less than 0.05. Logistic regression analysis and receiver operating characteristic (ROC) curve estimated the cutoff point to discrinimate between current smokers and non-smokers. The cutoff point was determined by Youden method.
Results
There were 9,034 men (40.4%) and 13,342 women
(59.6%) in the final study population. Current smokers
and ex-smokers were predominant in the male pop-
ulation−85.2% and 85.7%, respectively. The portions
of non-smokers were much higher (85.0%) in the
female. The mean age was 48.9 (±16.6). The age of
most subjects was between 25 and 64. Urine cotinine
level ranged from 0.009 ng/mL to 7,817.46 ng/mL. The
median value of urine cotinine was highest in the cur-
rent smokers (1,177.39 ng/mL). Men had higher coti-
nine level than women in all three groups. The median
value and interquartile range of blood urea nitrogen and
creatinine were similar in all groups. Other character-
istics are summarized in Table 1.
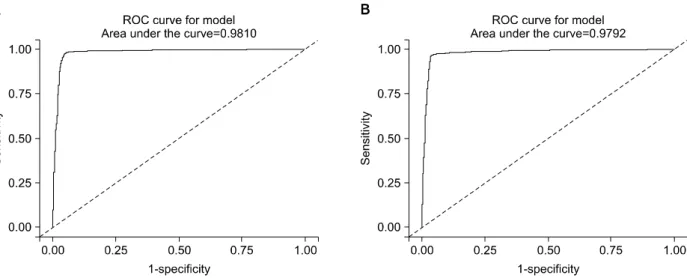
Figure 1. (A, B) Median values for urine cotinine among non-smokers, current smokers and ex-smokers.
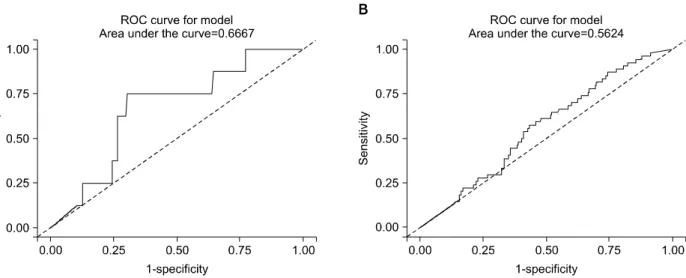
Figure 2. (A, B) Median values for urine cotinine between non-exposure and passive exposure status in non-smokers.
Two thousand and six hundred two subjects of the 14,315 non-smokers replied with their tobacco smoke exposure rate. A higher rate of smoke exposure was observed in females for both less an hour and over an hour exposure groups. The median value of urine coti- nine was highest in the tobacco smoke exposure over an hour groups, 10.22 ng/mL. These details are in Table 2.
The median value of urine cotinine was significantly
different among the groups sorted by smoking status (p
<0.01). In the analysis of the subgroups divided ac- cording to the gender, all groups had shown statistical distinction (p<0.01). The current smokers had higher level of urine cotinine compared with that of the other groups (Table 1, Figure 1).
Among the non-smokers, we found that the duration
of tobacco smoke exposure could be possible to attrib-
ute to the level of urine cotinine (p<0.01). However,
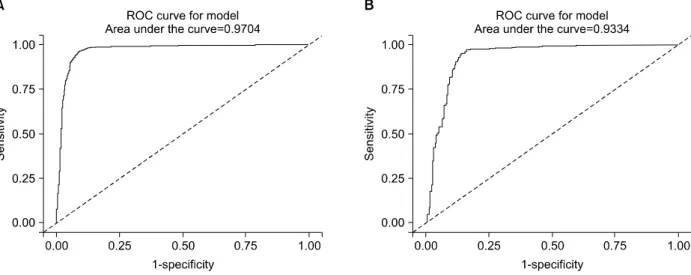
Figure 3. The receiver operating characteristic (ROC) curves of urine cotinine for determining the cutoff value used to distinguish between current smokers and non-smokers. (A) The curve represents the male group and (B) the curve represents the female group.
Table 3. The cutoff values of urine cotinine used to dis- tinguish non-smokers from smokers
Variables Error rate (%)
Cutoff value (ng/mL)
Sensitivity (%)
Specificity (%)
Male 95.5 95.2 97.1
FPR* 2.9 (71/2,476) FNR† 4.8 (60/1,259)
Female 96.8 96.1 96.5
FPR 3.5 (13/370) FNR 3.9 (232/5,920)
*FPR expressed rate (total subjects with less cutoff/true smok- ers). †FNR expressed rate (total subjects with over cutoff/true non-smokers).
FPR: false positive rate; FNR: false negative rate.
Table 4. The cutoff values of urine cotinine used to dis- tinguish ex-smokers from smokers
Variables Error rate (%)
Cutoff value (ng/mL)
Sensitivity (%)
Specificity (%)
Male 94.2 96.5 90.6
FPR* 6.7 (173/2,578) FNR† 4.7 (71/1,528)
Female 91.5 95.4 85.3
FPR 9.4 (37/394) FNR 6.3 (13/208)
*FPR expressed rate (total subjects with less cutoff/true smok- ers). †FNR expressed rate (total subjects with over cutoff/true non-smokers)
FPR: false positive rate; FNR: false negative rate.