Received: August 5, 2019, Revised: August 21, 2019, Accepted: August 29, 2019 eISSN 2233-7679
†Correspondence to: SooJeong Hwang, https://orcid.org/0000-0003-4725-1512
Department of Dental Hygiene, College of Medical Science, Konyang University, 158 Gwanjeodong-ro, Seo-gu, Daejeon 35365, Korea Tel: +82-42-600-8444, Fax: +82-42-600-8408, E-mail: denthwang@konyang.ac.kr
Copyright © The Korean Society of Dental Hygiene Science.
Analysis of Some Online Questions with High Frequency about Dental Treatment in Korea
A-Reum Kang, Ye-Eun Go, Ka-Eun Kim, Min-Joo Kim, Seon-Jeong Kim, and SooJeong Hwang
†Department of Dental Hygiene, College of Medical Science, Konyang University, Daejeon 35365, Korea
Background: The Internet has advantages in terms of accessibility and amount of information, and the search for health information over the Internet
is increasing exponentially. The purpose of this study is to analyze the information generated about some dental treatment on the internet by year.
Methods: Naver Knowledge (JisikIn in Korean) which is an interactive search service was selected as the first search site in Korea. Scaling, wisdom
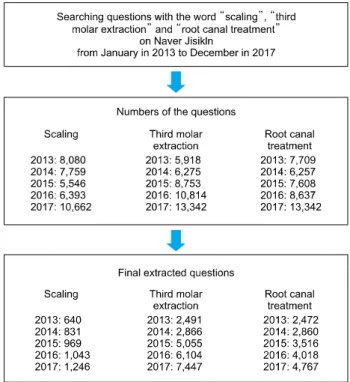
tooth extraction, and endodontic treatment that can be paid by Korean health insurance were selected. Finally, 4,729 questions about scaling, 23,963 wisdom teeth extraction questions and 17,733 endodontic treatment questions were extracted. The question contents, the information about the questioner and the answerer, and an error of answers were investigated. Frequency analysis was used and chi-square test was used if necessary.
Results:
The most frequently asked questions were discomfort and dissatisfaction after the treatment. The need for treatment was the second in questions of the wisdom tooth extraction and endodontic treatment, but the health insurance benefit was the second in dental scaling. Most of the questioners didn’t disclose personal information. The public answered the most in 2013∼2014, but the highest percentage of the respondents was experts in 2017. Responses were mostly personal experience, but showed a tendency to decrease with years, and professional knowledge showed an increasing tendency. The error of the answer has also gradually decreased.
Conclusion: Questions about dental care over the Internet are increasing exponentially, experts are responding increasingly, and errors in answers
are decreasing. Nevertheless, it is necessary to pay attention to the related expert group to prevent misinformation.
Key Words: Dental care, Internet, Korea, Online social networking
Introduction
Demand for online health information has increased rapidly due to changes in health awareness owing to the rise in internet usage, expansion of medical supplies, increase in medical knowledge and rights, and improvements in living standards
1). The use of social media to resolve simple daily-life medical problems has become common mostly because of its convenience. It has been shown that online health information is sought mostly by those who start identifying unusual symptoms through self-diagnosis or those who are healthy but are looking to maintain their health
2). However, online health information has issues such as accessibility, poor quality, difficulties in finding
and interpreting the information, and risk of the inform- ation being over-used. In particular, although a great number of websites provide health information, the quality of their information is still questionable
3).
Social media is a service or website that facilitates the
expression of social relationships between people who
share interests or real-world relationships in a virtual
community
4). While there are many online search engines
in Korea, Naver Knowledge (JisikIn in Korean) is the top
ranked one with more than 80% market share, followed by
Daum Knowledge and Nate Knowledge. Naver Knowledge
received 11,532 new questions, and generated 12,427
answers on a single day (November 9, 2015)
5). It provides
a platform for interactions amongst general public, or
Fig. 1. Flow chart of extracting the data in Naver Knowledge.
between general public and experts through questions and answers
4). It has the advantage of providing specific information concisely in accordance with the inquirer’s intention and other users are more likely to obtain the answers needed since the inquirer can select the most reliable answer from among many other answers
4).
Several studies have been conducted on dental treatment
6)or demand for information on dental hygienists
7,8)using Naver knowledge; but it has been a while since these studies were conducted, although the rate of accumulation of data on the internet has increased exponentially every year. It is, therefore, necessary to examine whether the internet has provided the patient with correct dental treatment information. This study aims at analyzing the dental care related questions and answers generated by Naver Knowledge between 2013 and 2017, to investigate errors in the contents, as well as the changing trends in these errors year wise.
Materials and Methods
1. Object and data collection
The subject matter comprised questions posted on Naver Knowledge about dental treatment covered by health insurance. Treatments were classified into period- ontal, restorative, and surgical treatments. Additionally, treatments frequently asked on Naver Knowledge using certain keywords, and that were rarely covered by insurance but frequently performed according to previous research
9-12), were selected. Five-year data collected from January 1, 2013 to December 31, 2017 on Naver Knowledge was studied. The questions and answers were classified using keywords like ‘scaling,’ ‘wisdom tooth extraction,’ and ‘root canal treatment,’ frequently used by the general public from April 1, 2018 to July 10, 2018. The words scaling and neurotherapy are also used in fields other than dentistry. Hence, based on data that the word scaling was used for dogs, cats, dermatology, skin, scalp, resolution, and monitors; moreover, the word “endodontic treatment”
was used for lower back, vertebrae, and brain, and these were excluded after researchers had adequate discussions and literature review was concluded. The questions or answers were searched if a certain term was included, and
only the words found in the questions were extracted for the final analysis. When two or more terms were searched in the same question, researchers discussed the intent of the questions and decided how to categorize them. Fig. 1 illustrates the number of each term retrieved and classified year-wise.
2. Analysis method
This study was designed based on a study by Kim and Lim
13). A month from each year was randomly selected for the first preliminary survey, based on which, the classific- ation criteria were set for the questions, responders, and answers. The answers were classified into three categories:
expert knowledge; personal knowledge and experience;
and dental visit recommendation. Accuracy of these answers
were determined based on references and related knowledge
using 14 textbooks in dental hygiene, including periodont-
ology, oral prophylaxis, oral and maxillofacial surgery,
and dental restoration. Questions were categorized con-
sidering cost, insurance, necessity of treatment, pain during
treatment, pre- and postoperative care, combination with
other treatments, discomfort and complaints after
treatment, treatment outcomes, treatment plan, care after
Fig. 2. Distribution of the contents in Naver Knowledge questions about scaling.
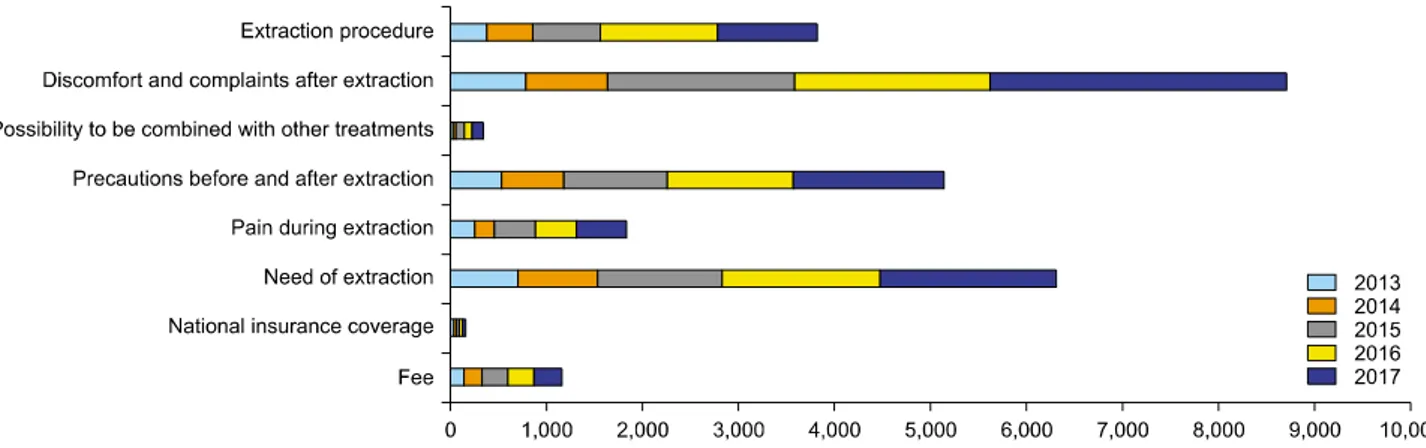
Fig. 3. Distribution of the contents in Naver Knowledge questions about third molar extraction.
treatment, discomfort after treatment discontinuation, and retreatment. Information on inquirers and responders’
characteristics were collected such as responders’ gender and age groups, and information pertaining to whether the responders were anonymous, general public, or experts was assessed. Only dentists and dental hygienists were considered as professional responders.
Both frequency and multiple response analysis were performed using the IBM SPSS ver. 20.0 (IBM Corp., Armonk, NY, USA) program. Chi-square tests were conducted for statistical analysis.
Results
1. Questions on scaling, wisdom tooth extraction, and endodontic treatment in Naver Knowledge from 2013 to 2017
During 2013 to 2017, the most frequently asked questions
on Naver Knowledge regarding scaling were about dis-
comfort and complaints after the procedure, followed by
dental coverage, necessity of scaling, cost, discomfort during
the procedure, treatment outcomes, pre and post-care after
scaling, and possibility of combination with other dental
treatments (Fig. 2). The number of questions pertaining to
insurance coverage and benefits of scaling was highest in
2013, but became less frequent afterwards, as compared to
questions on discomfort and complaints after the procedure.
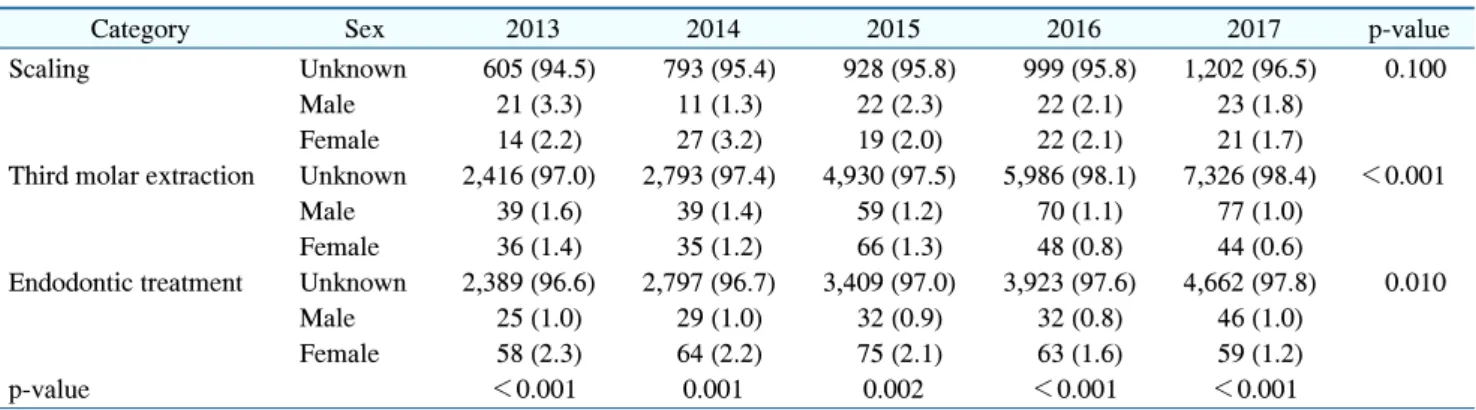
Table 1. Distribution of Sex in the Questioners according to Scaling, Third Molar Extraction, and Endodontic Treatment
Category Sex 2013 2014 2015 2016 2017 p-value
Scaling Unknown 605 (94.5) 793 (95.4) 928 (95.8) 999 (95.8) 1,202 (96.5) 0.100 Male 21 (3.3) 11 (1.3) 22 (2.3) 22 (2.1) 23 (1.8)
Female 14 (2.2) 27 (3.2) 19 (2.0) 22 (2.1) 21 (1.7)
Third molar extraction Unknown 2,416 (97.0) 2,793 (97.4) 4,930 (97.5) 5,986 (98.1) 7,326 (98.4) <0.001 Male 39 (1.6) 39 (1.4) 59 (1.2) 70 (1.1) 77 (1.0)
Female 36 (1.4) 35 (1.2) 66 (1.3) 48 (0.8) 44 (0.6)
Endodontic treatment Unknown 2,389 (96.6) 2,797 (96.7) 3,409 (97.0) 3,923 (97.6) 4,662 (97.8) 0.010 Male 25 (1.0) 29 (1.0) 32 (0.9) 32 (0.8) 46 (1.0)
Female 58 (2.3) 64 (2.2) 75 (2.1) 63 (1.6) 59 (1.2)
p-value <0.001 0.001 0.002 <0.001 <0.001
Values are presented as n (%).
p-values were obtained through
2-test.
Fig. 4. Distribution of the contents in Naver Knowledge questions about endodontic treatment.
The frequency of questions about discomfort and dissatisf- action after wisdom tooth extraction was the highest, followed by necessity of wisdom teeth extraction, pre- and post-care after extraction, treatment or surgery procedure, pain, cost, possibility of other dental treatment parallelly, and benefits and coverage of health insurance (Fig. 3).
Significant yearly changes in frequency of topics regarding wisdom tooth extraction were not observed. For endodontic treatment, the questions on discomfort after the procedure showed the highest frequency, followed by necessity of endodontic treatment, treatment or surgical procedure, pain, pre- and post-care, follow-up treatments, discomfort and retreatment due to discontinuation, possibility of combination with other dental treatments, health insurance
benefits and coverage (Fig. 4). These frequencies changed every year, but no consistent trend was observed.
2. Personal information of inquirers and responders on scaling, wisdom tooth extraction, and endodontic treatment in Naver Knowledge during 2013∼2017 Most of the questioners did not disclose personal in- formation such as gender, hence the frequency of non- disclosure increased slightly over time (Table 1).
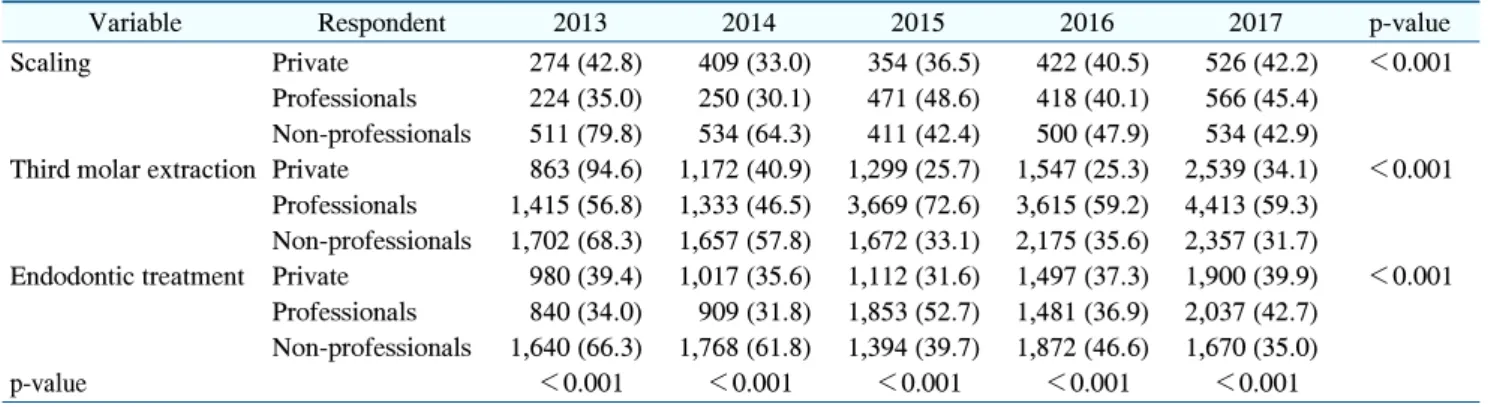
Unlike the responders, more than half of the inquirers
disclosed their personal information (Table 2). The questions
with multiple answerers were considered as duplicate
responses, and the percentage of the number of questions
to one of the answers was calculated. The rate of pro-
Table 2. Distribution of Respondents according to Scaling, Third Molar Extraction, and Endodontic Treatment
Variable Respondent 2013 2014 2015 2016 2017 p-value
Scaling Private 274 (42.8) 409 (33.0) 354 (36.5) 422 (40.5) 526 (42.2) <0.001 Professionals 224 (35.0) 250 (30.1) 471 (48.6) 418 (40.1) 566 (45.4)
Non-professionals 511 (79.8) 534 (64.3) 411 (42.4) 500 (47.9) 534 (42.9)
Third molar extraction Private 863 (94.6) 1,172 (40.9) 1,299 (25.7) 1,547 (25.3) 2,539 (34.1) <0.001 Professionals 1,415 (56.8) 1,333 (46.5) 3,669 (72.6) 3,615 (59.2) 4,413 (59.3)
Non-professionals 1,702 (68.3) 1,657 (57.8) 1,672 (33.1) 2,175 (35.6) 2,357 (31.7)
Endodontic treatment Private 980 (39.4) 1,017 (35.6) 1,112 (31.6) 1,497 (37.3) 1,900 (39.9) <0.001 Professionals 840 (34.0) 909 (31.8) 1,853 (52.7) 1,481 (36.9) 2,037 (42.7)
Non-professionals 1,640 (66.3) 1,768 (61.8) 1,394 (39.7) 1,872 (46.6) 1,670 (35.0)
p-value <0.001 <0.001 <0.001 <0.001 <0.001
Values are presented as n (%).
p-values were obtained through
2-test.
Table 3. Distribution of Answer Contents according to Scaling, Third Molar Extraction, and Endodontic Treatment
Variable Answer content 2013 2014 2015 2016 2017 p-value
Scaling Professional knowledge 225 (35.2) 246 (29.6) 465 (48.0) 412 (39.5) 554 (44.5) <0.001 Personal experience 742 (115.9) 921 (110.8) 747 (77.1) 907 (86.9) 1,026 (82.4)
Dental clinic visit 42 (6.6) 26 (3.1) 24 (2.5) 21 (2.3) 46 (3.7)
Third molar extraction Professional knowledge 1,400 (56.2) 1,311 (45.7) 3,592 (71.1) 3,536 (57.9) 4,300 (57.7) <0.001 Personal experience 2,470 (99.2) 2,724 (95.1) 2,815 (55.7) 3,526 (57.8) 4,591 (61.7)
Dental clinic visit 110 (4.4) 127 (4.4) 233 (4.6) 275 (4.5) 418 (5.6)
Endodontic treatment Professional knowledge 828 (34.3) 900 (31.5) 1,805 (51.3) 1,456 (36.2) 2,003 (42.0) <0.001 Personal experience 2,525 (102.1) 2,691 (94.1) 2,286 (65.0) 3,212 (79.9) 3,247 (68.1)
Dental clinic visit 107 (4.3) 103 (3.6) 268 (7.6) 182 (4.5) 357 (7.5)
p-value <0.001 <0.001 <0.001 <0.001 <0.001
Values are presented as n (%).
p-values were obtained through
2-test.
Table 4. Distribution of Answer Errors according to Each Treatment