tion in contemporary society, where outward appearance is very important. Recent trends show that patients exposed to various factors excluding genetic factors and natural ageing, such as environmental pollution, stress from tough competi- tion, and unhealthy eating habits and diet, are escalating.
This further becomes a vicious cycle when hair loss itself plays a role in causing alopecia. Anderson [1] emphasized stress as the cause of alopecia and its relapse. Maffei et al. [2]
and Fossati et al. [3] showed that hair loss patients have a high rate of morbid personality disorder before diagnosis of alopecia. Although hair loss is a disease that affects daily life, medical doctors argue that it greatly impacts personal life [4].
The constant mental and emotional stress leads to secondary morbidity [5]. Thus, stress due to hair loss is often compared to that due to severe chronic illness or life-threatening dis- ease [6]. Alopecia patients believe that the disadvantage due to a negative image formed by hair loss in the social sphere, including job and marriage prospects and various social ac-
I. Introduction
In today’s era of unlimited competition in all spheres of life, modern people are becoming vulnerable to various types of diseases. Hair loss has begun to attract increasing atten-
An Analysis of the Correlation between Alopecia and Chief Complaints
Sang Wook Lee, MD, Yoon Hee Jang, MS, Eun Young Jeong, PhD
Seven Rhema Medical Science Research Institute, Seoul, Korea
Objectives: In this study, we measured the extent of ten levels of classified symptoms by 300 (male and female) patients vis- iting the hair loss clinics of “S” hospitals in Gangbuk and Gangnam between January 2009 and June 2011 by analyzing the patients’ chief complaints. Methods: The method of measurement was based on a symptom questionnaire possessing 51 categories. Through the statistical analysis of data mining techniques, decision trees, and logistic regression, we derived a lo- gistic regression model and decision tree model that improved both the response rate and significant hair loss-related charac- teristics of the questionnaire. Results: The results of this study indicate that dry hair, seborrheic scalps and skin, tobacco and/
or coffee addiction, anxiety, nausea, indigestion, and facial flushing correlate to hair loss. Conclusions: We anticipate that the subjective symptoms of hair loss can provide a foundation for preventing secondary diseases and provide clinical data infor- mation during the period of treatment. This can contribute to the improvement of patient satisfaction after customized treat- ment.
Keywords: Alopecia, Questionnaires, Signs and Symptoms, Regression, Decision Trees
Healthc Inform Res. 2011 December;17(4):253-259.
http://dx.doi.org/10.4258/hir.2011.17.4.253 pISSN 2093-3681 • eISSN 2093-369X
Submitted: November 1, 2011 Revised: December 12, 2011 Accepted: December 22, 2011 Corresponding Author Eun Young Jeong, PhD
Seven Rhema Medical Science Research Institute, 10F, Elite B/D, 18-50 Changcheon-dong, Seodaemun-gu, Seoul 120-833, Korea. Tel: +82-2- 364-5815, Fax: +82-2-364-5825, E-mail: [email protected]
This is an Open Access article distributed under the terms of the Creative Com- mons Attribution Non-Commercial License (http://creativecommons.org/licenses/by- nc/3.0/) which permits unrestricted non-commercial use, distribution, and reproduc- tion in any medium, provided the original work is properly cited.
ⓒ 2011 The Korean Society of Medical Informatics
tivities, tend to cause lack of confidence and self-deprecation accompanied by psychological anxiety, depression, and emo- tional disorders [7]. Therefore, hair loss should be regarded as an aspect of life requiring more attention than a simple dermatological disease does [4]. Schlenker and Leary [8], define interpersonal anxiety in social situations as anxiety when personal evaluation is expected or its result exists in the real or imaginary order. Leary et al. [9] stated that people often complained of fear of negative evaluation by others and it leads to various secondary diseases. Recent medical research reported the construction of severity adjust model [10], development of hypertension predictive model [11]
and development of a tailored follow up management model on hypertension [12] et cetera by using the data mining technique and identifying hepatocellular carcinoma (HCC) by proteomic profiling study of HCC patients through two-dimensional gel electrophoresis (2-DE) and revealed potential candidate cancer biomarkers by artificial neural networks and decision tree (CART) [13] and prognosis of prostate cancer by using artificial neural networks and re- ceiver operating characteristic (ROC) analysis [14]. In addi- tion the data mining technique has been used for treatment of female pattern hair loss with oral antiandrogens [15], the epidemiological analysis of androgenetic alopecia [16] and environmental stress in children or adolescents with alopecia areata [17] et cetera. However, there isn’t enough research for the secondary symptoms of alopecia. The present study aims to collect empirical and theoretical data by analyzing the correlation between hair loss and symptoms based on chief complaints of patients with hair loss through the data min- ing technique. We examined the usefulness of highly reliable data on the identification of patients’ symptoms before and after hair loss treatment and prevention of secondary dis- eases as well as clinical information of patients in the course of hair restoration treatment.
II. Methods
1. Data Collection
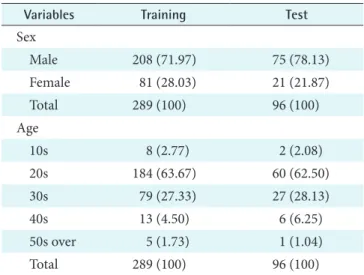
This study was based on patients who visited the Seven Rhe- ma clinic specializing hair loss treatment, which has 2 clinics located at Gangnam and Gangbuk in Seoul, from January 2009 to June 2011. We randomly selected 300 patients, a number we considered sufficient as an n value to construct a model. We selected the data and another 100 patients ran- domly to develop a model for validation and combined it with constructed models from 300 patients and both used the same items. We analyzed the data from the results of 289 medical examinations; the remaining 11 patients were outli-
ers. As we checked, the missing values can cause an effect on the analysis result from the obtained data by removing outliers. We found missing values were within 9% in some variables. Therefore we considered the missing values in this analysis. As we considered the fact that there are few vari- ables that contain missing values out of 51 variables, missing percentages were less than 9%, and there wasn't much data, we measured that substitution of data containing missing values will improve the reliability, instead of exemption, therefore, we replaced it by median. According to classified data of 289 patients, the age distribution showed the most at 20s and 30s; 8 patients in teens; 184 in 20s; 79 in 30s; 13 in 40s; and 5 in 50s. The sex distribution of 208 : 81 (male : female) patients showed that male patients greatly outnumbered female patients. The medical examination questionnaire for this study had 51 items, including headache; migraine; mus- cular or arthritic pain; facial flushing; gum bleeding; heart palpitation; nosebleed or easy bruising; stomatitis; addiction to tobacco and/or coffee; halitosis; cold; seborrheic scalp and skin; hair loss; dry hair; uredo; dry skin; hypotension;
hypertension; diabetes; hyperlipidemia; weight loss; cramps;
cold sweat and perspiration disorders; cold and heat charac- teristics; constipation; cold limbs and extremities; gray hair;
general, chronic, morning and afternoon fatigue; drowsiness;
insomnia and other sleep disorders; vertigo on standing up;
xerophthalmia; memory and concentration problems; low vigor; depression; anxiety; irritation; sensitivity to smoke, food ingredients, and chemicals (perfume and detergent);
nausea, food allergy, diarrhea/irritable colon syndrome;
abdominal swelling; chronic stomach ache; and indigestion.
The validation data was obtained from 96 patients through the identical process above (Table 1).
Table 1. Validation data
Variables Training Test
Sex
Male 208 (71.97) 75 (78.13)
Female 81 (28.03) 21 (21.87)
Total 289 (100) 96 (100)
Age
10s 8 (2.77) 2 (2.08)
20s 184 (63.67) 60 (62.50)
30s 79 (27.33) 27 (28.13)
40s 13 (4.50) 6 (6.25)
50s over 5 (1.73) 1 (1.04)
Total 289 (100) 96 (100)
Values are presented as number (%).
2. Analysis for Chief Complaints
This study used parametric statistics because the question- naire was related to chief complaints. By using an interval scale, we constructed 51 items with responses scaling from 1 to 10. We measured the degree of symptoms’ pain by classifi- cation into 10 grades according to hair loss secondary symp- toms. The degree of pain was assigned values from 1 to 10, depending on the pain experienced by the 300 patients who visited our clinic. Pain degree “1” meant severe pain and “10,”
normal cases without pain. These categories were clearly ex- plained by expert to the patients prior to survey. We created statistical models through investigation of the relationship between hair loss and the characteristics of severe hair loss patient in the questionnaire that are classified with “normal”
and “severe” to distinguish between patients to infer the cor- relation between the medical questionnaire items and hair loss. The analysis was performed for 289 patients. The graph frequency was set to 5 and based on the frequency, we classi- fied the patients as 1 (score 1-4) to ‘severe’ and 0 (score 5-10) to ‘normal’. The result appeared severe and normal as 141 and 148 respectively. We used logistic regression and deci- sion tree by using SAS Enterprise Miner ver. 4.3 (SAS Insti- tute Inc, Cary, NC, USA).
The Decision Tree in this study is one of the effective data mining methods and commonly used for classification or prediction. It is because that unlike a nerve network and dis- criminant analysis method, the decision tree can show rules more clearly underlying application result. Decision Tree has various algorithms and CART, CHAID, C4.5, QUEST are
common. In this study, we measured binary splitting as the most appropriate method, since the objective variables were categorical data and there was small amounts of data. There- fore we used CART algorithm based on Gini coefficient in this study. Also, we limited the depth of tree as 3-depth to reduce the misclassification rates that appear when the depth of decision tree is getting deeper by using binary splitting. In addition, all the methods relied on the analysis of all 51 vari- ables at a significance level of p < 0.05.
III. Results
1. Category Analysis Through t-scores
Frequency analysis of physical symptoms were analyzed by selected items, including skin problems, dry mouth, numb and cold limb extremities, heat, dizziness and paleness, chronic fatigues, dermatitis, and drinking and smoking in 26 items referenced by Cornell Medical Index in previous research of Kim and Jeoung [18]. The 26 items were similar to our classification except for the dry hair item in this study.
Through effect t-scores of items by the regression node, we found the following items to be most associated with hair loss, in successive order: dry hair > cold > seborrheic scalp and skin > chronic stomachache > addiction to tobacco and/
or coffee > abdominal swelling > anxiety > nausea > indiges- tion > facial flushing > halitosis > nosebleed or easy bruising
> irritation > cold limbs and extremities (Table 2). However, we deem that 3 items (nosebleed or easy bruising, irritation, and cold/heat) were not significant factors (p < 0.05) and Table 2. Analysis of variables for hair loss patients’ chief complaints
Category Estimate Effect
t-scores
Standard error
Wald
chi-square Pr > Chisq Standardized estimate
Odd ratio estimates
Dry hair -0.4189 -4.6639 0.0898 21.75 <0.0001 -0.6054 0.658
Cold 0.4364 3.4322 0.1271 11.78 0.0006 0.4449 1.547
Seborrheic scalp & skin -0.2073 -2.8930 0.0717 8.37 0.0038 -0.3138 0.813
Chronic stomach ache 0.4757 2.7092 0.1756 7.34 0.0067 0.4445 1.609
Tobacco and/or coffee addiction -0.1932 -2.5102 0.0770 6.30 0.0121 -0.2874 0.824
Abdominal swelling 0.3029 2.2743 0.1332 5.17 0.0229 0.3217 1.354
Anxiety -0.3677 -2.2138 0.1661 4.90 0.0268 -0.4552 0.692
Nausea -0.2864 -2.1793 0.1314 4.75 0.0293 -0.3099 0.751
Indigestion -0.2445 -2.0597 0.1187 4.24 0.0394 -0.2833 0.783
Facial flushing -0.1758 -1.9728 0.0891 3.89 0.0485 -0.2285 0.839
Halitosis 0.2150 1.9674 0.1093 3.87 0.0491 0.2494 1.240
Nosebleed or easy bruising -0.2167 -1.8886 0.1147 3.57 0.0589 -0.2158 0.805
Irritation 0.2287 1.8267 0.1252 3.34 0.0677 0.2886 1.257
Cold & heat characteristics -0.1690 -1.7803 0.0949 3.17 0.0750 -0.2299 0.845
are not relevant to hair loss; their p-values decreased as the effect t-scores decreased. The categories cold, chronic stom- achache, abdominal swelling, halitosis, and irritation seemed to affect hair loss to a greater extent and were less associated to hair loss, with positive value of estimates because of a gen- erally high level of respondents. Thus, as the absolute value of effect t-scores is large, meeting a significant level of p < 0.05 categories, like dry hair, seborrheic scalp and skin, addiction to tobacco and/or coffee, anxiety, nausea, indigestion, and facial flushing are judged to be relevant to hair loss. When examining the odd ratio of these items, the dry hair indicates 0.658 which means that when the units of dry hair increased by 1, the chances of it being ‘severe’ are 0.658 times higher than before. Since the odd ratio of Seborrheic scalp & skin appeared as 0.813, it tells that the possibility of becoming ‘se- vere’ rises 0.813 more as a unit of the item risen by 1 and the rest of the items can be interpreted the same. In a previous study [19], seborrheic dermatitis, pimples, and menstrual irregularity were reported to accompany hair loss. However, most of the researches regarding hair loss focus on stress [20], and mental health [21]. In fact previous studies often used t-test and ANOVA analysis which has the limitation of finding a hidden variable because it can’t reflect an interac- tion between the variables as logistic regression and decision tree analysis. However, construction of a model by logistic regression and decision tree analysis through using the data mining technique provides the chance of finding the hidden variable so we can draw differentiated results than previous research.
2. Designing a Model Questionnaire for Prospective Pa- tients
Based on the questionnaire results of the patients reported herein, we determined logistic regression and constructed decision trees to predict a patients’ conditions in prospective cases. Through every NONE model, we selected variables’
performances in logistic regression. In addition, a profit ma- trix was applied to determine the optimal value of the clas- sification criteria (cut-off). In the profit matrix, a misclassi- fication table was created based on a threshold value of 50%.
The accuracy (78.20%) that criteria hair loss patients when adapt the questionnaire results of new patients onto the con- structed model improved relative to that of pre-distribution (47.79%) by applying a new model questionnaire. The result of validation data also consisted 73.96% as accuracy which has a similar result with the existing model. In this case, the C-table which represents misclassification rates according to cut-off value for seek norm value were omitted because we used the criteria value of the program (Table 3).
3. Decision-making Tree
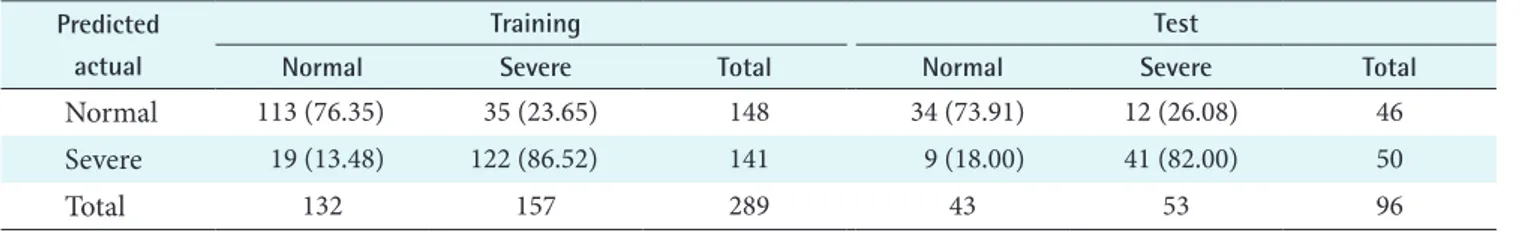
Table 4 is the misclassification table; it uses the profit matrix of a decision-making tree with a reference to criteria value at a threshold of 50% for classification thus obtained. With the 50% threshold, accuracy (81.31%) improved from pre-distri- bution (47.79%) with a record that is higher than accuracy of Logistic regression of 78.20%. The findings of validation data also had an accuracy of 78.13% and incur similar outcome with previous model.
Table 3. Misclassification table of logistic regression Predicted
actual
Training Test
Normal Severe Total Normal Severe Total
Normal 115 (77.70) 33 (22.30) 148 36 (72.00) 14 (28.00) 50
Severe 30 (21.28) 111 (78.72) 141 11 (23.91) 35 (76.09) 46
Total 145 144 289 47 49 96
Values are presented as number (%).
Table 4. Misclassification table of the decision-making tree Predicted
actual
Training Test
Normal Severe Total Normal Severe Total
Normal 113 (76.35) 35 (23.65) 148 34 (73.91) 12 (26.08) 46
Severe 19 (13.48) 122 (86.52) 141 9 (18.00) 41 (82.00) 50
Total 132 157 289 43 53 96
Values are presented as number (%).
Prior: 48.79%, Accuracy (training): 81.31%, Accuracy (test): 78.13%.
The result obtained through the decision-making tree for hair loss patients’ chief complaints explained in Figure 1.
Based on the criteria of the decision-making tree, values in the dry hair category were set to 6, and seborrheic scalp and skin, drowsiness, cold, addiction to tobacco and/or cof- fee were classified successively. Results from classification 3 times showed that more than 70% of “severe” patients and
“normal” patients were classified at the third node. This en- sures that the above 5 categories can classify more than 70%
of “severe” patients with relevance to hair loss.
4. Judging Models of Logistic Regression and Decision- making Tree
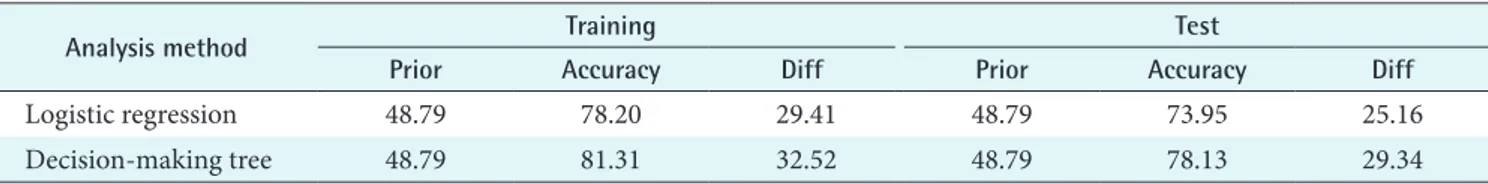
Table 5 depicts the results of 2 models, which show that ac- curacy by the decision-making tree is superior to that de- rived through logistic regression.
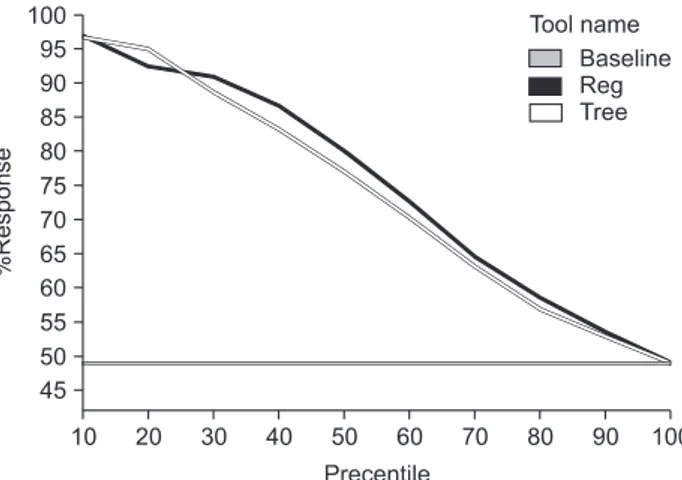
In addition, Figure 2 describes a ROC curve that evaluates performance of models with sensitivity, the possibility of pa- tients’ diagnosis test results come as positive, when patients have the disease, on the vertical axis and specificity on the horizontal axis. While better performance is located above the diagonal line, ROC curves are located higher than in the decision-making tree curve. Figure 3 is a response chart of the 2 models. The horizontal axis is the random response rate (48.7%) prior to modeling. The decision-making tree model, regarded as a good model, shows a response rate of 90.70% among top 30% patients.
As a result, the logistic regression model consisting of 14 variables and effect t-scores for each variable was obtained.
It is expected to predict the state of hair loss from regres- sion results of the questionnaire for new patients through the “severe” scoring options. Items affecting hair loss can be
Figure 1. Decision-making trees for hair loss patients’ chief complaints.
Table 5. Comparison of accuracy
Analysis method Training Test
Prior Accuracy Diff Prior Accuracy Diff
Logistic regression 48.79 78.20 29.41 48.79 73.95 25.16
Decision-making tree 48.79 81.31 32.52 48.79 78.13 29.34
determined from effect t-score values. We created a tree with leaf = 9 and depth = 4 using the Classification and Regres- sion Trees method (based on separation of Gini coefficients) by selecting the most significant variables for classification of
“severe” category for patients at each stage. The decision tree model will also be able to predict the state of new hair loss patients and predict significant items associated with hair loss by considering classification criteria at each stage.
IV. Discussion
This study was based on results from a questionnaire on symptoms of 300 patients who visited the alopecia clinics.
To analyze chief complaints of hair loss patients, we used the questionnaires results from 289 individuals; 11 patients had outlier values. Missing values were replaced by the median in the analysis. Analysis showed a level of significance p <
0.05 in 11 items analyzed by the NONE model, including dry hair, cold, seborrheic scalp and skin, chronic stomach ache, addiction to tobacco and/or coffee, abdominal swelling, anx- iety, nausea, indigestion, facial flushing, and halitosis. Fur- thermore, through the effect t-scores obtained by the regres- sion node, items with positive values are less related to hair loss because we judged that the categories of cold, chronic stomach ache, abdominal swelling, bad breath, and irritation are given high scores by the respondents. However, the items that are generally interpreted to be related with hair loss to a greater extent tend to show scores higher than normal. This study shows that 7 categories-dry hair, seborrheic scalp and skin, tobacco and/or coffee addiction, anxiety, nausea, indi- gestion, and facial flushing-are related to hair loss. In order to ensure the reliability of these results with the logistic re-
gression model and decision-making tree, model assessment was conducted to ensure reliability by deploying the ROC curve and drawing response rate of 90.70% from top 30%
patients in the decision-making tree. The questionnaires that have attracted less attention so far have been designed using logistic regression and decision-making trees by data min- ing. Both models derived improved response rate and sig- nificant questionnaire items that are highly associated with alopecia. This study foreshows the secondary symptoms of patients of alopecia by applying the data mining technique and such model questionnaires, it will be possible to predict when a patient should be referred for medical treatment and consultation through the application of the model question- naire for patients; this will contribute to enhancing patient satisfaction resulting from customized treatment. The data mining technique is not complex, relatively easy to learn and has high utilization compared to the traditional statistic technique [10]. The characteristics or complaints correlated with alopecia as determined from our analysis are relevant and can form the foundation further research on this perti- nent aspect. However, this study had certain limitations: it dealt with patients in progress of alopecia. Thus, it is difficult to distinguish the examined results from perfect secondary symptoms. In-depth, extensive research based on epidemio- logical investigation together with blood and hormone tests in connection with clinical data will contribute to earlier treatment and prevention of alopecia.
Conflict of Interest
No potential conflict of interest relevant to this article was reported.
Figure 2. Receiver operating characteristic curve of comprehen- sive model.
Figure 3. Response chart of comprehensive model.
Acknowledgements
This research was supported by Seven Rhema Clinic in Shin- chon and Seven Rhema Plastic surgery in Gangnam. We are also grateful to Han Young Soo, Park Woo Na, Jee Young Ha and Ji Hye Kim at Seven Rhema Medical Science Research Institute, Korea.
References
1. Anderson I. Alopecia areata: a clinical study. Br Med J 1950; 2: 1250-1252.
2. Maffei C, Fossati A, Rinaldi F, Riva E. Personality disor- ders and psychopathologic symptoms in patients with androgenetic alopecia. Arch Dermatol 1994; 130: 868- 872.
3. Fossati A, Rinaldi F, Maestroni L, Cappio F, Maffei C.
Trichologic consultation and personality disorders. G Ital Dermatol Venereol 1993; 128: 101-108.
4. Kantor J, Kessler LJ, Brooks DG, Cotsarelis G. Decreased serum ferritin is associated with alopecia in women. J Invest Dermatol 2003; 121: 985-988.
5. Hadshiew IM, Foitzik K, Arck PC, Paus R. Burden of hair loss: stress and the underestimated psychosocial impact of telogen effluvium and androgenetic alopecia. J Invest Dermatol 2004; 123: 455-457.
6. de Koning EB, Passchier J, Dekker FW. Psychologi- cal problems with hair loss in general practice and the treatment policies of general practitioners. Psychol Rep 1990; 67(3 Pt 1): 775-778.
7. Kim DH, Kim SN. The effect on hair loss for impression formation and interpersonal anxiety. Korean J Aesthetic Soc 2010; 8: 1-12.
8. Schlenker BR, Leary MR. Social anxiety and self-pre- sentation: a conceptualization and model. Psychol Bull 1982; 92: 641-669.
9. Leary MR, Kowalsi RM, Campbell CD. Self-presenta- tional concerns and social anxiety: the role of general- ized impression expectancies. J Res Pers 1988; 22: 308- 321.
10. Kim SJ, Kang SH, Kim WJ, Kim YM. The variation fac-
tors of severity: adjusted length of stay in CABG. J Ko- rean Soc Qual Manag 2011; 39: 391-399.
11. Yong WS, Park IS, Kang SH, Kim WJ, Kim KH, Kim KK, Park NY. Development of hypertension predictive model. J Korean Soc Health Educ Promot 2006; 23: 13- 28.
12. Park IS, Yong WS, Kim YM, Kang SH, Han JT. A devel- opment of a tailored follow up management model us- ing the data mining technique on hypertension. Korean J Appl Stat 2008; 21: 649-657.
13. Luk JM, Lam BY, Lee NP, Ho DW, Sham PC, Chen L, Peng J, Leng X, Day PJ, Fan ST. Artificial neural net- works and decision tree model analysis of liver cancer proteomes. Biochem Biophys Res Commun 2007; 361:
68-73.
14. Saritas I, Ozkan IA, Sert IU. Prognosis of prostate cancer by artificial neural networks. Expert Syst Appl 2010; 37:
6646-6650.
15. Sinclair R, Wewerinke M, Jolley D. Treatment of female pattern hair loss with oral antiandrogens. Br J Dermatol 2005; 152: 466-473.
16. Severi G, Sinclair R, Hopper JL, English DR, McCredie MR, Boyle P, Giles GG. Androgenetic alopecia in men aged 40-69 years: prevalence and risk factors. Br J Der- matol 2003; 149: 1207-1213.
17. Diaz-Atienza F, Gurpegui M. Environmental stress but not subjective distress in children or adolescents with alopecia areata. J Psychosom Res 2011; 71: 102-107.
18. Kim EK, Jeoung MY. A study on physical symptom of people who has alopecia using CMI method. J Korean Soc Cosmetol 2009; 15: 440-450.
19. Lim HS, Lee CH, Ro BI. A clinical study of androgenetic alopecia (1994). Korean J Investig Dermatol 1997; 4: 27- 34.
20. Matzer F, Egger JW, Kopera D. Psychosocial stress and coping in alopecia areata: a questionnaire survey and qualitative study among 45 patients. Acta Derm Vene- reol 2011; 91: 318-327.
21. Fischer TW, Schmidt S, Strauss B, Elsner P. Hairdex: a tool for evaluation of disease-specific quality of life in patients with hair diseases. Hautarzt 2001; 52: 219-227.