http://dx.doi.org/10.3988/jcn.2013.9.1.21 J Clin Neurol 2013;9:21-25
Introduction
Huntington’s disease (HD) is an autosomal-dominant genetic neurodegenerative disorder with a high genetic penetrance. Af-
fected individuals present with chorea and cognitive and psy- chiatric dysfunction, usually in middle age, which progress to dementia. The duration of the illness between onset and dea- th varies, but usually ranges between 14 to 18 years.1 The typi- cal clinical features of hereditary chorea together with cau- date atrophy on brain imaging allow the clinical diagnosis of HD. Molecular genetic analysis of the CAG expansion in the IT15 gene on chromosome 4p16.3 makes it possible to con- firm the diagnosis of HD, even at the preclinical stage.2 How-
Decreased Metabolism in the Cerebral Cortex in Early-Stage Huntington’s Disease: A Possible Biomarker
of Disease Progression?
Hyeeun Shin,a Man Ho Kim,b Su Jin Lee,c Kyung-Han Lee,d Mi-Jung Kim,e Ji Sun Kim,f Jin Whan Chof
aDepartment of Neurology, Eulji General Hospital, Eulji University School of Medicine, Deajeon, Korea
bDepartment of Neurology, Seoul National University Hospital, Seoul National University College of Medicine, Seoul, Korea
cDepartment of Nuclear Medicine, Ajou University School of Medicine, Suwon, Korea
dDepartments of Nuclear Medicine and fNeurology, Samsung Medical Center, Sungkyunkwan University School of Medicine, Seoul, Korea
eDepartment of Neurology, Asan Medical Center, University of Ulsan College of Medicine, Seoul, Korea
Received February 2, 2012 Revised July 16, 2012 Accepted July 16, 2012 Correspondence Jin Whan Cho, MD, PhD Department of Neurology, Samsung Medical Center, Sungkyunkwan University, School of Medicine, 50 Irwon dong, Gangnam-gu, Seoul 135-170, Korea Tel +82-2-3410-1279 Fax +82-2-3410-0052
E-mail [email protected]
Background and PurposezzHuntington’s disease (HD) is an autosomal-dominant inherited neu- rodegenerative disorder. Genetic analysis of abnormal CAG expansion in the IT15 gene allows disease confirmation even in the preclinical stage. However, because there is no treatment to cure or delay the progression of this disease, monitoring of biological markers that predict pro- gression is warranted.
MethodszzFDG-PET was applied to 13 patients with genetically confirmed HD in the early stage of the disease. We recorded the initial and follow-up statuses of patients using the Independence Scale (IS) of the Unified Huntington’s Disease Rating Scale. The progression rate (PR) was cal- culated as the annual change in the IS. The patients were divided into two groups with faster and slower progression, using the median value of the PR as the cut-off. FDG-PET data were ana- lyzed using regions of interest, and compared among the two patient groups and 11 age- and sex- matched controls.
ResultszzThe mean CAG repeat size in patients was 44.7. The CAG repeat length was inverse- ly correlated with the age at onset as reported previously, but was not correlated with the clinical PR. Compared with normal controls, hypometabolism was observed even at very early stages of the disease in the bilateral frontal, temporal, and parietal cortices on FDG-PET. The decreases in metabolism in the bilateral frontal, parietal, and right temporal cortices were much greater in the faster-progression group than in the slower-progression group.
ConclusionszzA decrease in cortical glucose metabolism is suggested as a predictor for identify- ing a more rapid form of progression in patients with early-stage HD.
J Clin Neurol 2013;9:21-25 Key Wordszz Huntington’s disease, biomarker, FDG-PET, progression, cortical metabolism.
Open Access
cc This is an Open Access article distributed under the terms of the Cre- ative Commons Attribution Non-Commercial License (http://creative- commons.org/licenses/by-nc/3.0) which permits unrestricted non-com- mercial use, distribution, and reproduction in any medium, provided the ori- ginal work is properly cited.
ever, there are no treatments available to prevent, cure, or delay the disease progression, making it necessary to explore biological markers that could predict disease progression.
The main pathological features of HD include loss of the medium spiny neurons of the neostriatum, which leads to cau- date atrophy that is visible in brain imaging.3 The striatal loss of glucose metabolism has also been revealed in the preclini- cal stage of HD.4-7 However, it is known that pathological ch- anges also occur in the cortex.8,9 Fluorodeoxyglucose posi- tron emission tomography (FDG-PET) imaging of the brains of HD patients reveals decreased metabolism in cortical areas, suggesting that the cognitive and psychiatric symptoms asso- ciated with HD are not mediated purely by subcortical dam- age.5,7,10,11 In this study we tested the hypothesis that changes in cerebral cortical metabolism in early-stage HD detected by FDG-PET could be used to monitor the disease progression.
Methods
Subjects and review of medical records
We performed a retrospective review of medical records, and interviewed the family members cohabitating with 28 en- rolled patients with genetically confirmed HD who were av- ailable for a follow-up interview. FDG-PET was applied to 13 of the patients who were in the early stage of the disease. To monitor disease progression, we obtained the age at onset, in- itial manifestations, disease duration, family history, main symptoms at first visit, CAG repetition length, and functional statuses at onset and during follow-up by means of medical record reviews and interviews. The protocol used for this stu- dy was reviewed and approved by the institutional review board of Samsung Medical Center.
Progression rate
The functional statuses of the patients were assessed using the Independence Scale (IS) of the Unified Huntington’s Disease Rating Scale. We defined the progression rate (PR) as the an- nual change in the IS score; that is, the annual difference in IS between disease onset and follow-up evaluation [(IS at onset-IS at follow-up point)/(duration of disease)]. The me- dian value of the PR for our 28 patients was used as a cut-off value to compare patients on whom FDG-PET (n=13) was performed, because an objective reference has not been re- ported; 7 and 6 patients were assigned to the slower- and fast- er-progression groups, respectively. Age and duration of dis- ease did not differ between the slower- and faster-progression groups.
FDG-PET and imaging analysis
FDG-PET was applied to early-stage HD patients who had not
reported any impairment of the activities of daily living (ADL) or cognitive defects, at a mean of 2.2 years after symptom on- set. To determine if there were metabolic differences between normal and HD patients, 11 normal-control images were ob- tained from age- and sex-matched patients (mean age=48.6 years, 5 males and 6 females) with no history of neurological or psychiatric disorders and no evidence of neurological ab- normalities upon examination.
Brain PET was performed 30 min after injecting 370 MBq FDG. Emission data were acquired for 10 min on a GE Adv- ance PET scanner (GE Healthcare, Milwaukee, WI, USA).
Tomographic images were reconstructed by filtered back-pro- jection using a Hanning filter (4.5 mm cut-off frequency) and a uniform attenuation coefficient of 0.096 cm-1. Images were stored on a 128×128 matrix with 1.95 mm pixel size and 4.25 mm slice thickness.
PET images were evaluated by segmental region of interest (ROI) analysis, which was performed on caudoputamen- and cerebellum-level transverse tomographic images constructed from three adjacent slices. On each image, 12 anatomically configured ROIs were drawn using a segmental analysis al- gorithm (Xeleris Software, GE Healthcare, Milwaukee, WI, USA), and average counts were obtained (total count/num- ber of pixels) for each ROI. The ratios of the ROI values for the bilateral frontal, temporal, parietal, occipital cortices, th- alami, and caudate nuclei to that of the cerebellar ROI value were used for comparisons.11 In addition, the PR and meta- bolic differences between HD patients with slower and faster progression were compared based on the ROI ratios describ- ed above.
Statistical analysis
The relationship between CAG repeat length and age at onset was determined by correlation analysis. We used partial cor- relation analysis to determine the factors influencing PR such as age at onset, disease duration, and CAG repeat length. We used the Kruskal-Wallis test to compare the ratios of the ce- rebral ROIs to the cerebellum ROI on FDG-PET among pa- tient groups and control subjects. The Mann-Whitney test was used to compare the mean differences in the ratios of ROIs be- tween the slower- and faster-progression groups and the con- trols. All of the statistical analyses were performed using PA- SW (version 18.0, IBM).
Results
We evaluated the PRs in 28 patients, consisting of 9 men and 19 women from 26 different pedigrees. The median PR score was -4.3 IS per year and the mean duration of the disease was 7.6 years. The PR was not significantly correlated with the
number of CAG repeats or age at onset. Demographic features and clinical data of 13 patients who were investigated using FDG-PET are summarized in Table 1. The mean CAG repe- tition size was 44.7 (with a range of 36-55), and it was corre- lated with the age at disease onset; this association is already well known. The most common initial manifestation at the first visit was abnormal involuntary movement (i.e., chorea).
FDG-PET was applied to all these patients within 3 years of the onset of HD. They were able to work and perform the normal ADL, and had similar IS scores (of above 80) at the time of the scan. The mean follow-up IS was 6.6 years (with a range of 3-11 years) after symptoms onset.
Progression rate and metabolism as assessed by FDG-PET
To determine the relationship between PR and metabolic ac- tivity in the brain, two categories of HD patients were defin- ed by using the median value of the PR in our cohort as a cut- off value to compare between slower- and faster-progression groups. Dividing the 13 patients into a faster-progression group (above the median value, n=6) and a slower-progression group (below the median, n=7) revealed differences in FDG- PET metabolism. The metabolisms in the bilateral caudate nuclei, frontal, temporal, and parietal cortices of HD patients were decreased compared to those of controls. The decreases in metabolism in the bilateral frontal, parietal cortices, and right temporal cortex were greater in the faster-progression group. The faster progression group showed hypometabolism throughout the cortex except for the occipital region relative to controls. The metabolism detected in the temporal cortex did not differ significantly between the slower-progression
and control groups. The metabolism in the occipital cortex and the thalamus ratios did not differ among the three groups (Ta- ble 2, Fig. 1).
Discussion
HD is an inherited neurodegenerative disease. Clinical mani- festations and a family history are suggestive for a diagnosis of HD, and this can be confirmed with genetic testing, enabl- ing detection of patients in the presymptomatic stage. How- ever, it is currently not possible to treat or cure this disorder, making it necessary to develop targeted drugs and strategies that can delay onset and modify progression. The develop- ment of effective treatment modalities requires the identifica- tion of biomarkers that can be used to monitor progression or predict onset. In this study we investigated whether changes in brain metabolism in early-stage HD can be used as a biolo- gical marker to predict HD progression.
It is well known that individuals with a large number of CAG repeats have earlier onsets of the disease. There have been some suggestions that a greater number of CAG repeats results in faster progression, but the relationship between CAG repeat length and progression is unclear.12,13 Our statis- tical analyses found no significant correlations between CAG repeats and PR, although our small sample could have hin- dered the detection of statistically significant results.
Pathological changes that precede the onset of clinical symp- toms have been found;14,15 however, it is unknown when these changes begin. Many structural and functional neuroimaging methods are currently used in attempts to detect abnormalities in the brains of HD patients associated with clinical manifes- Table 1. Clinical characteristics of 13 patients with Huntington’s disease (HD) who were investigated using FDG-PET
Patient
no. Gender Age at onset (years)
Age at
PET IS-PET IS score
at f/u Duration TNR Initial main symptom PR Progression group
1 Female 32 35 90 60 7 49 Involuntary movement -5.77 Faster
2 Female 41 44 90 70 10 41 Mild cognitive impairment -3.00 Slower
3 Female 50 52 90 70 5 44 Involuntary movement -6.00 Faster
4 Male 41 44 90 85 4 48 Involuntary movement -3.75 Slower
5 Female 49 51 90 80 6 43 Involuntary movement -3.33 Slower
6 Female 73 76 80 30 8 42 Involuntary movement -7.89 Faster
7 Male 30 31 90 50 12 55 Involuntary movement -3.92 Slower
8 Male 63 65 85 40 11 40 Involuntary movement -5.44 Faster
9 Male 47 50 90 70 4 43 Involuntary movement -7.50 Faster
10 Female 50 52 80 30 7 36 Involuntary movement -7.15 Faster
11 Female 50 52 95 90 3 41 Involuntary movement -3.33 Slower
12 Female 37 37 95 80 5 44 Involuntary movement -4.00 Slower
13 Male 40 43 90 90 3 55 Involuntary movement -3.33 Slower
Seven patients were assigned to the slower-progression group and six to the faster-progression group.
Duration: disease duration (years) at the time of follow-up, FDG-PET: fluorodeoxyglucose positron emission tomography, f/u: follow- up, IS: score of independence scale of the Unified Huntington’s Disease Rating Scale, IS-PET: IS at the time of the FDG-PET scan, PR:
progression rate (see main text), TNR: number of trinucleotide repeats.
tations. Alterations in the striatal volume and a decrease in D2 receptor or glucose metabolism in the preclinical stage of HD have been reported, indicating the usefulness of brain imaging techniques for monitoring;5,7,14,16-18 however, these methods do not provide information about progression after disease onset.
Our data showed that glucose metabolism in the caudate nu- clei was decreased in 13 HD patients who underwent FDG- PET regardless of PR. In other words, changes in striatal me- tabolism are not useful for monitoring the progression pattern after disease onset.
While striatal degeneration is the main pathology of HD, widespread cortical changes also occur in the early stages of this disease.19,20 Previous FDG-PET studies have found decr- eases in both cortical and neostriatum metabolism, suggest-
ing that cognitive dysfunction in HD does not have an exclu- sively subcortical origin, and making it possible to explain the various phenotypes of HD.10,11 It was previously reported that altered cortical metabolism in the frontotemporal lobe was present at the preclinical stage, suggesting that cortical dysfunction begins before symptom onset.21 However, the re- lationship between cortical metabolism and HD progression has not previously been investigated.
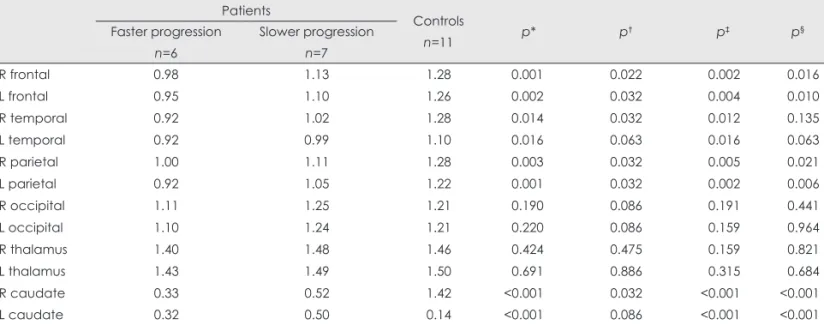
The present study applied FDG-PET to early-stage HD pa- tients who had an IS score of more than 80 (indicating no pro- blems performing the normal ADL). Widespread cortical hy- pometabolism (except in the occipital cortex) was observed in these patients. Additionally, the cortical metabolism in the frontotemporal and parietal cortices was significantly lower Table 2. Comparison of regional metabolism among the faster-and slower-progression HD groups and the normal-controls group
Patients
Controls
n=11 p* p† p‡ p§
Faster progression n=6
Slower progression n=7
R frontal 0.98 1.13 1.28 0.001 0.022 0.002 0.016
L frontal 0.95 1.10 1.26 0.002 0.032 0.004 0.010
R temporal 0.92 1.02 1.28 0.014 0.032 0.012 0.135
L temporal 0.92 0.99 1.10 0.016 0.063 0.016 0.063
R parietal 1.00 1.11 1.28 0.003 0.032 0.005 0.021
L parietal 0.92 1.05 1.22 0.001 0.032 0.002 0.006
R occipital 1.11 1.25 1.21 0.190 0.086 0.191 0.441
L occipital 1.10 1.24 1.21 0.220 0.086 0.159 0.964
R thalamus 1.40 1.48 1.46 0.424 0.475 0.159 0.821
L thalamus 1.43 1.49 1.50 0.691 0.886 0.315 0.684
R caudate 0.33 0.52 1.42 <0.001 0.032 <0.001 <0.001
L caudate 0.32 0.50 0.14 <0.001 0.086 <0.001 <0.001
Numeric value for regions in each group is mean regional/cerebellar region-of-interest ratio.
*Kruskal-Wallis test among faster-progression patients, slower-progression patients, and controls, †,‡,§Mann-Whitney test for compari- sons between faster- and slower-progression patients (†), faster-progression patients and controls (‡), and slower patients-progression and controls (§); p values <0.05 were considered statistically significant.
L: left, R: right.
Fig. 1. Comparison of the FDG-PET regional cerebral/cerebellar region-of-interest ratio among faster- and slower-progression Huntington’s disease (HD) groups and age- and sex-matched controls. The decreases in metabolism in the bilateral frontal, parietal cortices, and right temporal cortex were significantly greater in the faster-progression group than in the slower-progression group. The metabolism in the oc- cipital cortices and thalami did not differ between the two HD groups. Data are not shown for the bilateral caudate nuclei because of severe decreases in both patient groups. *A statistically significant difference among the groups (p<0.05).
1.5
1.3
1.1
0.9
0.7 R frontal L frontal R temporal L temporal R parietal L parietal R occipital L occipital R thalamus L thalamus Faster-progression group Slower-progression group Controls
* *
* * *
in the faster-progression group than in the slower-progression group. Considering that functional deficits and disease dura- tion did not differ significantly between these two groups, we postulate that decreased cortical metabolism in the early st- age of HD is indicative of rapid progression. Our findings suggest that altered brain metabolism as assessed by FDG- PET can be used to predict disease progression. To confirm this hypothesis, additional prospective studies involving large numbers of subjects are required.
Our study was subject to several limitations. First, the small number of subjects reduced the statistical power. Second, the retrospective design of the study limited the available clinical information (e.g., neuropsychological function test). Third, since there is no unified scale for the clinical progression of HD, we arbitrarily used the decline in the IS score of the Uni- fied Huntington’s Disease Rating Scale as a marker of PR be- cause this score most likely reflects the ability to perform the ADL in HD. A unified progression scale of HD will need to be evaluated in future studies. Lastly, the partial volume effect of PET analysis was problematic. Diffuse cortical atrophy accompanied by HD progression and hypometabolism in the faster-progression group might have originated from the greater severity of cortical atrophy. This problem could be re- solved by structural imaging using magnetic resonance imag- ing in a future study. Furthermore, we used segmental ROI an- alysis because of easy accessibility, but more elaborate results may be expected using other image analytic methods such as statistical parametric mapping.
In conclusion, the results of this study suggest that the de- crease in cortical metabolism in HD can be used to predict the PR. More HD patients should be tested to replicate our obser- vation that the cortical metabolism can be used as a biological marker for HD progression.
Conflicts of Interest
The authors have no financial conflicts of interest.
Acknowledgements
We thank Ji Yoon Lee for editing the use of English in this manuscript.
REFERENCES
1. ACMG/ASHG statement. Laboratory guidelines for Huntington dis- ease genetic testing. The American College of Medical Genetics/Amer- ican Society of Human Genetics Huntington Disease Genetic Testing Working Group. Am J Hum Genet 1998;62:1243-1247.
2. Kremer B, Goldberg P, Andrew SE, Theilmann J, Telenius H, Zeisler J, et al. A worldwide study of the Huntington’s disease mutation. The sensitivity and specificity of measuring CAG repeats. N Engl J Med 1994;330:1401-1406.
3. Hersch S, Rosas H, Ferrante R. Neuropathology and pathophysiology
of Huntington’s disease. New York: McGraw-Hill, 2004.
4. Hayden MR, Hewitt J, Stoessl AJ, Clark C, Ammann W, Martin WR.
The combined use of positron emission tomography and DNA poly- morphisms for preclinical detection of Huntington’s disease. Neurolo- gy 1987;37:1441-1447.
5. Mazziotta JC, Phelps ME, Pahl JJ, Huang SC, Baxter LR, Riege WH, et al. Reduced cerebral glucose metabolism in asymptomatic subjects at risk for Huntington’s disease. N Engl J Med 1987;316:357-362.
6. Grafton ST, Mazziotta JC, Pahl JJ, St George-Hyslop P, Haines JL, Gusella J, et al. A comparison of neurological, metabolic, structural, and genetic evaluations in persons at risk for Huntington’s disease. Ann Neurol 1990;28:614-621.
7. Antonini A, Leenders KL, Spiegel R, Meier D, Vontobel P, Weigell- Weber M, et al. Striatal glucose metabolism and dopamine D2 recep- tor binding in asymptomatic gene carriers and patients with Hunting- ton’s disease. Brain 1996;119:2085-2095.
8. Rosas HD, Salat DH, Lee SY, Zaleta AK, Pappu V, Fischl B, et al. Ce- rebral cortex and the clinical expression of Huntington’s disease: com- plexity and heterogeneity. Brain 2008;131:1057-1068.
9. Rosas HD, Liu AK, Hersch S, Glessner M, Ferrante RJ, Salat DH, et al.
Regional and progressive thinning of the cortical ribbon in Hunting- ton’s disease. Neurology 2002;58:695-701.
10. Martin WR, Clark C, Ammann W, Stoessl AJ, Shtybel W, Hayden MR.
Cortical glucose metabolism in Huntington’s disease. Neurology 1992;
42:223-229.
11. Kuwert T, Lange HW, Langen KJ, Herzog H, Aulich A, Feinendegen LE. Cortical and subcortical glucose consumption measured by PET in patients with Huntington’s disease. Brain 1990;113:1405-1423.
12. Ashizawa T, Wong LJ, Richards CS, Caskey CT, Jankovic J. CAG re- peat size and clinical presentation in Huntington’s disease. Neurology 1994;44:1137-1143.
13. Kieburtz K, MacDonald M, Shih C, Feigin A, Steinberg K, Bordwell K, et al. Trinucleotide repeat length and progression of illness in Hun- tington’s disease. J Med Genet 1994;31:872-874.
14. Esmaeilzadeh M, Ciarmiello A, Squitieri F. Seeking brain biomarkers for preventive therapy in Huntington disease. CNS Neurosci Ther 2011;
17:368-386.
15. Squitieri F, Cannella M, Frati L. Molecular medicine: predicting and preventing Huntington’s disease. Neurol Sci 2008;29:205-207.
16. Aylward EH, Codori AM, Barta PE, Pearlson GD, Harris GJ, Brandt J.
Basal ganglia volume and proximity to onset in presymptomatic Hun- tington disease. Arch Neurol 1996;53:1293-1296.
17. Aylward EH, Brandt J, Codori AM, Mangus RS, Barta PE, Harris GJ.
Reduced basal ganglia volume associated with the gene for Hunting- ton’s disease in asymptomatic at-risk persons. Neurology 1994;44:
823-828.
18. Antonini A, Leenders KL, Eidelberg D. [11C]raclopride-PET studies of the Huntington’s disease rate of progression: relevance of the trinu- cleotide repeat length. Ann Neurol 1998;43:253-255.
19. Thieben MJ, Duggins AJ, Good CD, Gomes L, Mahant N, Richards F, et al. The distribution of structural neuropathology in pre-clinical Hun- tington’s disease. Brain 2002;125:1815-1828.
20. Rosas HD, Koroshetz WJ, Chen YI, Skeuse C, Vangel M, Cudkowicz ME, et al. Evidence for more widespread cerebral pathology in early HD: an MRI-based morphometric analysis. Neurology 2003;60:1615- 1620.
21. Ciarmiello A, Cannella M, Lastoria S, Simonelli M, Frati L, Rubinsz- tein DC, et al. Brain white-matter volume loss and glucose hypome- tabolism precede the clinical symptoms of Huntington’s disease. J Nucl Med 2006;47:215-222.