Is Vitamin D an Independent Risk Factor of Nonalcoholic Fatty Liver Disease?: a Cross-Sectional Study of the Healthy Population
The association between vitamin D levels and nonalcoholic fatty liver disease (NAFLD) has been recognized. However, few studies showed independent associations between vitamin D deficiency and NAFLD after a sex-related adjustment for metabolic factors. We aimed to study whether vitamin D deficiency is an independent risk factor of NAFLD even after controlling for metabolic syndrome and visceral fat in both sexes. In this cross-sectional study, 7,514 Korean adults (5,278 men, 2,236 women) participated in a health check-up program. They underwent blood tests, abdominal computed tomography (CT) of the visceral fat area, and ultrasonography for NAFLD screening. Multiple logistic regression analysis was used to investigate the association of vitamin D deficiency with NAFLD according to the sex differences. Vitamin D deficiency is associated with NAFLD. The adjusted odds ratio (aOR) for NAFLD increased sequentially with decreasing vitamin D level, even after adjusting for metabolic syndrome and visceral fat. The subjects in the vitamin D sufficiency group (20–30 ng/mL) had an aOR for NAFLD of 1.18 (95% CI, 1.00–1.39), whereas the deficiency group (< 20 ng/mL) had an aOR of 1.29 (95% CI, 1.10–1.52).
However, we have detected a significant sex-related interaction when analyzing the results. A significant relationship between vitamin D deficiency and NAFLD was found in men (aOR, 1.33; 95% CI, 1.11–1.60) but not in women.
Keywords: Vitamin D; Non-Alcoholic Fatty Liver Disease; Metabolic Syndrome X;
Intra-Abdominal Fat; Sex Danbee Park,1 Hyuktae Kwon,1,2
Seung-Won Oh,2 Hee-Kyung Joh,1,3,4 Seung-sik Hwang,5 Jin Ho Park,1 Jae Moon Yun,1 Hyejin Lee,1 Goh Eun Chung,6 Sangjoon Ze,1 Jae Hong Park,1 Yeseul Bae,1 and Arang Lee1
1Department of Family Medicine, Seoul National University Hospital, Seoul, Korea; 2Department of Family Medicine, Healthcare System Gangnam Center, Seoul National University Hospital, Seoul, Korea; 3Department of Medicine, Seoul National University College of Medicine, Seoul, Korea;
4Department of Family Medicine, Seoul National University Health Service Center, Seoul, Korea;
5Department of Social and Preventive Medicine, Inha University School of Medicine, Incheon, Korea;
6Department of Internal Medicine, Healthcare System Gangnam Center, Seoul National University Hospital, Seoul, Korea
Received: 25 June 2016 Accepted: 8 October 2016 Address for Correspondence:
Hyuktae Kwon, MD
Department of Family Medicine, Seoul National University Hospital, 101, Daehak-ro, Jongno-gu, Seoul 03080, Korea E-mail: [email protected]
Funding: This work was supported by the Technology Innovation Program (10050154, Business Model Development for Personalized Medicine Based on Integrated Genome and Clinical Information) funded by the Ministry of Trade, Industry and Energy (MI, Korea).
https://doi.org/10.3346/jkms.2017.32.1.95 • J Korean Med Sci 2017; 32: 95-101
INTRODUCTION
Nonalcoholic fatty liver disease (NAFLD) includes simple fatty liver, nonalcoholic steatohepatitis, cirrhosis, and hepatocellular carcinoma (1). In western countries, the prevalence of NAFLD has increased to as high as 30%, and this disease has become the most common chronic liver disease (2). A study on NAFLD diagnosed with sonography reported that the prevalence of this disease in Korea is estimated to be as high as 16%–33% (3,4).
NAFLD is known to be related to obesity, type 2 diabetes, and metabolic syndrome (1,5). Furthermore, there have been sev- eral data showing that insulin resistance (IR) and visceral adi- pose tissue are associated with the pathogenesis NAFLD (6,7).
In recent years, vitamin D has commonly been associated with NAFLD. A biopsy study of NAFLD showed that subjects with NAFLD had lower levels of serum 25-hydroxyvitamin D3
[25(OH)D3] than healthy controls, and that low 25(OH)D3 levels were related to the severity of the hepatic histology of NAFLD subjects (8). Moreover, a recent meta-analysis reported that vi- tamin D deficiencies were 26% more common in NAFLD pati- ents than in healthy persons (9).
Several studies indicated that vitamin D deficiency is related to metabolic syndrome, obesity, and IR (10,11). Because of the relationship of NAFLD with obesity and metabolic syndrome, the association of vitamin D deficiency with NAFLD could be linked to metabolic factors. However, several researches indi- cated the existence of an independent association between vi- tamin D levels and NAFLD. Recent cross-sectional studies of Korean population evidenced inverse associations between se- rum 25(OH)D3 levels and NAFLD after adjustment for meta- bolic syndrome or metabolic factors (12,13). Another study on a population-based cohort in Ansan, Korea (n = 1,081), sug- Gastroenterology & Hepatology
gested that a low vitamin D level is related to NAFLD after con- trolling for visceral fat in subjects with diabetes or IR (14). How- ever, it is difficult to find a large population-based study in which both metabolic syndrome and visceral fat are considered.
Furthermore, according to the population-based study, NA- FLD is more prevalent in men (3), and vitamin D deficiency is more frequently detected in women (15). However, there are only a few studies that have considered sex a factor that affects the association of vitamin D deficiency and NAFLD.
Therefore, the aim of the current study was to analyze the as- sociation of vitamin D deficiency and NAFLD after adjustment for metabolic syndrome and visceral fat. Additionally, this study aimed to investigate the independent association between vita- min D deficiency and NAFLD in a large population according to the sex of the subjects.
MATERIALS AND METHODS Study population
In the present study, we investigated the participants in a health- screening program at the Healthcare System Gangnam Center and the Health Promotion/Disease Prevention Center of Seoul National University Hospital, Seoul, Korea.
The study population consisted of 12,835 eligible subjects who had undergone blood tests for serum 25(OH)D3 levels, ab- dominal sonography, and computed tomography (CT) for vis- ceral fat mass. Furthermore, the exact data for alcohol consump- tion from January 1, 2008 to July 31, 2015 were recorded. The exclusion criteria were as follows: subjects who tested positive in serological tests for hepatitis B or C virus (n = 680); those who drank excessive alcohol, as defined by an average alcohol in- take of 210 g/week in men (n = 1,617) or 140 g/week in women (n = 214), according to the American Association for Study of
Liver Diseases guideline (5); those with evidence of a disease that could have an influence on the liver (n = 1,582), such as liver cirrhosis, cardiovascular disorder (i.e., stroke, angina, and myocardial infarction), cancer, and chronic kidney diseases;
those who were taking medications that can affect the 25(OH) D3 level, such as medication for osteoporosis and vitamin sup- plementation (multivitamin and/or vitamin D) (n = 926); those who underwent multiple health check-ups during the study pe- riod (n = 216; only the first-visit data were analyzed); and those with any missing essential information (n = 86), such as systolic blood pressure (SBP), diastolic blood pressure (DBP), triglycer- ide, high-density lipoprotein (HDL), fasting glucose, body mass index (BMI), and waist circumference (WC). After the applica- tion of these exclusion criteria, the final study population com- prised 7,514 subjects (5,278 men and 2,236 women) (Fig. 1).
Diagnosis of NAFLD
NAFLD was diagnosed by using abdominal ultrasonography (Acuson, Sequoia 512; Siemens, Mountain View, CA, USA) car- ried out by well-trained radiologists. A diagnosis of fatty liver was made if hepatorenal contrast and liver brightness were ob- served (16).
Anthropometric and laboratory measurements
The height and weight of the subjects were measured while they were wearing a light gown. The WC was measured at the mid- point between the lower costal margin and the iliac crest. The BMI was calculated as the weight in kilograms (kg) divided by the square of the height in meters (kg/m2). After resting for > 10 minutes, blood pressure was measured in a sitting position.
Blood test was performed after an overnight fast, for measure- ments of serum glucose, total cholesterol, triglyceride, HDL, in- sulin, aspartate aminotransferase (AST), alanine aminotrans-
Participants who had serum 25(OH)D3 level, abdominal sonography, and visceral fat mass results, and data for alcohol consumption in health-screening program in Seoul National University Hospital (n = 12,835)
: at HPDPC from January 1, 2008 to March 31, 2015 (n = 4,306), : at HCSGC from April 1, 2008 to July 31, 2015 (n = 8,529)
Excluded (n = 5,321)
Positive serology for hepatitis B or C virus (n = 680)
Alcohol consumption in excess of 210 g/week in men, 140 g/week in women (n = 1,831)
Presence of medical illnesses that could affect liver function, such as liver cirrhosis, cancer, cardiovascular disease, chronic kidney disease (n = 1,582)
History of medications that could affect the 25(OH)D3 level, such as osteoporosis drugs and vitamin supplementation (n = 926)
Multiple health check-up data (n = 216) Any missing parameters (n = 86)
Final study population (n = 7,514, 5,278 men, 2,236 women) Fig. 1. Study population.
25(OH)D3 = 25-hydroxyvitamin D3, HPDPC = Health Promotion/Disease Prevention Center, HCSGC = Healthcare System Gangnam Center.
ferase (ALT), gamma glutamyltransferase (GGT), calcium, phos- phorus, hepatitis B surface antigen, antibody to hepatitis C vi- rus, and 25(OH)D3 levels. Serum 25(OH)D3 levels were mea- sured by radioimmunoassay (DiaSorin, Stillwater, MN, USA).
IR was calculated as fasting glucose (mM/L) × fasting insulin (μU/mL)/22.5 by using the homeostasis model (homeostasis model assessment of insulin resistance [HOMA-IR]) (17).
Metabolic syndrome was defined according to the National Cholesterol Education Program Adult Treatment Panel III crite- ria and the Asia-Pacific criteria for WC (18). Metabolic syndrome was diagnosed if three or more of the following criteria were present: abdominal obesity (≥ 90 cm in men and ≥ 80 cm in women), elevated triglyceride level (≥ 150 mg/dL or treated for dyslipidemia), reduced HDL level (< 40 mg/dL in men, < 50 mg/dL in women, or treated for dyslipidemia), elevated blood pressure (SBP ≥ 130 mmHg, DBP ≥ 85 mmHg, or treated for hypertension), and elevated fasting blood glucose level (≥ 100 mg/dL or treated for hyperglycemia).
Measurement of the visceral fat using computed tomography (CT)
A 16-detector row CT imaging of the abdomen (Somatom Sen- sation 16; Siemens Medical Solutions, Forchheim, Germany) was used to evaluate the visceral fat. A 5-mm-thick slice at the umbilical level was obtained, and the visceral fat area was de- termined by using the Rapidia 2.8 software (INFINITT, Seoul, Korea), which detected the visceral fat area by setting the atten- uation values within a range of -250 to -50 Hounsfield units.
Other clinical assessments
Medication for hypertension, dyslipidemia, diabetes was con- firmed by using a self-reported questionnaire. We also surveyed lifestyle of the subjects, including alcohol consumption, smok- ing, and physical activity. For smoking status, the subjects were categorized as nonsmoker, ex-smoker, and current smoker. Phys- ical activity was classified as inactive (< 600 metabolic equiva- lents [MET]-min/week), minimally active (≥ 600 and < 3,000 MET-min/week), and health-enhancing physical activity (≥ 3,000 MET-min/week) according to the International Physical Activi- ty Questionnaire. This questionnaire is available online (www.
ipaq.ki.se).
Statistical analysis
Statistical analyses were performed by using STATA, version 14.0 (Stata Corp., College Station, TX, USA). The general char- acteristics of the subjects who were grouped by NAFLD or sex were compared by using Student’s t-test for continuous data and Pearson’s χ2 test for categorical variables. We analyzed the associations between the 25(OH)D3 levels and each metabolic variable with regression models. Each model was adjusted for age, month of measurement, and physical activity because the
vitamin D status is greatly affected by these factors. Three mod- els were analyzed with multiple logistic regression to investigate the association between vitamin D deficiency and NAFLD after adjusting for variables such as age, month of measurement, smo- king, physical activity, BMI, health check-up center, metabolic syndrome, and visceral fat. Vitamin D status was divided into three categories according to the 25(OH)D3 level: deficiency (< 20 ng/mL), insufficiency (20–30 ng/mL), and sufficiency (≥ 30 ng/mL). The statistical interactions were tested between sex and vitamin D in adjusted models with a multiplicative term.
As a sensitivity analysis, HOMA-IR was additionally added to the regression model in a subgroup of participants who had their HOMA-IR level measured. The women were divided into two groups (< 55 years old, ≥ 55 years old), and this enabled taking menopause into consideration in our regression model.
Significance was defined as P < 0.05. All reported P values were two-tailed.
Ethics statement
The participants gave their informed consent for using their health check-up data. The present study was conducted accor- ding to the principles of the Declaration of Helsinki of the World Medical Association, and was accepted by the Institutional Re- view Board (IRB) at Seoul National University Hospital (IRB No.
1506-083-681).
RESULTS
General characteristics
NAFLD was found in 3,104 subjects (41.3%). The subjects with NAFLD were older and had more unfavorable metabolic pro- files such as higher BMI, fasting glucose, cholesterol, and blood pressure. The NAFLD group had more visceral fat (150.0 cm2 vs.
94.6 cm2) and a higher prevalence of metabolic syndrome (36.1%
vs. 9.5%). Furthermore, they were more inactive and more likely to be current smokers. The men showed more unfavorable met- abolic profiles such as higher BMI, fasting glucose, blood pres- sure, visceral fat, and chronic current smoker. Women were less physically active than men, and a higher proportion of women than men had vitamin D deficiency (< 20 ng/mL; 57.6% vs. 44.2%).
The characteristics of the study population are presented in Ta- ble 1.
Correlation between serum 25(OH)D3 levels and metabolic variables
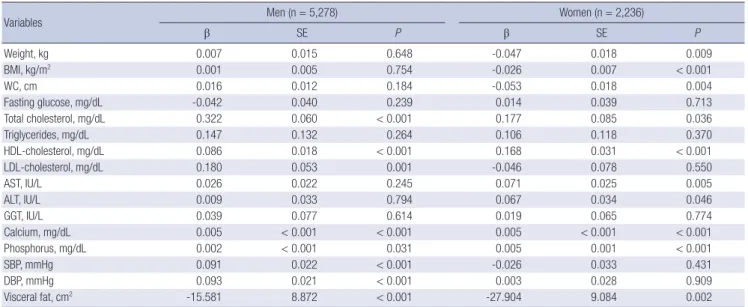
After adjusting for age, month of measurement, and physical activity, the serum 25(OH)D3 levels were found to be negatively correlated with BMI and WC in women only, and positively cor- related with HDL and negatively correlated with visceral fat in both sexes (Table 2).
Table 1. General characteristics
Parameters Total (n = 7,514) Total (n = 7,514)
No NAFLD NAFLD P Men Women P
No., % 4,410 (58.7) 3,104 (41.3) 5,278 (70.2) 2,236 (29.8)
Age, yr 52.7 ± 9.3 53.4 ± 8.6 < 0.001 53.7 ± 9.2 51.4 ± 8.6 < 0.001
Weight, kg 62.5 ± 10.1 71.9 ± 10.2 < 0.001 70.9 ± 9.3 55.8 ± 7.4 < 0.001
BMI, kg/m2 22.6 ± 2.6 25.3 ± 2.7 < 0.001 24.3 ± 2.7 22.2 ± 2.9 < 0.001
WC, cm 82.2 ± 7.7 89.9 ± 7.2 < 0.001 87.8 ± 7.4 79.7 ± 7.9 < 0.001
Fasting glucose, mg/dL 93.1 ± 18.4 102.7 ± 21.8 < 0.001 99.7 ± 21.4 91.0 ± 16.3 < 0.001
Total cholesterol, mg/dL 194.2 ± 34.3 200.6 ± 36.9 < 0.001 195.3 ± 35.6 200.6 ± 35.2 < 0.001
Triglycerides, mg/dL 88.3 ± 53.5 139.8 ± 86.0 < 0.001 120.7 ± 78.9 83.4 ± 49.0 < 0.001
HDL-cholesterol, mg/dL 55.0 ± 12.6 48.1 ± 10.0 < 0.001 49.4 ± 10.6 58.7 ± 12.9 < 0.001
SBP, mmHg 116.2 ± 13.9 121.9 ± 13.4 < 0.001 120.6 ± 13.3 113.6 ± 14.1 < 0.001
DBP, mmHg 66.1 ± 12.1 70.4 ± 13.1 < 0.001 69.9 ± 12.5 63.2 ± 11.7 < 0.001
Visceral fat, cm2 94.6 ± 47.9 150.0 ± 48.7 < 0.001 133.4 ± 52.8 80.0 ± 41.4 < 0.001
25(OH)D3, ng/mL 21.8 ± 8.7 21.5 ± 8.1 0.151 22.4 ± 8.3 20.2 ± 8.8 < 0.001
< 20, No. (%) 2,110 (47.8) 1,512 (48.7) 0.120 2,333 (44.2) 1,289 (57.6) < 0.001
20–30, No. (%) 1,563 (35.4) 1,128 (36.3) 2,043 (38.7) 648 (29.0)
≥ 30, No. (%) 737 (16.7) 464 (14.9) 902 (17.1) 299 (13.4)
Metabolic syndrome, No. (%)* 421 (9.5) 1,120 (36.1) < 0.001 1,217 (23.1) 324 (14.5) < 0.001
Physical activity†
Inactive, No. (%) 816 (18.5) 647 (20.8) 0.035 1,018 (19.3) 445 (19.9) < 0.001
Minimal, No. (%) 1,885 (42.7) 1,264 (40.7) 2,312 (43.8) 837 (37.4)
HEPA, No. (%) 586 (13.3) 382 (12.3) 742 (14.1) 226 (10.1)
Smoking
Nonsmoker, No. (%) 1,832 (41.5) 872 (28.1) < 0.001 1,100 (20.8) 1,604 (71.7) < 0.001
Ex-smoker, No. (%) 1,221 (27.7) 1,145 (36.9) 2,289 (43.4) 77 (3.4)
Current smoker, No. (%) 726 (16.5) 650 (20.9) 1,301 (24.6) 75 (3.4)
Continuous variables are expressed as mean ± standard deviation.
NAFLD = nonalcoholic fatty liver disease, BMI = body mass index, WC = waist circumference, HDL = high-density lipoprotein, SBP = systolic blood pressure, DBP = diastolic blood pressure, 25(OH)D3= 25-hydroxyvitamin D3, HEPA = health-enhancing physical activity.
*Defined according to the National Cholesterol Education Program Adult Treatment Panel III criteria; †Classified according to the International Physical Activity Questionnaire; in- active, < 600 MET-min/week; minimal, 600–3,000 MET-min/week; HEPA, ≥ 3,000 MET-min/week.
Table 2. Adjusted regression coefficients between the 25(OH)D3 level and the metabolic variables
Variables Men (n = 5,278) Women (n = 2,236)
β SE P β SE P
Weight, kg 0.007 0.015 0.648 -0.047 0.018 0.009
BMI, kg/m2 0.001 0.005 0.754 -0.026 0.007 < 0.001
WC, cm 0.016 0.012 0.184 -0.053 0.018 0.004
Fasting glucose, mg/dL -0.042 0.040 0.239 0.014 0.039 0.713
Total cholesterol, mg/dL 0.322 0.060 < 0.001 0.177 0.085 0.036
Triglycerides, mg/dL 0.147 0.132 0.264 0.106 0.118 0.370
HDL-cholesterol, mg/dL 0.086 0.018 < 0.001 0.168 0.031 < 0.001
LDL-cholesterol, mg/dL 0.180 0.053 0.001 -0.046 0.078 0.550
AST, IU/L 0.026 0.022 0.245 0.071 0.025 0.005
ALT, IU/L 0.009 0.033 0.794 0.067 0.034 0.046
GGT, IU/L 0.039 0.077 0.614 0.019 0.065 0.774
Calcium, mg/dL 0.005 < 0.001 < 0.001 0.005 < 0.001 < 0.001
Phosphorus, mg/dL 0.002 < 0.001 0.031 0.005 0.001 < 0.001
SBP, mmHg 0.091 0.022 < 0.001 -0.026 0.033 0.431
DBP, mmHg 0.093 0.021 < 0.001 0.003 0.028 0.909
Visceral fat, cm2 -15.581 8.872 < 0.001 -27.904 9.084 0.002
Each model was adjusted for age (continuous), month of measurement (January to December), and physical activity (inactive/minimal activity/health-enhancing physical activity).
25(OH)D3= 25-hydroxyvitamin D3, SE = standard error, BMI = body mass index, WC = waist circumference, HDL = high-density lipoprotein, LDL = low-density lipoprotein, AST = aspartate aminotransferase, ALT = alanine aminotransferase, GGT = gamma glutamyltransferase, SBP = systolic blood pressure, DBP = diastolic blood pressure.
Vitamin D deficiency and NAFLD
Table 3 shows that the odds ratio (OR) for NAFLD increased se- quentially with a deteriorating vitamin D status in all models.
Vitamin D insufficiency and deficiency were associated with NAFLD even after controlling for both metabolic syndrome and visceral fat (OR [95% CI] for NAFLD, 1.18 [1.00–1.39] in the in- sufficiency group and 1.29 [1.10–1.52] in the deficiency group compared with that in the sufficiency group; Ptrend across vita- min D status = 0.002). The relationship between vitamin D de- ficiency and NAFLD was influenced by sex. We observed a sig- nificant interaction between sex and the vitamin D status (P <
0.05). In men, both vitamin D insufficiency and deficiency were associated with NAFLD (OR [95% CI] for NAFLD, 1.28 [1.06–1.53]
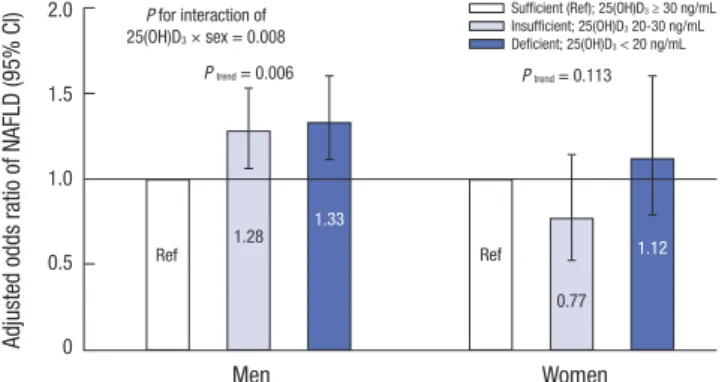
in the insufficiency group and 1.33 [1.11–1.60] in the deficiency group compared with that in the sufficiency group; Ptrend across vitamin D status = 0.006). However, vitamin D status was not significantly associated with NAFLD in women after adjustment for possible confounders (Fig. 2).
Sensitivity analysis
In the subgroup of participants who had their insulin level mea- sured, HOMA-IR was added as a confounder in the regression model. Similarly, the relationship between vitamin D deficien- cy and NAFLD was observed in men only (Supplementary Ta- ble 1). Additionally, when we analyzed the two groups of wom- en (younger or older than the menopausal age of 55 years), the association was not statistically significant in both groups; how- ever, women ≥ 55 years old showed a trend of a positive corre- lation between vitamin D deficiency and NAFLD (Supplemen- tary Table 2).
DISCUSSION
In the present study, we found that vitamin D deficiency could be an independent risk factor of NAFLD among Korean men.
Although a few studies have suggested an inverse association between vitamin D and NAFLD after controlling for metabolic features, these studies either had a small population (8) or only
considered metabolic syndrome (12) or visceral fat (14).
The present study revealed that the association between vita- min D deficiency and NAFLD persisted even after controlling for both metabolic syndrome and visceral fat in a large popula- tion. In a subgroup analysis with measurement of insulin level, this association persisted after further adjustment for HOMA- IR (Supplementary Table 1). This could mean that vitamin D de- ficiency is an independent risk factor of NAFLD in men.
To our knowledge, this is the first cross-sectional study that examined the effect of the sex on the relationship between vita- min D deficiency and NAFLD while considering a sufficiently large number of healthy subjects. Most previous studies did not analyze subjects according to sex. The few studies on the sex- related effect of vitamin D deficiency on NAFLD investigated either men alone (12) or postmenopausal women (19,20), and showed a positive association between vitamin D deficiency and NAFLD.
In our study, there was a significant interaction between sex and vitamin D status. Therefore, we analyzed the association between vitamin D and NAFLD by sex, and observed a sex dis- parity. The positive association between vitamin D deficiency and NAFLD in men was consistent with that reported in previ- ous studies. Additionally, we adjusted for both metabolic syn- drome and visceral fat to demonstrate the independent effect of vitamin D deficiency on NAFLD. However, the association between vitamin D and NAFLD in women was not significantly correlated.
The mechanisms underlying the sex-related association be- tween vitamin D deficiency and NAFLD are still largely unknown.
A possible mechanism for the sex differences could be that sex hormones may be mediators of NAFLD. Testosterone deficien- Table 3. The association between NAFLD and serum 25(OH)D3 levels
Models OR (95% CI) for 25(OH)D3, ng/mL P for
trend
≥ 30 (n = 1,201) 20–30 (n = 2,691) < 20 (n = 3,622) Model 1 Ref. 1.11 (0.95–1.29) 1.26 (1.08–1.47) 0.001 Model 2 Ref. 1.14 (0.97–1.34) 1.28 (1.10–1.50) 0.001 Model 3 Ref. 1.18 (1.00–1.39) 1.29 (1.10–1.52) 0.002 Model 1: adjusted for age (continuous), BMI (continuous), month of measurement (January to December), smoking (nonsmoker/ex-smoker/current smoker), physical activity (inactive/minimal activity/health-enhancing physical activity), and health check- up center (HPDPC/HCSGC); Model 2: model 1 + metabolic syndrome (present/absent);
Model 3: model 2 + visceral fat (continuous).
NAFLD = nonalcoholic fatty liver disease, 25(OH)D3= 25-hydroxyvitamin D3, OR = odds ratio, CI = confidence interval, BMI = body mass index, HPDPC = Health Promotion
Disease Prevention Center, HCSGC = Healthcare System Gangnam Center. Fig. 2. aOR of NAFLD according to 25(OH)D3. Logistic regression aOR (95% CI) of NAFLD according to the serum 25(OH)D3 level compared with the sufficient (≥ 30 ng/
mL) reference group by sex (light gray bar: insufficient [20–30 ng/mL]; dark gray bar:
deficient [<20 ng/mL]). The regression model is adjusted for age (continuous), BMI (continuous), month of measurement (January to December), smoking (nonsmoker/
ex-smoker/current smoker), physical activity (inactive/minimal activity/health-enhanc- ing physical activity), health check-up center (HPDPC/HCSGC), metabolic syndrome (present/absent), and visceral fat (continuous).
aOR = adjusted odds ratio, NAFLD = nonalcoholic fatty liver disease, 25(OH)D3 = 25- hydroxyvitamin D3, CI=confidence interval, BMI=body mass index, HPDPC=Health Promotion Disease Prevention Center, HCSGC = Healthcare System Gangnam Center.
Adjusted odds ratio of NAFLD (95% CI)
Men Women
2.0
1.5
1.0
0.5
0
P for interaction of 25(OH)D3 × sex = 0.008
P trend = 0.006 P trend = 0.113
Ref 1.28 Ref
1.33
0.77 Ref 1.12
Sufficient (Ref); 25(OH)D3 ≥ 30 ng/mL Insufficient; 25(OH)D3 20-30 ng/mL Deficient; 25(OH)D3 < 20 ng/mL
cy is a risk factor of NAFLD (21). A cross-sectional study includ- ing 2,299 men suggested that vitamin D deficiency could result in testosterone deficiency (22). Furthermore, a small random- ized controlled trial proposed that vitamin D supplementation tends to increase the production of testosterone in men (23).
There is another biological evidence showing that the vitamin D receptor (VDR) and enzymes related to vitamin D metabo- lism are widely expressed in the male reproductive system (24).
Thus, vitamin D deficiency could result in NAFLD through the testosterone level.
Moreover, a sex-related VDR genetic variation could be an- other explanation. A VDR genetic variation is known to influ- ence the association between vitamin D status and various dis- eases (25). In one case-control study on the Italian population, the association between VDR polymorphism and various lum- bar spinal diseases was affected by sex (26). Although there has been no clinical study to show the sex effect on the relationship between VDR polymorphism and NAFLD, this could be a plau- sible explanation for our finding.
Unmeasured confounders may have also affected the null findings in women. NAFLD is greatly influenced by lifestyle, such as physical activity, diet, alcohol consumption, and smoking.
For some of these factors, we could not perform measurements and adjustments.
This study has some limitations. First, NAFLD was diagnosed by means of sonography instead of biopsy, which is the gold standard. Therefore, we could not differentiate between simple steatosis and nonalcoholic steatohepatitis, which have different prognosis. However, it is not appropriate to conduct an invasive procedure in a large epidemiological study (27). Second, althou- gh, through the laboratory results or questionnaire, we exclud- ed subjects with illnesses that could affect the liver function, rare liver diseases such as hemachromatosis or Wilson’s disease were not completely excluded. Third, although the menopausal sta- tus and information on hormone replacement therapy (HRT) are very important in the analyses of female subjects, many of them did not answer the questions on their menopausal status and HRT. Furthermore, when we analyzed women of age ≥ 55 years (most of them were presumed to be in menopause con- sidering the average menopausal age of 50 years in Korean wom- en), there was a marginal association between vitamin D defi- ciency and NAFLD (OR, 1.57; 95% CI, 0.96–2.58; Supplementa- ry Table 2). This association should be confirmed with a well- designed prospective study. Fourth, owing to the cross-section- al design of this study, the causal relationship between vitamin D deficiency and NAFLD could not be defined. Also, the study subjects were participants in a health-screening program con- ducted by a university hospital, so this study’s findings have lim- ited generalizability.
Despite these limitations, this is the first study to clarify the sex-related association of vitamin D deficiency and NAFLD af-
ter controlling for metabolic syndrome and visceral fat. Further prospective studies are needed to identify the causal relation- ship between vitamin D status and NAFLD, and well-designed randomized clinical trials could show whether vitamin D sup- plement can improve NAFLD.
DISCLOSURE
The authors have no potential conflicts of interest to disclose.
AUTHOR CONTRIBUTION
Study conception: Kwon H, Chung GE. Data collection: Kwon H, Park JH, Yoon JM, Lee H, Park D. Analysis and interpretation of data: Kwon H, Oh SW, Joh HK, Hwang S, Park D, Ze S, Park JH, Bae YS, Lee A. Manuscript drafting: Kwon H, Park D. Review and approval of the final version of the manuscript: all authors.
ORCID
Danbee Park http://orcid.org/0000-0003-1402-4890 Hyuktae Kwon http://orcid.org/0000-0002-0312-3650 Seung-Won Oh http://orcid.org/0000-0003-3800-0754 Hee-Kyung Joh http://orcid.org/0000-0003-3854-7012 Seung-sik Hwang http://orcid.org/0000-0002-1558-7831 Jin Ho Park http://orcid.org/0000-0002-3942-6813 Jae Moon Yun http://orcid.org/0000-0003-0927-4721 Hyejin Lee http://orcid.org/0000-0001-5279-340X Goh Eun Chung http://orcid.org/0000-0001-9755-0452 Sangjoon Ze http://orcid.org/0000-0003-3641-8081 Jae Hong Park http://orcid.org/0000-0002-7653-491X Yeseul Bae http://orcid.org/0000-0003-0763-5458 Arang Lee http://orcid.org/0000-0002-5899-3602 REFERENCES
1. Yki-Järvinen H. Non-alcoholic fatty liver disease as a cause and a conse- quence of metabolic syndrome. Lancet Diabetes Endocrinol 2014; 2: 901- 10.
2. Lazo M, Clark JM. The epidemiology of nonalcoholic fatty liver disease: a global perspective. Semin Liver Dis 2008; 28: 339-50.
3. Park SH, Jeon WK, Kim SH, Kim HJ, Park DI, Cho YK, Sung IK, Sohn CI, Keum DK, Kim BI. Prevalence and risk factors of non-alcoholic fatty liver disease among Korean adults. J Gastroenterol Hepatol 2006; 21: 138-43.
4. Choi SY, Kim D, Kim HJ, Kang JH, Chung SJ, Park MJ, Kim YS, Kim CH, Choi SH, Kim W, et al. The relation between non-alcoholic fatty liver disease and the risk of coronary heart disease in Koreans. Am J Gastroenterol 2009;
104: 1953-60.
5. Chalasani N, Younossi Z, Lavine JE, Diehl AM, Brunt EM, Cusi K, Charl- ton M, Sanyal AJ. The diagnosis and management of non-alcoholic fatty liver disease: practice guideline by the American Association for the Study of Liver Diseases, American College of Gastroenterology, and the Ameri-
can Gastroenterological Association. Hepatology 2012; 55: 2005-23.
6. Eguchi Y, Mizuta T, Sumida Y, Ishibashi E, Kitajima Y, Isoda H, Horie H, Tashiro T, Iwamoto E, Takahashi H, et al. The pathological role of visceral fat accumulation in steatosis, inflammation, and progression of nonalco- holic fatty liver disease. J Gastroenterol 2011; 46 Suppl 1: 70-8.
7. Kumashiro N, Erion DM, Zhang D, Kahn M, Beddow SA, Chu X, Still CD, Gerhard GS, Han X, Dziura J, et al. Cellular mechanism of insulin resis- tance in nonalcoholic fatty liver disease. Proc Natl Acad Sci U S A 2011;
108: 16381-5.
8. Targher G, Bertolini L, Scala L, Cigolini M, Zenari L, Falezza G, Arcaro G.
Associations between serum 25-hydroxyvitamin D3 concentrations and liver histology in patients with non-alcoholic fatty liver disease. Nutr Metab Cardiovasc Dis 2007; 17: 517-24.
9. Eliades M, Spyrou E, Agrawal N, Lazo M, Brancati FL, Potter JJ, Koteish AA, Clark JM, Guallar E, Hernaez R. Meta-analysis: vitamin D and non- alcoholic fatty liver disease. Aliment Pharmacol Ther 2013; 38: 246-54.
10. Ju SY, Jeong HS, Kim DH. Blood vitamin D status and metabolic syndrome in the general adult population: a dose-response meta-analysis. J Clin Endocrinol Metab 2014; 99: 1053-63.
11. Forouhi NG, Luan J, Cooper A, Boucher BJ, Wareham NJ. Baseline serum 25-hydroxy vitamin D is predictive of future glycemic status and insulin resistance: the Medical Research Council Ely Prospective Study 1990-2000.
Diabetes 2008; 57: 2619-25.
12. Rhee EJ, Kim MK, Park SE, Park CY, Baek KH, Lee WY, Kang MI, Park SW, Kim SW, Oh KW. High serum vitamin D levels reduce the risk for nonal- coholic fatty liver disease in healthy men independent of metabolic syn- drome. Endocr J 2013; 60: 743-52.
13. Chung GE, Kim D, Kwak MS, Yang JI, Yim JY, Lim SH, Itani M. The serum vitamin D level is inversely correlated with nonalcoholic fatty liver dis- ease. Clin Mol Hepatol 2016; 22: 146-51.
14. Seo JA, Eun CR, Cho H, Lee SK, Yoo HJ, Kim SG, Choi KM, Baik SH, Choi DS, Yim HJ, et al. Low vitamin D status is associated with nonalcoholic fatty liver disease independent of visceral obesity in Korean adults. PLoS One 2013; 8: e75197.
15. Lee K. Body composition and vitamin D status: the Korea National Health and Nutrition Examination Survey IV (KNHANES IV). J Hum Nutr Diet 2013; 26 Suppl 1: 105-13.
16. Kojima S, Watanabe N, Numata M, Ogawa T, Matsuzaki S. Increase in the prevalence of fatty liver in Japan over the past 12 years: analysis of clinical background. J Gastroenterol 2003; 38: 954-61.
17. Matthews DR, Hosker JP, Rudenski AS, Naylor BA, Treacher DF, Turner RC. Homeostasis model assessment: insulin resistance and β-cell func- tion from fasting plasma glucose and insulin concentrations in man. Dia- betologia 1985; 28: 412-9.
18. Grundy SM, Cleeman JI, Daniels SR, Donato KA, Eckel RH, Franklin BA, Gordon DJ, Krauss RM, Savage PJ, Smith SC Jr, et al. Diagnosis and man- agement of the metabolic syndrome: an American Heart Association/
National Heart, Lung, and Blood Institute Scientific Statement. Circula- tion 2005; 112: 2735-52.
19. Wang N, Zhai H, Zhu C, Li Q, Han B, Chen Y, Zhu C, Chen Y, Xia F, Lin D, et al. Combined association of vitamin D and sex hormone binding glob- ulin with nonalcoholic fatty liver disease in men and postmenopausal women: a cross-sectional study. Medicine (Baltimore) 2016; 95: e2621.
20. Lu Z, Pan X, Hu Y, Hao Y, Luo Y, Hu X, Ma X, Bao Y, Jia W. Serum vitamin D levels are inversely related with non-alcoholic fatty liver disease inde- pendent of visceral obesity in Chinese postmenopausal women. Clin Exp Pharmacol Physiol 2015; 42: 139-45.
21. Kim S, Kwon H, Park JH, Cho B, Kim D, Oh SW, Lee CM, Choi HC. A low level of serum total testosterone is independently associated with nonal- coholic fatty liver disease. BMC Gastroenterol 2012; 12: 69.
22. Wehr E, Pilz S, Boehm BO, März W, Obermayer-Pietsch B. Association of vitamin D status with serum androgen levels in men. Clin Endocrinol (Oxf) 2010; 73: 243-8.
23. Pilz S, Frisch S, Koertke H, Kuhn J, Dreier J, Obermayer-Pietsch B, Wehr E, Zittermann A. Effect of vitamin D supplementation on testosterone lev- els in men. Horm Metab Res 2011; 43: 223-5.
24. Blomberg Jensen M, Nielsen JE, Jørgensen A, Rajpert-De Meyts E, Kris- tensen DM, Jørgensen N, Skakkebaek NE, Juul A, Leffers H. Vitamin D re- ceptor and vitamin D metabolizing enzymes are expressed in the human male reproductive tract. Hum Reprod 2010; 25: 1303-11.
25. Levin GP, Robinson-Cohen C, de Boer IH, Houston DK, Lohman K, Liu Y, Kritchevsky SB, Cauley JA, Tanaka T, Ferrucci L, et al. Genetic variants and associations of 25-hydroxyvitamin D concentrations with major clinical outcomes. JAMA 2012; 308: 1898-905.
26. Colombini A, Brayda-Bruno M, Ferino L, Lombardi G, Maione V, Banfi G, Cauci S. Gender differences in the VDR-FokI polymorphism and conven- tional non-genetic risk factors in association with lumbar spine patholo- gies in an Italian case-control study. Int J Mol Sci 2015; 16: 3722-39.
27. Joy D, Thava VR, Scott BB. Diagnosis of fatty liver disease: is biopsy neces- sary? Eur J Gastroenterol Hepatol 2003; 15: 539-43.