Enhanced Production of Carboxymethylcellulase by a Newly Isolated Marine Microorganism Bacillus atrophaeus LBH-18 Using Rice Bran, a Byproduct from the Rice Processing Industry
Yi-Joon Kim
1,2, Wa Cao
1,2, Sang-Un Lee
1,2and Jin-Woo Lee
2,3*
1
Department of Medical Bioscience, Graduate School of Donga-A University, Busan 604-714, Korea
2
BK21 Bio-Silver Program of Dong-A University, Busan 604-714, Korea
3
Department of Biotechnology, College of Natural Resources and Life Science, Dong-A Univeristy, Busan 604-714, Korea
Received July 30, 2012 /Revised October 10, 2012 /Accepted October 10, 2012A microorganism producing carboxymethylcellulase (CMCase) was isolated from seawater and identi- fied as Bacillus atrophaeus. This species was designated as B. atrophaeus LBH-18 based on its evolu- tionary distance and the phylogenetic tree resulting from 16S rDNA sequencing and the neighbor-join- ing method. The optimal conditions for rice bran (68.1 g/l), peptone (9.1 g/l), and initial pH (7.0) of the medium for cell growth was determined by Design Expert Software based on the response surface method; conditions for production of CMCase were 55.2 g/l, 6.6 g/l, and 7.1, respectively. The opti- mal temperature for cell growth and the production of CMCase by B. atrophaeus LBH-18 was 30℃.
The optimal conditions of agitation speed and aeration rate for cell growth in a 7-l bioreactor were 324 rpm and 0.9 vvm, respectively, whereas those for production of CMCase were 343 rpm and 0.6 vvm, respectively. The optimal inner pressure for cell growth and production of CMCase in a 100-l bioreactor was 0.06 MPa. Maximal production of CMCase under optimal conditions in a 100-l bio- reactor was 127.5 U/ml, which was 1.32 times higher than that without an inner pressure. In this study, rice bran was developed as a carbon source for industrial scale production of CMCase by B.
atrophaeus LBH-18. Reduced time for the production of CMCase from 7 to 10 days to 3 days by using a bacterial strain with submerged fermentation also resulted in increased productivity of CMCase and a decrease in its production cost.
Key words : Bacillus atrophaeus, carboxymethylcellulase, rice bran, response surface method
*Corresponding author
*Tel:+82-51-200-7593, Fax:+82-51-200-7505
*E-mail : [email protected]
Introduction
Cellulosic biomass has an enormous potential and its con- version to fermentable sugars represents a major challenge in global efforts to utilize renewable resources [2]. A major constrain in enzymatic saccharification of cellulosic biomass for the production of fermentable sugars is low productivity and the cost of cellulases [31]. The enzymatic hydrolysis of cellulosic biomass required the synergistic action of three types of enzymes: endoglucanses (carboxymethylcellulase, EC 3.2.1.4), exoglucanases (avicelase, EC 3.2.1.91), and cello- biases (β-glucosidase, EC 3.2.1.21) [3,38]. The enzymatic sac- charification of lignocellulosic materials for the production of ethanol was performed by commercial cellulases, in which the major cellulase was carboxymethylcellulase [35,36].
A number of cellulase-producing fungi and bacteria have been identified [10,21]. Most commercial cellulases have
been produced by Aspergillus and Trichderma species with solid-state cultures [9]. Bacterial cellulase systems of Clostridium, Cellomonas, Bacillus, Thermonospora, Ruminococcus, Bacteriodes, Erwinia, and Acetivibrio species have been reported [14,22,28]. Enzymes and microbial me- tabolites produced by marine microorganisms can provide numerous advantages over traditional enzymes due to the severe and wide range of environments [11,16]. Activities of enzymes produced by psychrophilic microorganisms are reported to be much higher at low temperature than those of their mesophilic and thermophilic counterparts [17].
Cold-adapted peptidases were isolated from marine bacteria and a halo-tolerant marine bacterium, which produced ĸ-car- rageenase, was studied [13].
In this study, a microorganism which utilized rice bran and produced carboxymethylcellulase (CMCase) was iso- lated from seawater and identified as Bacillus atrophaeus. B.
atrophaeus is a commonly used model for the study of micro-
bial development and cell differentiation in cell development
[34]. However, the production of celluases by this strain had
not been reported yet. Industrial scaled optimization for the production of CMCase by this strain was established using response surface method [15].
Materials and Methods
Isolation of a marine microorganism producing carboxymethylcellulase
To isolate microorganism producing carbox- ymethylcellulase (CMCase), seawater from the Kyungsang Province of Korea was suspended with 0.85% (w/v) NaCl.
The suspension was then cultivated on marine agar plates at 30℃ for 3 day under aerobic conditions. Isolated cultures were prepared by transferring cells from the agar plate to 200 ml of medium in 500 ml Erlenmeyer flasks. The medium used for the production of CMCase consisted of 20.0 g/l carboxymethylcellulose (CMC), 2.5 g/l yeast extract, 5.0 g/l K
2HPO
4, 1.0 g/l NaCl, 0.2 g/l MgSO
4·7H
2O, and 0.6 g/l (NH
4)
2SO
4. The resulting cultures were incubated at 30℃ for 3 day under aerobic conditions. Basis on the productivity of CMCase, one microorganism was selected for the pro- duction of CMCase and identified by sequencing of 16S rDNA.
Analysis of 16S rDNA sequences of the isolated microorganism
For the nucleotide sequence analysis of 16S rDNA, bacte- rial genomic DNA was extracted and purified using a Wizard Genomic DNA Prep. Kit (Promega Co., Madison, USA). Two primers annealing at the 5’ and 3’ end of the 16S rDNA were 5’-AGAGTTTGATCCTGGCTCAG-3’
(positions 8 to 27 [E. coli 16S rDNA numbering]) and 5’-AAGGAGGTGATCCAGCCGCA-3’ (positions 1541 to 1522 [E. coli 16S rDNA numbering]), respectively [37]. PCR amplification was performed as described in the previous report [14]. The PCR reaction was run for 35 cycles in a DNA thermal cycler (Model No. 9700, Perkin-Elmer Co. Wellesley, USA). The following thermal profile was used for the PCR:
denaturation at 94
oC for 1 min, primer annealing at 60
oC for 1 min, and extension at 72
oC for 2 min. The final cycle included extension at 72
oC for 10 min to ensure full ex- tension of the products. The amplified PCR products were then analyzed in a 1.0% (w/v) agarose gel, excised from the gel, and purified. The purified products were cloned into a pGEM-T Easy vector (Promega Co., Madison, USA) and subsequently sequenced using an ALF Red automated DNA
sequencer (Pharmacia, Sweden). The 16S rDNA sequence of the isolate was aligned with those in the GenBank database.
Multiple alignments of sequences and calculations of levels of sequence similarity were performed by using CLUSTAL W [33]. Neighbor-joining phylogenetic analysis was carried out with MEGA program [20].
Production of CMCase by the isolated microorganism
Starter cultures were prepared by transferring cells from agar slants to 50 ml of the same medium except for agar in 250 ml Erlenmeyer flasks. The resulting cultures were in- cubated at 30℃ for 2 day under aerobic conditions. Each starter culture was used as an inoculum for 200 ml of me- dium in 500 ml Erlenmeyer flasks. The main culture was carried out in a medium containing 20 g/l glucose, 2.5 g/l yeast extract, 5.0 g/l K
2HPO
4, 1.0 g/l NaCl, 0.2 g/l MgSO
4·7H
2O, and 0.6 g/l (NH
4)
2SO
4at 30℃ for 3 day under aerobic conditions. Samples were periodically withdrawn from the cultures to examine cell growth and the production of CMCase by the isolated microorganism [22].
Batch fermentations for the production of CMCase by an isolated microorganism were performed in 7 and 100 l bio- reactors (Ko-Biotech Co., Korea). Working volumes of the 7 and 100 l bioreactors were 5 and 70 l, respectively, and inoculum size of batch fermentations for the production of CMCase was 5% (v/v). Agitation was provided by three six-flat-blade impellers in a 7 l fermentor.
Experimental design and optimization for production of CMCase
The rice bran (X
1), ammonium chloride (X
2), and initial pH of the medium (X
3) were chosen as the independent vari- ables and cell growth (Y
1) and CMCase (Y
2) were used as a dependent output variable. The interrelationships of the variables were determined by fitting the second degree poly- nomial equation to data obtained from 20 experiments using mean values of the triplicates of each experiment conducted trice at different occasions. The maximum values of cell growth and production of CMCase were taken as the re- sponses of the design experiment. Statistical analysis of the model was performed to evaluate the analysis of variance (ANOVA). A multiple regression analysis of the data was carried out with the statistical software, Design-Expert (Version 7.1.6, Stat-Ease Inc., Minneapolis, USA).
The agitation speed (X
1) and aeration rate (X
2) were also
chosen as the independent variables and cell growth (Y
1’)
and CMCase (Y
2’) were used as a dependent output variable.
The interrelationships of the variables were also determined by fitting the second degree polynomial equation to data obtained from 13 experiments using mean values of the triplicates. Statistical analysis of the model was performed to evaluate the analysis of variance (ANOVA).
Analytical methods
Dry cells weight (DCW) was measured as described in the previous report [10]. Activities of the CMCase produced by the isolated microorganism were determined based on the release of reducing sugar from CMC using the 3,5-dini- trosalicylic acid (DNS) method, as described in the previous report [14]. Glucose (Sigma-Aldrich, UK) was used to pre- pare a calibration curve. One unit of each CMCase was de- fined as the amount of enzyme that released 1 µmol of re- ducing sugar equivalent to glucose per minute under the assay condition.
Results and Discussion Identification of the isolated microorganism
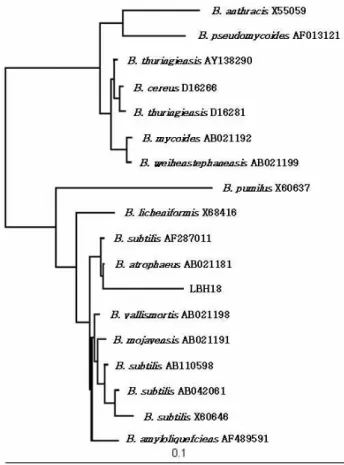
A microorganism hydrolyzing carboxymethylcellulose (CMC) was isolated from seawater of the Kyungsang Province in Korea and designated strain LBH-18. The phylo- genetic analysis of strain LBH-18 using the nucleotide se- quence data of its 16S rDNA showed that this strain had the highest homology (99.8%) with Bacillus atrophaeus AB021181. Based on the evolution distance and the phyloge- netic tree resulting from 16S rDNA sequencing and the neighbour-joining method [30], a microorganism isolated from seawater was identified as Bacillus atrophaeus and des- ignated B. atrophaeus LBH-18, as shown in Fig. 1.
Effects of carbon and nitrogen sources on production of CMCase
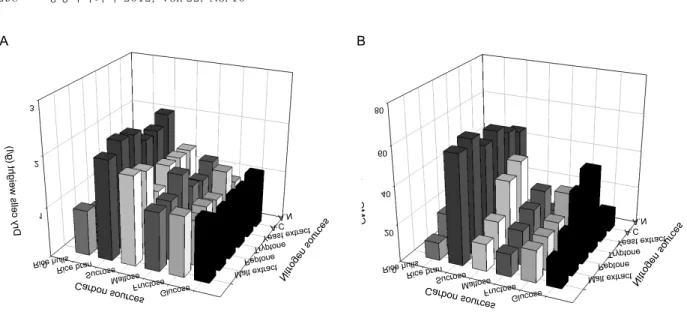
Effects of carbon and nitrogen sources on cell growth and the production of CMCase by B. atrophaeous LBH-18 were investigated. Carbon sources tested for production of CMCase were 20.0 g/l glucose, fructose, maltose, sucrose, rice bran, and rice hulls. Nitrogen sources tested were 2.5 g/l malt extract, peptone, tryptone, yeast extract, ammonium sulfate, and ammonium nitrate. Initial pH of the medium before sterilization was adjusted to 6.8. Rice bran and peptone were found to be the best combination of carbon and nitrogen sources for cell growth as well as
Fig. 1. Neighbour-joining tree based on 16S rDNA sequences of
Baillus atrophaeus
. Numbers at the nodes indicate the levels of bootstrap support based on a neighbour-join- ing analysis of 1,000 resampled dataset. Scale bar in- dicates 0.1 nucleotide substitution per nucleotide position.the production of the CMCase by B. atrophaeous LBH-18, as shown in Fig. 2.
The best combination of carbon and nitrogen sources for the production of CMCase produced by B. amylolique- faciens DL-3 was rice hulls and peptone, whereas that by B. sutilis subsp. sutilis A-53 was rice bran and yeast ex- tract [10,22]. Rice bran was reported to be the best carbon source for the production of CMCase by Bacillus sp. CH43 and HR68 [27]. The composition of the rice bran used in this study was 48.0% carbohydrate, 6.9% fiber, 14.9%
crude lipid, 13.1% crude protein, 7.6% ash, and 9.5% wa-
ter [22]. The best combination of carbon and nitrogen
sources for the production of CMCase produced by B. su-
tilis subsp. sutilis A-53, which was isolated form seawater,
were rice bran and yeast extract [22]. All strains inves-
tigated to date for the production of cellulases are in-
ducible by cellulose, lactose or sophorose, and repressible
by glucose, which are reasons why the best carbon sour-
A
0 1 2 3
Malt extract PeptonTryptoYeast eA.Cneextract
A.N
Glucose Fructose Maltose Sucrose Rice bran Rice hulls
Dry cells weight (g/l)
Nitrogen sources Carbon sources
B
0 20 40 60 80
Malt extract Peptone
Tryptone Yeast extracA.C t
A.N
Glucose Fructose Maltose Sucrose Rice bran Rice hulls
CMCase (U/ml)
Nitrogen sources Carbon sources
Fig. 2. Effect of carbon and nitrogen sources on cell growth (A) and production of CMCase (B) by
B. atrophaeus
LBH-18.Rice bran (g/l)
0 25 50 75 100
D C W ( g /l)
0 1 2 3 4 5 6
Peptone (g/l)
2.5 5.0 7.5 10.0 12.5Initial pH
6.0 6.5 7.0 7.5 8.0
C M C a s e ( U /m l)
0 20 40 60 80 100
Fig. 3. Effect of rice bran, peptone, and initial pH on cell growth and production of CMCase by
B. atrophaeus
LBH-18 (●, DCW and ○, CMCase).ces for the production of cellulases by bacterial and fun- gal microorganisms are rice hulls, rice bran or wheat bran [6,12]. Induction, synthesis, and secretion of the β -glucanase appear to be closely associated [29].
Effects of rice bran, peptone, and initial pH on production of CMCase
Effects of rice bran and peptone as carbon and nitrogen sources, and initial pH of the medium on cell growth and the production of CMCase by B. atropphaeus LBH-18 were investigated using one-factor-at-a-time method. Composition of basic medium and initial pH were 50.0 g/l rice bran, 7.5 g/l peptone, and pH 7.0. The optimal concentration of rice
bran and peptone, and initial pH of the medium for cell growth were found to be 75.0 g/l, 10.0 g/l, and 6.0, whereas those for production of CMCase were 50.0 g/l, 5.0 g/l, and 7.0, as shown in Fig. 3. The optimal concentration of rice ran and peptone, and initial pH of the medium for cell growth were different from those for production of CMCase.
Initial pH of the medium, especially during a batch culture
without pH control, is one of the most important factors,
which affects cell growth as well as its production of metabo-
lites [1]. The optimal initial pHs of the medium for the pro-
duction of CMCase by B. amyloliquefaciens DL-3 and B. sub-
tilis subsp. subtilis were 6.8, whereas those for their cell
growth were 7.3 [10,22].
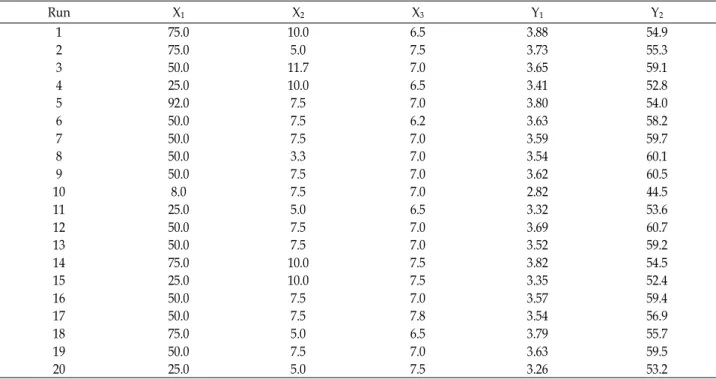
Table 1. Central composite design and determined response values (Y1and Y2 were DCW and CMCase, respectively)
Run X1 X2 X3 Y1 Y2
1 75.0 10.0 6.5 3.88 54.9
2 75.0 5.0 7.5 3.73 55.3
3 50.0 11.7 7.0 3.65 59.1
4 25.0 10.0 6.5 3.41 52.8
5 92.0 7.5 7.0 3.80 54.0
6 50.0 7.5 6.2 3.63 58.2
7 50.0 7.5 7.0 3.59 59.7
8 50.0 3.3 7.0 3.54 60.1
9 50.0 7.5 7.0 3.62 60.5
10 8.0 7.5 7.0 2.82 44.5
11 25.0 5.0 6.5 3.32 53.6
12 50.0 7.5 7.0 3.69 60.7
13 50.0 7.5 7.0 3.52 59.2
14 75.0 10.0 7.5 3.82 54.5
15 25.0 10.0 7.5 3.35 52.4
16 50.0 7.5 7.0 3.57 59.4
17 50.0 7.5 7.8 3.54 56.9
18 75.0 5.0 6.5 3.79 55.7
19 50.0 7.5 7.0 3.63 59.5
20 25.0 5.0 7.5 3.26 53.2
Optimization of rice bran, peptone, and initial pH using response surface method
The simultaneous effects of rice bran, peptone, and initial pH of the medium on cell growth and the production of CMCase by B. atropphaeus LBH-18 were investigated using response surface method. The minimum and maximum range of variables, rice bran, peptone, and initial pH of me- dium, with respect to their coded values were 25.0 and 75.0 g/l, 5.0 and 10.0 g/l, and 6.5 and 7.5, respectively. Cell growth, measured as dry cells weight (DCW) and pro- duction of CMCase from 20 different conditions ranged from 2.82 to 3.88 g/l and from 44.5 to 60.7 U/ml, as shown in Table 1. The model F-value of 24.58 from the analysis of variance (ANOVA) of cell growth implied that this model was significant, as shown in Table 2. There was only a 0.01%
chance that a “Model F-value” could occur to die to noise.
The ANOVA indicated that this model and the model term of X
1(“probe > F” less 0.0001) were highly significant [23].
The ANOVA also indicated that the model term of X
12(“probe > F” less 0.0500) were significant for cell growth of B. atropphaeus LBH-18. The regression equation obtained from ANOVA indicated that the multiple correlation co- efficient of R
2was 0.9568. The model can explain 95.68% var- iation in the response. The value of the adjusted determi- nation coefficient (Adj. R
2=0.9178) was very high to advocate for a high significance of this model [24]. The predicted de-
termination of coefficient of 0.7649 was in reasonable agree- ment with the Adj. R
2of 0.9178. From the statistical results obtained, it was shown that this model was adequate to pre- dict the cell growth of B. atropphaeus LBH-18 within the range of variables studied. Multiple regression analysis of the experimental data gave the following second-order poly- nomial equation in terms of coded factors (1). The optimal conditions of rice bran, peptone, and initial pH of the me- dium for cell growth extracted by Design Expert Software were 68.1 g/l, 9.1 g/l, and 7.0, respectively. The maximum cell growth of 3.77 g/l was predicted by this model.
Y
1=3.60+0.26X
1+0.04X
2-0.03X
3-0.09X
12+0.01X
22+0.01X
32(1)
The model F-value of 18.70 from the ANOVA of pro-
duction of CMCase implied that this model was also
significant. The ANOVA indicated that this model and mod-
el term of X
12were highly significant and those of X
1and
X
32were significant. The regression equation obtained from
ANOVA indicated that the multiple correlation coefficient
of R
2was 0.9439. The value of the adjusted determination
coefficient (Adj. R
2=0.8934) was high to advocate for a high
significance of this model. The predicted determination of
coefficient of 0.6141 was also in reasonable agreement with
the Adj. R
2of 0.8934. From the statistical results obtained,
it was shown that this model was adequate to predict the
production of CMCase by B. atropphaeus LBH-18 within the
Table 2. Parameter estimates and analysis of variance (ANOVA) of the design for cell growth and production of CMCase by
B.
atrophaeus
LBH-18Source of
variation Degree of
freedom Sum of
squares Mean
squares F-value Probe>F
Cell growth
Model 9 1.060 0.120 24.58 <0.0001
X
11 0.910 0.910 189.37 <0.0001
X
21 0.022 0.022 4.52 0.0595
X
31 0.011 0.011 2.33 0.1579
X
121 0.110 0.110 22.59 0.0008
X
221 0.003 0.003 0.58 0.4646
X
321 0.002 0.002 0.32 0.5833
Error 5 0.017 0.003 - -
Total 19 1.110 - - -
CMCase
Model 9 281.620 32.290 18.70 <0.0001
X
11 43.510 43.510 26.00 0.0005
X
21 1.750 1.750 1.04 0.3312
X
31 1.050 1.050 0.63 0.4467
X
121 228.830 228.830 136.76 <0.0001
X
221 1.530 1.530 0.91 0.3619
X
321 15.900 15.900 9.50 0.0116
Error 5 1.910 0.380 - -
Total 19 298.360 - - -
range of variables studied. Multiple regression analysis of the experimental data gave the following second-order poly- nomial equation in terms of coded factors (2). The optimal conditions of rice bran, peptone, and initial pH of the me- dium for production of CMCase were 55.2 g/l, 6.6 g/l, and 7.1, respectively. The maximum production of CMCase of 60.0 U/ml was predicted by this model.
Y
2=59.87+1.78X
1-0.36X
2-0.28X
3-3.98X
12-0.33X
22-1.05X
32(2) Effect of temperature on production of CMCase
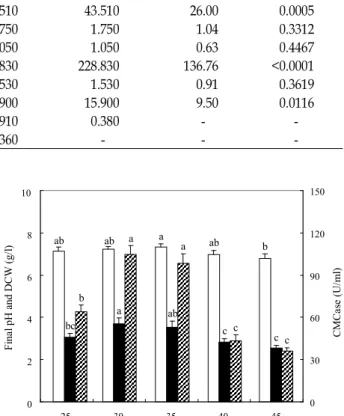
The effect of temperature on cell growth and the pro- duction of CMCase by B. atropphaeus LBH-18 was examined.
Temperatures for cell growth and production of CMC ranged from 25 to 45℃. The optimal temperature for cell growth as well as the production of CMCase of B. atrophaeus LBH-18 was found to be 30℃, as shown in Fig. 4. Maximal cell growth and production of CMCase at 30℃ were 3.71 g/l and 104.6 U/ml. Significance of each value for cell growth and production of CMCase was analyzed by DPS software version 3.01 (DPS Co., Middlesex, UK). The optimal temperatures for cell growth of B. amyloliquefaciens DL-3 and B. subtilis subsp. subtilis were 32 and 35℃, respectively, whereas those for production of CMCases were 37 and 30℃, respectively [10,22]. The optimal temperatures for pro- ductions of cellulases by T. reesei QM9414 and T. reesei
0 2 4 6 8 10
25 30 35 40 45
Temperature (℃)
Final pH and DCW (g/l)
0 30 60 90 120 150
CMCase(U/ml)
ab
bc b
ab
a
a a
ab
a ab
c c b
c c
Fig. 4. Effect of temperature on cell growth and production of CMCase by
B. atrophaeus
LBH-18 (□, final pH; █, DCW;and ▨, CMCase).
MCG77 in solid-state fermentation using rice bran as a sub- strate were 30 and 25℃, respectively [21]. Unlike other strains producing cellulases, the optimal temperature for cell growth of B. atrophaeus LBH-18 was the same as that for production of CMCase.
Effects of agitation speed and aeration rate on production of CMCase
Effects of agitation speed and aeration rate on cell growth
Table 3. Central composite design and determined response values
Run X1 X2 Y1 Y2
1 400 0.5 2.84 103.7
2 300 1.7 2.39 92.4
3 300 1.0 2.99 102.4
4 200 0.5 2.67 97.1
5 300 1.0 3.04 104.2
6 200 1.5 2.37 87.0
7 300 0.3 2.61 103.1
8 441 1.0 2.67 97.8
9 300 1.0 3.10 106.6
10 159 1.0 2.50 88.1
11 300 1.0 2.91 100.5
12 300 1.0 2.93 99.8
13 400 1.5 2.54 93.5
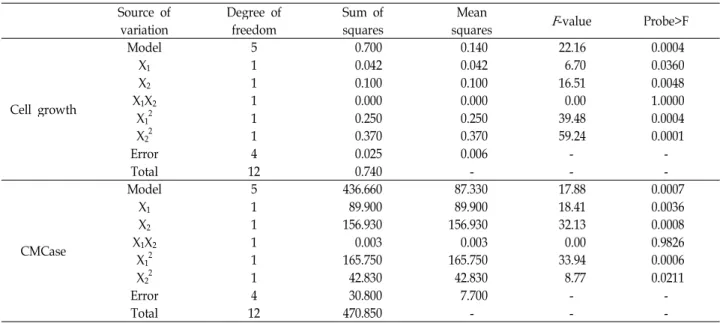
Table 4. Parameter estimates and analysis of variance (ANOVA) of the design for cell growth and production of CMCase by
B. atrophaeus
LBH-18 in a 7 l bioreactorSource of
variation Degree of
freedom Sum of
squares Mean
squares
F
-value Probe>FCell growth
Model 5 0.700 0.140 22.16 0.0004
X1 1 0.042 0.042 6.70 0.0360
X2 1 0.100 0.100 16.51 0.0048
X1X2 1 0.000 0.000 0.00 1.0000
X12 1 0.250 0.250 39.48 0.0004
X22 1 0.370 0.370 59.24 0.0001
Error 4 0.025 0.006 - -
Total 12 0.740 - - -
CMCase
Model 5 436.660 87.330 17.88 0.0007
X1 1 89.900 89.900 18.41 0.0036
X2 1 156.930 156.930 32.13 0.0008
X1X2 1 0.003 0.003 0.00 0.9826
X12 1 165.750 165.750 33.94 0.0006
X22 1 42.830 42.830 8.77 0.0211
Error 4 30.800 7.700 - -
Total 12 470.850 - - -
and the production of CMCase by B. atrophaeus LBH-18 were investigated in a 7 l bioreactor. The minimum and maximum ranges of agitation speed and aeration rate with respect to coded values were 200 and 400 rpm and 0.5 and 1.5 vvm.
Cell growth and production of CMCase from 13 different conditions ranged from 2.37 to 3.10 g/l and from 87.0 to 106.6 U/ml, as shown in Table 3. The model F-value of 22.16 from the ANOVA of cell growth implied that this model was significant, as shown in Table 4. The ANOVA indicated that the model and model terms of X
1, X
2, X
12and X
22were significant for cell growth of B. atrophaeus LBH-18. The re- gression equation obtained from ANOVA indicated that the multiple correlation coefficient of R
2was 0.9406. The value of the adjusted determination coefficient (Adj. R
2=0.8981)
was high to advocate for a high significance of this model.
The predicted determination of coefficient of 0.7612 was in reasonable agreement with the Adj. R
2of 0.8981. From the statistical results obtained, it was shown that the above mod- els were adequate to predict the cell growth of B. atrophaeus LBH-18 within the range of variables studied. Multiple re- gression analysis of the experimental data gave the follow- ing second-order polynomial equation in terms of coded fac- tors (3). The optimal conditions of agitation speed and aera- tion rate for cell growth were 324 rpm and 0.9 vvm. The maximum cell growth of 3.01 g/l was predicted by this model.
Y
1’=2.99+0.07X
1-0.11X
2-0.19X
12-0.23X
22(3)
A
3.02
2.86
2.70
2.53
2.37
1.50 1.25
1.00 0.75
0.50 200 250
300 350
400
B: Aeration (vvm) A: Agitation (rpm)
DCW (g/l)
B
106.0
101.3
96.5
91.8
87.0
1.50 1.25
1.00 0.75
0.50 200 250
300 350
400
B: Aeration (vvm) A: Agitation (rpm)
CMCase(U/ml)
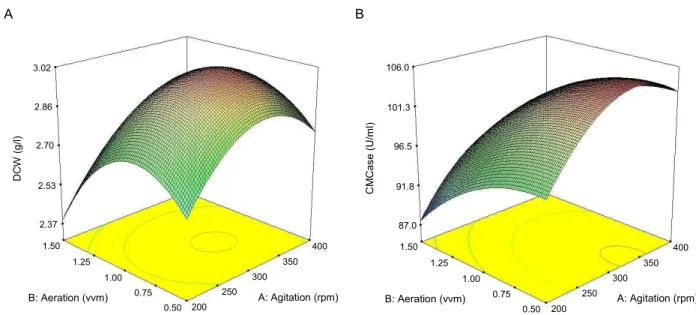
Fig. 5. 3D response surface displaying relative effect of two variables on cell growth and the production of CMCase by
B. atrophaeus
LBH-18 in a 7 l bioreactor; interaction between agitation speed and aeration rate for cell growth (A) and the production of CMCase (B).The model F-value of 17.88 from the ANOVA of pro- duction of CMCase implied that this model was also significant. The ANOVA indicated that this model and the model term of X1, X
2, X
12, and X
22were significant for the production B. atrophaeus LBH-18. The regression equation obtained from ANOVA indicated that the multiple correla- tion coefficient of R
2was 0.9274. The value of the adjusted determination coefficient (Adj. R
2=0.8755) was very high to advocate for a high significance of this model. The predicted determination of coefficient of 0.8466 was also in reasonable agreement with the Adj. R
2of 0.8755. From the statistical results obtained, it was shown that the above models were adequate to predict the production of CMCase by B. atro- phaeus LBH-18 within the range of variables studied.
Multiple regression analysis of the experimental data gave the following second-order polynomial equation in terms of coded factors (4). The optimal conditions of agitation speed and aeration rate for production of CMCase were 343 rpm and 0.60 vvm. The maximum production of CMCase of 105.2 U/ml was predicted by this model.
Y
2’=102.70+3.35X
1-4.43X
2-0.03X
1X
2-4.88X
12-2.482X
22(4) The three-dimensional response surface plots were gen- erated to investigate the interaction between agitation speed and aeration rate to visualize their combined effect on the response of cell growth and the production of CMCase by B. atrophaeus LBH-18, as shown in Fig. 5. This kind of graph-
ical visualization allows the relationships between the ex- perimental levels of each factor and the response to be inves- tigated, and the type of interactions between test variables to be determined, which is necessary to establish the optimal conditions of agitation speed and aeration rate [26]. In con- trast to the circular shape in the 3D plot, the elliptical nature of the curve in the 3D plot indicated significant mutual inter- actions between variables. Interactive effect of agitation speed and aeration rate on the production of CMCase by B. atrophaeus LBH-18 was relatively more significant than that on production of cell growth.
Cell growth and production of bacterial CMCases by B.
amyloliquefaciens and B. subtilis subsp. subtilis as well as fun-
gal CMCase by T. reesei were affected by the dissolved oxy-
gen in the medium [10,22]. The optimal agitation speeds and
aeration rates for the production of CMCase by B. amylolique-
faciens and B. subtilis subsp. subtilis were 300 rpm and 1.0
vvm, which were lower than those for their cell growth
[10,22]. Higher agitation speed and aeration rate, which re-
sulted in increase of the concentration of dissolved oxygen
in the medium, enhanced cell growth of B. atrophaeus
LBH-18. However, higher than optimal concentration of dis-
solved oxygen for the production of CMCase by B. atrophaeus
LBH-18 seemed to lead the biosynthetic pathway to cell
growth, but not to production of CMCase. It seems that a
higher than optimal concentration of dissolved oxygen for
the production of CMCase by B. atrophaeus LBH-18 leads the
A
Time (h)
0 12 24 36 48 60 72
pH
6.0 6.5 7.0 7.5
B
Time (h)
0 24 48 72
DO (%)
0 20 40 60 80 100
C
Time (h)
0 24 48 72
DCW (g/l)
0 1 2 3 4 5
D
Time (h)
0 12 24 36 48 60 72
CMCase (U/ml)
0 30 60 90 120 150
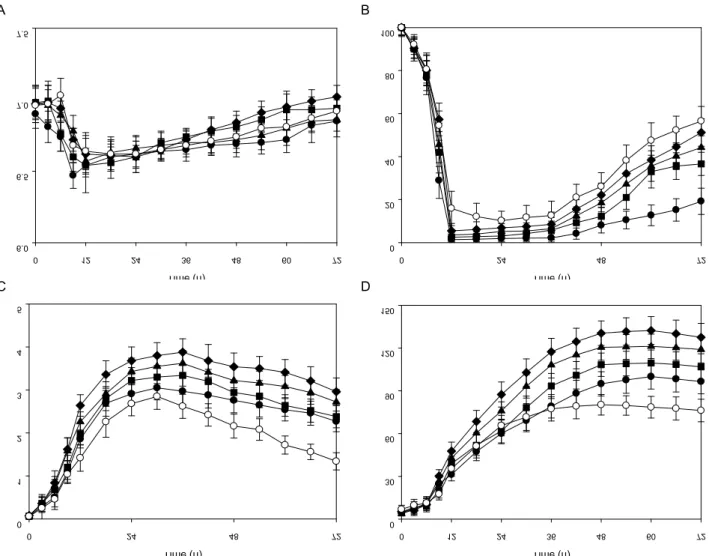
Fig. 6. Effect of the inner pressure in a 100 l bioreactor on pH of medium (A), dissolved oxygen (B), cell growth (C), and production of CMCase (D) by
B. atrophaeus
LBH-18 in a 100 l bioreactor (●, 0.00 MPa; ■, 0.02 MPa; ▲, 0.04 MPa; ◆, 0.06 MPa;and ○, 0.08 MPa).
biosynthetic pathway to cell growth, but not to production of CMCase.
Effect of inner pressure on production of CMCase in a 100 l bioreactor
The effect of inner pressure on cell growth and the pro- duction of CMCase by B. atrophaeous LBH-18 was inves- tigated in a 100 l bioreactor. The inner pressure ranged from 0.00 to 0.08 MPa. The agitation speed and aeration rate of a 100 l bioreactor were 250 rpm and 0.6 vvm. The radius of the impeller in a 100 l bioreactor was bigger than that in a 7 l bioreactor. The angular velocity of a 100 l bioreactor at 250 rpm is almost the same as that of a 7 l bioreactor at 343 rpm. The pH of the medium rapidly decreased and reached about 6.5 after 12 hr of cultivation, then gradually increased, as shown in Fig. 6. The concentration of the dis-
solved oxygen in the medium dramatically decreased and then reached 0% at the middle of the log phase, and the production of CMCase by B. atrophaeus LBH-18 started. The optimal inner pressure of a 100 l bioreactor for cell growth of B. atrophaeus LBH-18 was 0.06MPa, which was the same as that for the production of CMCase.
Productions of CMCase by B. atrophaeus LBH-18 with an
inner pressure of 0.00, 0.02, 0.04, 0.06, and 0.08 MPa after
72 hr of cultivation were 96.5, 106.8, 119.0, 127.5, and 76.2
U/ml, respectively. The production of CMCase by B. atro-
phaeus LBH-18 with an inner pressure of 0.06 MPa was 1.32
times higher than that without inner pressure. Increased in-
ner pressure in a 100 l bioreactor resulted in a higher concen-
tration of dissolved oxygen in the medium, which might be
enhance cell growth as well as the production of CMCase
by B. atrophaeus LBH-18 [8]. Variation in agitation speed and
Table 5. Optimal conditions for cell growth and production of CMCase by
B. asrophaeus
LBH-18Scale Conditions
Optimal conditions
One-factor-at-a-time method Response surface method
DCW CMCase DCW CMCase
Flask scale
Rice bran (g/l) 75.0 50.0 68.1 55.2
Peptone (g/l) 10.0 5.0 9.1 6.6
Initial pH 6.0 7.0 7.0 7.1
Maximal production 4.52 g/l 70.1 U/ml 3.77 g/l 60.0 U/ml
Bioreactor scale
Agitation speed (rpm) - - 324 343
Aeration rate (vvm) - - 0.9 0.6
Maximal production - - 3.01 g/l 105.2 U/ml
Pilot scale Inner pressure (MPa) 0.06 0.06 - -
Maximal production 2.96 g/l 127.5 U m/l - -
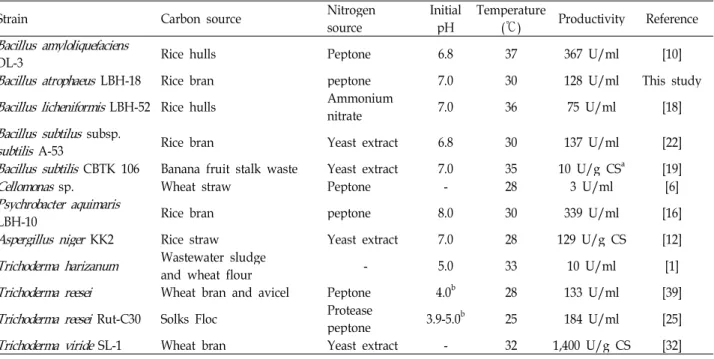
Table 6. Comparison of optimal conditions for the production of various CMCases by bacterial and fungal microorganisms
Strain Carbon source Nitrogen
source Initial
pH Temperature
(℃) Productivity Reference
Bacillus amyloliquefaciens
DL-3 Rice hulls Peptone 6.8 37 367 U/ml [10]
Bacillus atrophaeus
LBH-18 Rice bran peptone 7.0 30 128 U/ml This studyBacillus licheniformis
LBH-52 Rice hulls Ammoniumnitrate 7.0 36 75 U/ml [18]
Bacillus subtilus
subsp.subtilis
A-53 Rice bran Yeast extract 6.8 30 137 U/ml [22]Bacillus subtilis
CBTK 106 Banana fruit stalk waste Yeast extract 7.0 35 10 U/g CSa [19]Cellomonas
sp. Wheat straw Peptone - 28 3 U/ml [6]Psychrobacter aquimaris
LBH-10 Rice bran peptone 8.0 30 339 U/ml [16]
Aspergillus niger
KK2 Rice straw Yeast extract 7.0 28 129 U/g CS [12]Trichoderma harizanum
Wastewater sludgeand wheat flour - 5.0 33 10 U/ml [1]
Trichoderma reesei
Wheat bran and avicel Peptone 4.0b 28 133 U/ml [39]Trichoderma reesei
Rut-C30 Solks Floc Proteasepeptone 3.9-5.0b 25 184 U/ml [25]
Trichoderma viride
SL-1 Wheat bran Yeast extract - 32 1,400 U/g CS [32]acarbon source
bmaintenance pH
aeration rate results in a change in the concentration of dis- solved oxygen in the medium, which in turn affects cell growth and the production of microbial metabolites such as lipase and β-mannanase [5,7]. The optimal aeration rate for cell growth was higher than that for the production of CMCase by B. atrophaeus LBH-18. The optimal inner pressure for cell growth was the same as that for the production of CMCase. Higher inner pressure can afford for higher con- centration of dissolved oxygen to enhance cell growth unless it damage to cells. B. atrophaeus LBH-18 seemed to be strong enough to endure higher inner pressure, which resulted in enhanced production of CMCase.
Various carbon sources have been used for the production
of cellulases, but their prices are too expensive to apply com-
mercially [4,25]. Rice bran from the rice processing industry
is produced in large amounts in Korea, as well as other rice
producing countries. In this study, rice bran was developed
to be a carbon source and the optimal conditions for the
production of CMCase by B. atrophaeus LBH-18 was estab-
lished using an orthogonal array method, as shown in Table
5. The optimal conditions for production of CMCase by bac-
terial and fungal species were compared, as shown in Table
6. Production of CMCase by fungal species with solid cul-
tures normally takes 7 to 10 days. In this study, it took 3
days to produce CMCase by B. atrophaeus LBH-18. Reduced time for production of CMCase using a bacterial strain with submerged fermentations also results in increase in pro- ductivity of CMCase and decrease in its production cost.
Acknowledgement
This paper was financially supported by Dong-A University Research Fund.
References
1. Alam, M. Z., Muyibi, S. A. and Wahid, R. 2008. Statistical optimization of process conditions for cellulase production by liquid state bioconversion of domestic wastewater sludge.
Bioresour
.Technol
. 99, 4709-4716.2. Blumer-Schuette, S. E., Kataeva, I., Westpheling, J., Adams, M. W. W. and Kelly, R. M. 2008. Extremely thermophilic microorganisms for biomass conversion: status and prospects.
Curr. Opin. Biotechnol
. 19, 210-217.3. Chen, M., Zhao, J. and Xia, L. 2008. Enzymatic hydrolysis of maize straw polysaccharides for the production of re- ducing sugars.
Carbohydr. Polym
. 71, 411-415.4. Domingues, F. C., Queiroz, J. A., Cabral, J. M. S. and Fonseca, L. P. 2000. The influence of culture conditions on mycelial structure and cellulase production by
Trichoderma reesei
Rut C-30.Enzyme Microb. Technol
. 26, 394-401.5. Elibol, M. and Ozer, D. 2000. Influence of oxygen transfer on lipase production by
Rhizopus arrhizus
.Process Biochem
. 36, 325-329.6. Emtiazi, G. and Nahvi, I. 2000. Multi-enzyme production by
Cellulomonas
sp. grown on wheat straw.Biomass Bioenergy
19, 31-37.7. Feng, Y., He, Z., Ong, S. L., Hu, J., Zhang, Z. and Ng, W.
J. 2003. Optimization of agitation, aeration, and temperature conditions for maximum β-mannanase production.
Enzyme Microb. Technol
. 32, 282-289.8. Gao, W., Kim, Y. J., Chung, C. H., Li, J. and Lee, J. W. 2010.
Pilot-scale optimization of parameters related to dissolved oxygen for mass production of pullulan by
Aureobasidium pullulans
HP-2001.J. Life Sci
. 20, 1433-1442.9. Howard, R. L., Abotsi, E., Jansen von Rensburg, E. L. and Howard, S. 2003. Lignocellulose biotechnology: issues of bi- oconversion and enzyme production.
Afr. J. Biotechnol.
2, 602-619.10. Jo, K. I., Lee, Y. J., Kim, B. K., Lee, B. H., Chung, C. H., Nam, S. W., Kim, S. K. and Lee, J. W. 2008. Pilot-scale pro- duction of carboxymethylcellulase from rice hull by
Bacillus amyloliquefaciens
DL-3.Biotechnol. Bioprocess Eng
. 13, 182-188.11. Jung, I. S., Kim, Y. J., Song, H. J., Gal, S. W. and Choi, Y.
J. 2008. Purification and properties of a novel extracellular agarase from marine bacterium,
Sphingomonas paucimobilis
AS-1.J. Life Sci
. 18, 103-108.12. Kang, S., Park, W, Y. S., Lee, J. S., Hong, S. I. and Kim, S. W. 2004. Production of cellulase and hemicellulases by
Aspergillus niger
KK2 from lignocellulosic biomass.Bioresour.
Technol
. 91, 153-156.13. Khambhaty, Y., Mody, K. and Jha, B. 2007. Purification and characterization of ĸ-carrageenase from a novel γ -proteobacterium,
Pseudomonas elongate
(MTCC 5261) syn.Microbulbifer elongates
comb. Nov.Biotechnol. Bioproccess Eng
. 12, 668-675.14. Kim, B. K., Lee, B. H., Y. J. Lee, Y. J., Jin, I. H., Chung, C. H. and Lee, J. W. 2009. Purification and characterization of carboxymethylcellulase isolated from a marine bacterium,
Bacillus subtilis
subsp.subtilis
A-53.Enzyme Microb. Technol
. 44, 411-416.15. Kim, H. J., Lee, Y. J., Gao, W., Chung, C. H. and Lee, J.
W. 2012. Optimization of salts in medium for production of carboxymethylcellulase by a psychrophilic marine bacte- rium,
Psychrobacter aquimaris
LBH-10 using two statistical method.Kor. J. Chem. Eng
. 12, 384-391.16. Kim, H. J., Gao, W., Lee, Y. J., Chung, C. H. and Lee, J.
W. 2010. Characterization of acidic carboxymethylcellulase produced by a marine microorganism,
Psychrobacter aqui- maris
LBH-10.J. Life Sci
. 20, 487-495.17. Kim, H. J., Lee, Y. J., Gao, W., Chung, C. H., Son, C. W.
and Lee, J. W. 2011. Statistical optimization for fermentation conditions and comparison of their influences on pro- duction of cellulases by a psychrophilic marine bacterium,
Psychrobacter aquimaris
LBH-10 using an orthogonal array method.Biotechnol. Bioprocess. Eng
. 16, 542-548.18. Kim, H. J., Gao, W., Chung, C. H. and Lee, J. W. 2011.
Statistical optimization for production of carbox- ymethylcellulase from rice hulls by a newly isolated marine microorganism
Bacillus licheniformis
LBH-52 using response surface method.J. Life Sci
. 21, 1083-1093.19. Krishna, C. 1999. Production of bacterial cellulases by a solid state bioprocessing of banana wastes.
Bioresour. Technol.
69, 231-239.20. Kumar, S., Tamura, K. and Nei, N. 1993. MEGA: Molecular evolutionary genetic analysis. Version 1.01, The Pennsylvania State University, University Park, USA.
21. Latifian, M., Hamidi-Esfahani Z. and Barzegar, M. 2007.
Evaluation of culture conditions for cellulase production by two
Trichoderma reesei
mutants under solid-state fermenta- tion conditions.Bioresour. Technol
. 98, 3634-3637.22. Lee, B. H., Kim, B. K., Lee, Y. J., Chung, C. H. and Lee, J. W. 2010. Industrial scale of optimization for the pro- duction of carboxymethylcellulase from rice bran by a ma- rine bacterium,
Bacillus subtilis
subsp.subtilis
A-53.Enzyme Microbiol. Technol
. 46, 38-42.23. Lee, Y. J., Kim, H. J., Gao, W., Chung, C. H. and Lee, J.
W. 2011. Comparison of statistical methods for optimization of salts in medium for production of carboxymethylcellulase by
Bacillus amyloliquefaciens
DL-3 by a recombinantE. coli
JM109/DL-3.J. Life Sci
. 21, 1205-1213.24. Lee, Y. J., Kim, H. J., Gao, W., Chung, C. H. and Lee, J.
W. 2012. Statistical optimization for production of carbox-
초록:미강을 이용한 해양미생물 Bacillus atrophaeus LBH-18 유래의 carboxymethylcellulase 생산의 최적화
김이준
1,3․고와
1,2․이유정
1,2․이상운
1,2․정정한
3․이진우
2,3*
(1동아대학교 대학원 의생명과학과,2동아대학교 BK21 생물자원 실버바이오사업 인력양성단,3동아대학교 생명공
학과)
Carboxymethylcellulase를 생산하는 미생물을 해수에서 분리하여 16S rDNA의 염기서열을 분석하고 계통 발 생학 방법으로 비교한 결과, Bacillus atrophaeus로 확인되었다. 이 해양 미생물을 B. atrophaeus LBH-18로 명명하였 으며 response surface method (RSM)를 사용하여 carboxymethylcellulase의 생산 조건을 최적화하였다. 이 균주 의 생육에 최적인 미강, 펩톤 및 배지의 초기 pH는 68.1 g/l, 9.1 g/l 및 7.0이었으나, carboxymethylcellulase의 생산에 최적인 조건은 각각 55.2 g/l, 6.6 g/l 및 7.1이었다. 이 균주의 생육과 carboxymethylcellulase의 생산에 최적인 온도는 30℃이었다. 이 균주의 생육에 최적인 생물배양기의 교반속도 및 통기량은 324 rpm 및 0.9 vvm이 었으나, carboxymethylcellulase의 생산에 최적인 조건은 각각 343 rpm 및 0.6 vvm이었다. 파이롯트 규모의 생물 배양기를 사용하여 실험한 결과, 이 균주의 생육과 carboxymethylcellulase의 생산에 최적인 내압은 0.06 MPa이 었다. 최적 조건의 내압으로 배양한 결과, 이 균주의 carboxymethylcellulase의 생산성은 127.5 U/ml이었으며, 이 결과는 내압을 가하지 않고 배양한 경우에 비하여 1.32배 향상된 것이다. 본 연구를 통하여 쌀 도정 공정의 부산 물인 미강을 기질로 개발하였으며 해양 미생물을 사용하여 carboxymethylcellulase의 생산기간을 7~10일에서 3 일로 단축시켰다.
ymethylcellulase of
Bacillus amyloliquefaciens
DL-3 by a re- combinantEscherichia coli
JM109/DL-3 from rice bran using response surface method.Biotechnol. Bioprocess Eng
. 17, 227-235.25. Lee, S. M. and Koo, Y. M. 2001. Pilot-scale production of cellulose using
Trichoderma reesei
Rut C-30 in fed-batch mode.J. Microbiol. Biotechnol
. 11, 229-233.26. Malinowska, E., Krzyczkowski, W., Lapienis, G. and Herold, F. 2009. Improved simultaneous production of mycelial bio- mass and polysaccharides by submerged culture of
Hericium erinaceum
: optimization using a central composite rotatable design (CCRD).J. Ind. Microbiol. Biotechnol.
36, 1513-1527.27. Mawadza, C., Hatti-Kaul, R., Zvauya, R. and Mattiasson, B. 2000. Purification and characterization of cellulases pro- duced by two
Bacillus
strains.J. Biotechnol
. 83, 177-87.28. Roboson, L. M. and Chambliss, G. H. 1989. Celluases of bac- terial origin.
Enzyme Microb. Technol.
11, 626-644.29. Ryu, D. D. Y. and Mandels, M. 1980. Cellulase: biosynthesis and applications.
Enzyme Microb. Technol
. 2, 91-102.30. Saitous, N. and Nei, M. 1987. The neighbor-joining method:
a new method for reconstructing phylogenetic trees.
Mol.
Biol. Evol
. 4, 406-425.31. Sukumaran, R. K., Singhania, R. R., Mathew, G. M. and Pandey, A. 2009. Cellulase production using biomass feed stock and its application in lignocellulose saccharification for bio-ethanol production.
Renew. Energy
34, 421-424.32. Tao, S., Beihui, L., Zuohu, L. and Deming, L. 1999. Effects of air pressure amplitude on cellulase productivity by
Trichoderma viride
SL-1 in periodic pressure solid state fermenter.Process Biochem
. 34, 25-29.33. Thompson, J. D., Higgins, D. G.. and Gibson, T. J. 1994.
CLUSTAL W: Improving the sensitivity of progressive mul- tiple sequence alignment through sequence weighting, posi- tions-specific gap penalties and weight matrix choice.
Nucleic Acids Res
. 22, 4673-4680.34. Tobias, H. J., Pitesky, M. E., Fergenson, D. P., Steele, P. T., Horn, J., Frank, M. and Gard, E. E. 2006. Following the bio- chemical and morphological changes of
Bacillus atrophaeus
cells during the sporulation process using bioaerosol mass spectrometry.J. Microbiol. Meth
. 67, 56-63.35. Tomás-Pejó, E., Carcía-Aparicio, M., Negr, M. J., Oliva, J.
M. and Ballesteros, M. 2009 Effect of different cellulase dos- age on cell viability and ethanol production by
Kluyveromeces marxianus
in SSF process.Bioresour. Technol
. 100, 890-895.36. Wei, G. Y., Gao, W., Jin, I. H., Yoo, S. Y., Lee, J. H., Chung, C. H. and Lee, J. W. 2009. Pretreatment and saccharification of rice hulls for the production of fermentable sugars.
Biotechnol. Bioprocess Eng
. 14, 828-834.37. Weisburg, W. G., Barns, S. M., Pelletire, D. A. and Lane, D. J. 1991. 16S ribosomal DNA amplication for phylogenetic study.
J. Bacteriol
. 173, 697-703.38. Yi, J. C., Sandra, J. C., John, A. B. and Shu, T. C. 1999.
Production and distribution of endoglucanase, cellobiohy- drolase, and β-glucosidase components of the cellulolytic system of
Volvariella volvacea
, the edible straw mushroom.Appl. Environ. Microbiol
. 65, 553-559.39. Yu, X. B., Nam, J. H., Yun, H. S. and Koo, Y. M. 1998.
Optimization of cellulose production in batch fermentation by