• 검색 결과가 없습니다.

Dose estimation of cone-beam computed tomography in children using personal computer-based Monte Carlo software

N/A
N/A
Protected

Academic year: 2021

Share "Dose estimation of cone-beam computed tomography in children using personal computer-based Monte Carlo software"

Copied!
10
0
0

로드 중.... (전체 텍스트 보기)

전체 글

(1)

1

단국대학교 치과대학 영상치의학교실

김은경

PCXMC 소프트웨어를 이용한 소아에서의 CBCT 환자선량 평가

Dose estimation of cone-beam computed tomography in children using personal computer-based Monte Carlo software

Department of Oral and Maxillofacial Radiology, College of Dentistry, Dankook University

Eun-Kyung Kim

Objective: The purpose of the study was to calculate the effective and absorbed organ doses of cone-beam computed tomography (CBCT) in pediatric patient using personal computer-based Monte Carlo (PCXMC) software and to compare them with those measured using thermoluminescent dosimeters (TLDs) and anthropomorphic phantom.

Materials and Methods: Alphard VEGA CBCT scanner was used for this study. A large field of view (FOV) (20.0 cm x 17.9 cm) was selected because it is a commonly used FOV for orthodontic analyses in pediatric patients. Ionization chamber of dose-area product (DAP) meter was located at the tube side of CBCT scanner. With the clinical exposure settings for a 10-year-old patient, DAP value was measured at the scout and main projection of CBCT. Effective and absorbed organ doses of CBCT at scout and main projection were calculated using PCXMC and PCXMCRotation software respectively. Effec- tive dose and absorbed organ doses were compared with those obtained by TLDs and a 10-year-old child anthropomorphic phantom at the same exposure settings.

Results: The effective dose of CBCT calculated by PCXMC software was 292.6 µSv, and that measured using TLD and anthropomorphic phantom was 292.5 µSv. The absorbed doses at the organs largely contributing to effective dose showed the small differences between two methods within the range from –18% to 20%.

Conclusion: PCXMC software might be used as an alternative to the TLD measurement method for the effective and absorbed organ dose estimation in CBCT of large FOV in pediatric patients.

Key words: Cone-Beam Computed Tomography; Radiation Dosage; Radiation Protection

Corresponding Author

김은경 단국대학교 치과대학 영상치의학교실 E-mail: [email protected]

ABSTRACT

ACKNOWLEDGMENT (이 논문은 2010년도 정부(교육과학기술부)의 재원으로 한국연구재단의 지원을 받아 수행된 기초연구사업임 (No. NRF-2010-0012131))

(2)

I. 서 론

치과용 CBCT (Cone-beam Computed Tomog- raphy)는 1999년 개발되어 시판된 이래 치과의 여러 분야에서 사용이 급속도로 증가하고 있다

1)

. 개발 초기 에는 임플란트 치료계획을 위한 술전 평가에 주로 사 용이 되다가 점차 매복치 위치 평가, 치주 및 치근단 병 소 평가, 근관 형태 확인, 구강외과적 질환 및 외상 평 가, 교정치료 전 분석, 악교정수술 전 분석 등으로 그 용도가 확대되어 치과 진료의 질 향상에 큰 기여를 하 고 있다

2~7)

. 그러나 CBCT 촬영시 받는 환자선량은 기 존의 이차원적 촬영에 비해서 상당히 높기 때문에 특 히 소아 환자가 많은 교정 분야에서의 일상적인 사용 은 주의가 요구된다

6,7)

.

진단용 방사선촬영의 환자선량에 대한 관심이 증가 되면서 치과용 CBCT 촬영시 기종과 촬영 프로토콜에 따른 유효선량에 대한 연구가 다수 보고되었다

7~16)

. 유 효선량의 개념은 낮은 선량의 전리방사선에 노출되었 을 때 확률적 위험도의 측정을 제공하기 위해 개발되

었는데

16,17)

, 이는 연령, 성, 유전적 방사선민감도의 평

균값을 가지는 참조체에 대한 위험도를 나타내는 것으 로, 수많은 불확실한 원인에 의해 영향을 받기 때문에 개개 환자에 제기하는 위험도의 추정에는 사용되어서 안 된다고 강조되었다

16~18)

. 그러나 이러한 한계가 있 음에도 불구하고, 유효선량은 여러 가지 다른 촬영법 의 상대적인 위험도를 비교하는데 유용한 도구로서 여 러 가지 촬영법, 촬영기, 또는 프로토콜을 동일한 방법 으로 선량 측정하여 어느 것의 위험도가 더 크고 작은 지 평가할 수 있다

16)

. 유효선량을 보고하는 많은 연구 들이 열형광선량계(thermoluminescent dosimetry;

TLD)와 인체모형 팬텀을 사용하였다

5,7~14,16)

. 이 방법은 유효선량 결정에 가장 많이 사용되는 방법이나, 가장 큰 단점은 매 노출할 때마다 수십 개의 열형광선량계 칩을

교체해야 하기 때문에 상당히 복잡하고 시간이 많이 소 요된다는 점이다

18,19)

.

이에 몇 몇 연구자들은 비교적 사용이 간편한 개인 용 컴퓨터 기반 Monte Carlo 소프트웨어(personal computer-based Monte Carlo software; PCXMC) (Radiation and Nuclear Safety Authority, Hel- sinki, Finland)가 유효선량을 평가하기 위한 전통적 인 이 방법을 대체할 수 있다고 보고하였다

18~23)

. 치과 용 CBCT

18~20)

, 사측방 방사선촬영과 교익촬영

21)

, 파노 라마방사선촬영

22)

, 흉부방사선촬영

23)

시의 환자선량을 이 소프트웨어를 이용하여 산출한 결과들이 보고되었 다. Kawasaki 등

23)

은 PCXMC 소프트웨어로 얻어진 유효선량은 silicon photodiode 선량계를 사용한 팬 텀 내 선량 측정시스템으로 얻어진 값의 23% 이내로 일 치하여 이 소프트웨어의 유용성을 보여 주었다고 결론 지었으며, Koivisto 등

18)

은 Promax 3D CBCT 장비의 유효선량을 metal-oxide semiconductor field-effect transistor (MOSFET) 선량계와 PCXMC 시뮬레이션으 로 구한 값을 비교하여, 그 차이가 17%로 비교적 작았다 고 보고하였다. 또한 Kim 등

19)

은 Alphard VEGA CBCT 장비로 촬영시 성인에서 PCXMC 소프트웨어로 구한 값은 열형광선량계 방법으로 구한 값보다 16~18% 다 소 작은 유사한 값을 보여 주었다고 보고하였다.

이와 같이 PCXMC 소프트웨어가 치과용 CBCT

의 유효선량을 평가하는데 열형광선량계 기술을 대

체할 방법으로 기대되나, 아직 여러 종류의 CBCT장

비에서 더 많은 연구 결과가 필요하다. 특히 소아에

서 PCXMC 소프트웨어를 사용하여 장기의 흡수선량

및 유효선량은 보고된 바가 없다. 이에 본 연구에서는

소아에서의 CBCT의 장기의 흡수선량 및 유효선량을

PCXMC 소프트웨어를 사용하여 산출하고, 이를 열형

광선량계와 소아 두경부 인체모형 팬텀을 사용하여 얻

은 선량 값과 비교해 보고자 하였다.

(3)

II. 재료 및 방법

CBCT 촬영을 위해 Alphard VEGA (Asahi Roent- gen Ind. Co., Ltd., Kyoto, Japan) 촬영기의 C mode (cephalometric mode) (20.0 cm × 17.9 cm FOV)를 사용하였다. Table 1은 설명서와 일부 참고문헌
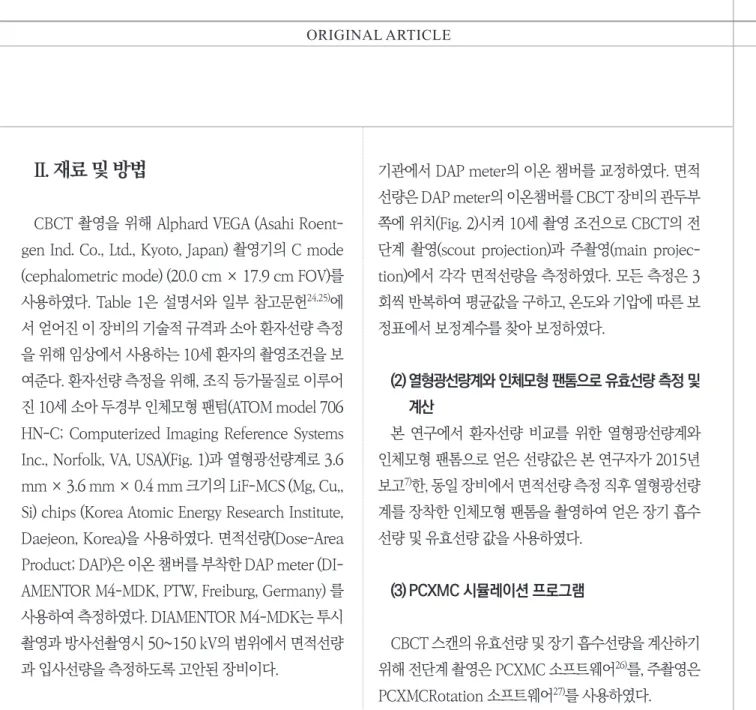
24,25)

에 서 얻어진 이 장비의 기술적 규격과 소아 환자선량 측정 을 위해 임상에서 사용하는 10세 환자의 촬영조건을 보 여준다. 환자선량 측정을 위해, 조직 등가물질로 이루어 진 10세 소아 두경부 인체모형 팬텀(ATOM model 706 HN-C; Computerized Imaging Reference Systems Inc., Norfolk, VA, USA)(Fig. 1)과 열형광선량계로 3.6 mm × 3.6 mm × 0.4 mm 크기의 LiF-MCS (Mg, Cu,, Si) chips (Korea Atomic Energy Research Institute, Daejeon, Korea)을 사용하였다. 면적선량(Dose-Area Product; DAP)은 이온 챔버를 부착한 DAP meter (DI- AMENTOR M4-MDK, PTW, Freiburg, Germany) 를 사용하여 측정하였다. DIAMENTOR M4-MDK는 투시 촬영과 방사선촬영시 50~150 kV의 범위에서 면적선량 과 입사선량을 측정하도록 고안된 장비이다.

(1) 면적선량 측정

면적선량 측정을 시작하기 전에 PTW-Freiburg 교정

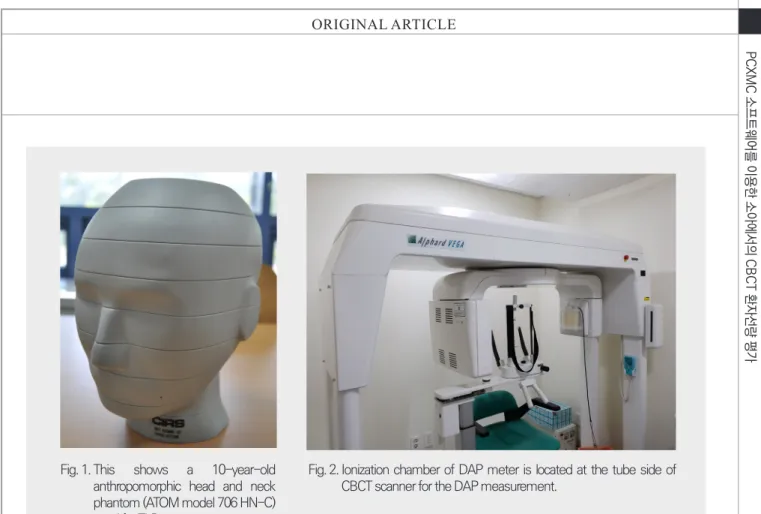
기관에서 DAP meter의 이온 챔버를 교정하였다. 면적 선량은 DAP meter의 이온챔버를 CBCT 장비의 관두부 쪽에 위치(Fig. 2)시켜 10세 촬영 조건으로 CBCT의 전 단계 촬영(scout projection)과 주촬영(main projec- tion)에서 각각 면적선량을 측정하였다. 모든 측정은 3 회씩 반복하여 평균값을 구하고, 온도와 기압에 따른 보 정표에서 보정계수를 찾아 보정하였다.

(2) 열형광선량계와 인체모형 팬톰으로 유효선량 측정 및 계산

본 연구에서 환자선량 비교를 위한 열형광선량계와 인체모형 팬톰으로 얻은 선량값은 본 연구자가 2015년 보고

7)

한, 동일 장비에서 면적선량 측정 직후 열형광선량 계를 장착한 인체모형 팬톰을 촬영하여 얻은 장기 흡수 선량 및 유효선량 값을 사용하였다.

(3) PCXMC 시뮬레이션 프로그램

CBCT 스캔의 유효선량 및 장기 흡수선량을 계산하기 위해 전단계 촬영은 PCXMC 소프트웨어

26)

를, 주촬영은 PCXMCRotation 소프트웨어

27)

를 사용하였다.

3-1. PCXMCRotation 소프트웨어를 이용한 CBCT 스캔 주촬영의 선량 계산

Table 1. The technical specifications and the exposure parameters of the C mode of Alphard VEGA CBCT scanner used in this study

Parameters Value

Total filtration 2.8mm Al equivalent

Focus-collimator distance 76 mm

Degree of rotation 360°

Imaging area 200 × 179 mm

Dimension of collimator 22.7 × 22.7 mm

Focus-rotation center distance 715 mm

Exposure factors 80kV, 4mA, 17s

(4)

PCXMCRotation 소프트웨어는 PCXMC과 동일 한 소프트웨어로, X-선 촬영기가 회전 중심을 갖고, 방 사선의 중심축이 이 중심 즉 PCXMC의 기준점(refer- ence point)을 지나면서 여러 방향에서 환자에게 조사 되는 경우에 선량 계산을 쉽게 할 수 있도록 약간 변형 된 인터페이스(interface)를 제공하는 소프트웨어이다

27)

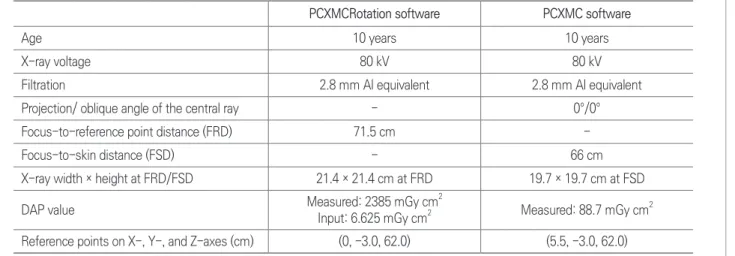
. Alphard VEGA CBCT 촬영기는 360°의 완전 회전 을 하는 장비이므로, 주촬영은 PCXMCRotation 소프 트웨어에서 1° 간격으로 360 개 영상으로 시뮬레이션 하였다. 환자의 연령, 관전압, 여과, projection angle 의 수, 중심선의 oblique angle, 초점에서 기준점까지 의 거리 (FRD), 기준점에서 X선속의 폭경과 높이, 기준 점의 X-, Y-, Z-좌표와 입사 면적선량 값이 선량계산을 위해 입력되었다. 본 연구에서 환자 연령은 10세, 관전압 은 80kV, 여과는 2.8 mm Al 당량, FRD는 71.5 cm였다.

FRD에서 X선속의 폭경과 높이는 CBCT 스캐너 설명서 에 나오는 시준기 크기, 초점-시준기 거리(focus-colli-

mator disatnce; FCD), 초점-회전중심 거리를 사용하 여 계산하였다. 입사 면적선량 값은 주촬영 동안 측정한 면적선량 값을 360으로 나눈 값을 입력하였다(Table 2).
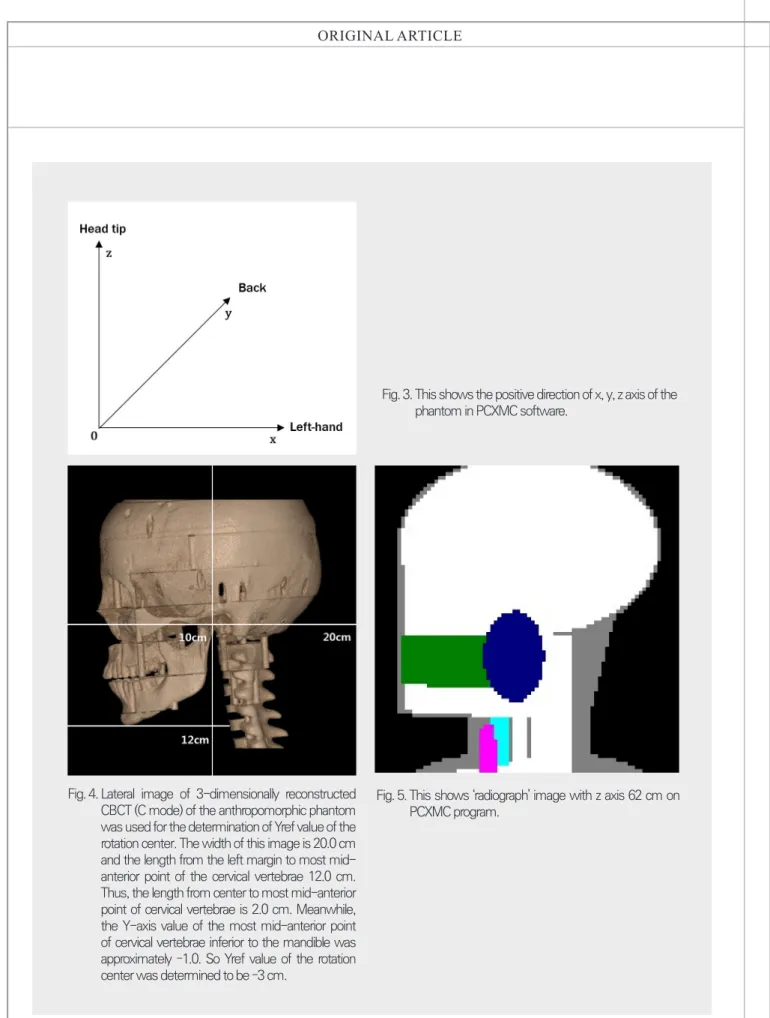
회전 중심(기준점)의 X

ref,

Y

ref,

Z

ref

값은 다음과 같이 결 정되었다. PCXMC 소프트웨어의 좌표 체계는 팬텀의 몸체 기저부의 중앙에서 시작해서 positive Z축은 상방 으로, positive X축은 좌측으로, positive Y축은 phan- tom의 후방으로 향한다(Fig. 3). CBCT 촬영(C mode) 시 환자의 정중시상면을 중앙에 위치시켜 촬영하기 때 문에, 회전 중심의 X

ref

는 0으로 설정되었다. Figs. 4, 5는 결정된 Y

ref,

Z

ref

값을 보여 준다. 회전 중심의 Y

ref

는 소아 두경부 인체모형 팬텀의 3차원으로 재구성된 CBCT 측 방 영상에서 결정하였다. 영상의 폭경은 20cm이고, 영 상의 좌측 변연부터 하악 하방의 경추 중앙 최전방까지 의 길이는 12cm 였다. 즉 회전 중심으로부터 하악 하방 의 경추 중앙 최전방까지의 길이는 2cm 였다. 한편 하악 하방의 경추 중앙 최전방의 Y축 값은 PCXMC 소프트웨 Fig. 1. This shows a 10-year-old

anthropomorphic head and neck phantom (ATOM model 706 HN-C) used for TLD measurement.

Fig. 2. Ionization chamber of DAP meter is located at the tube side of

CBCT scanner for the DAP measurement.

(5)

어의 ‘the x-ray examination data input form' 스크 린에서 나타나는 ’radiograph' 그래픽에서 대략 -1인 것 을 확인할 수 있었다. 따라서 회전 중심의 Y

ref

는 -3cm 로 결정되었다. 회전 중심의 Z

ref

값을 결정하기 위해서도 이 소프트웨어의 ’radiograph' 그래픽을 활용하였는데, Z

ref

62cm에서 CBCT 촬영시 포함되는 영역이 가장 실 제에 가까운 것을 확인하고 이 값으로 결정하였다(Table 2). 이들 값을 입력하여 ICRP 103

28)

에 기초한 장기 흡수 선량과 유효선량을 계산하였다.

3-2. PCXMC 소프트웨어를 이용한 CBCT 스캔 전단 계 촬영의 선량 계산

PCXMC 소프트웨어는 투사방사선촬영의 X선 촬영 의 투사 각도 및 검사 조건의 자유로운 조정을 통하여 환자의 장기 흡수선량과 유효선량을 계산할 수 있는 Monte Carlo 기반의 시뮬레이션 컴퓨터 프로그램이다

26)

. Alphard VEGA CBCT 촬영기는 CBCT의 주촬영에 들어가기 전에 환자의 적정 위치를 잡기 위해 전단계 촬 영을 시행하는데, C-mode에서 전단계 촬영은 일종의 측방 방사선촬영이므로 선량 계산을 위해 PCXMC 소 프트웨어를 사용하였다. 환자 위치는 주촬영과 동일한

위치에서 촬영되기 때문에 Y

ref

, Z

ref

(여기서 기준점은 방 사선의 피부 입사점) 값은 주촬영에서의 값과 동일하게 입력하였으며, X

ref

(기준점의 X 좌표)와 초점-피부 거리 (Focus-to-skin distance; FSD)는 PCXMC 소프트웨어 에서 ’radiograph' 그래픽을 참고로 하여 각각 5.5 cm, 66 cm로 결정하였다(Table 2). 본 연구에서 환자 연령, 관전압, 여과는 주촬영과 동일하였고, 초점-피부 거리에 서 X선속의 폭경과 높이는 CBCT 스캐너 설명서에 나오 는 시준기 크기, 초점-시준기 거리, 초점-피부 거리를 사 용하여 계산하였다. input DAP는 전단계 촬영 동안 측 정한 면적선량 값을 입력하였다(Table 2). 이들 값을 입 력하여 ICRP 103에 기초한 장기 흡수선량과 유효선량 을 계산하고 주촬영시의 선량과 합하여 총 장기 흡수선 량과 총 유효선량을 산출하여, 열형광선량계와 소아 두 경부 인체모형 팬텀을 사용하여 얻은 유효선량 및 장기 흡수선량 값

7)

과 비교하였다.

III. 결과

PCXMC 소프트웨어로 계산된 CBCT의 유효선량은

Table 2. Input values for dose calculation in PCXMC and PCXMCRotation software

PCXMCRotation software PCXMC software

Age 10 years 10 years

X-ray voltage 80 kV 80 kV

Filtration 2.8 mm Al equivalent 2.8 mm Al equivalent

Projection/ oblique angle of the central ray - 0°/0°

Focus-to-reference point distance (FRD) 71.5 cm -

Focus-to-skin distance (FSD) - 66 cm

X-ray width × height at FRD/FSD 21.4 × 21.4 cm at FRD 19.7 × 19.7 cm at FSD

DAP value Measured: 2385 mGy cm

2

Input: 6.625 mGy cm

2

Measured: 88.7 mGy cm

2

Reference points on X-, Y-, and Z-axes (cm) (0, -3.0, 62.0) (5.5, -3.0, 62.0)

(6)

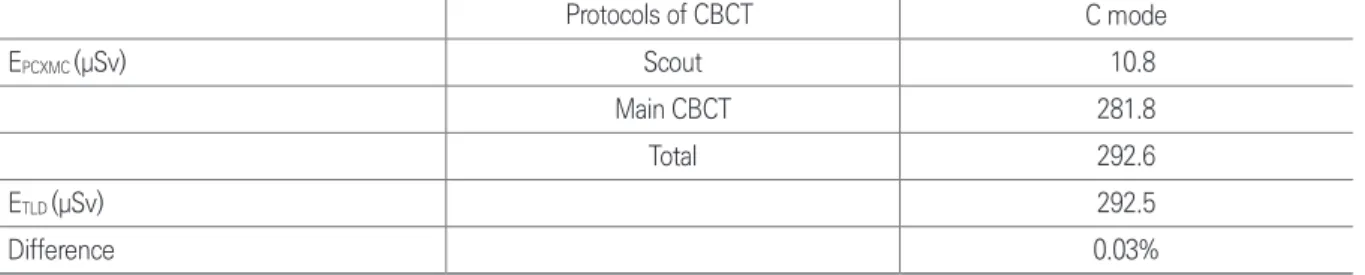
292.6 µSv, 열형광선량계와 10세 소아 두경부 팬텀을 사용하여 측정한 유효선량은 292.5 µSv로 거의 차이가 없었다(Table 3).

PCXMC 소프트웨어로 계산된 장기의 흡수선량과 열 형광선량계를 사용하여 측정한 흡수선량은 Table 4에 서 볼 수 있다. PCXMC 소프트웨어로 계산된 흡수선량

(D

PCXMC

)을 열형광선량계를 사용하여 측정한 흡수선량

(D

TLD

)과 비교하기 위해, D

TLD

에 대한 (D

PCXMC

- D

TLD

) 값

의 백분율을 구하였다. 그 백분율은 골수강, 골표면, 뇌, 타액선, 피부, 임파선, 근육에서 11%에서 376%까지 양 의 값으로 나타났으며 식도, 갑상선, 외흉부기도, 구강 점막은 –4%에서 –78%까지 음의 값으로 나타났다. D

TLD

에 대한 (D

PCXMC

- D

TLD

) 값의 백분율이 양의 값을 보이는 경우 즉 D

PCXMC

가 D

TLD

보다 크게 나타나는 장기 중 가장 큰 차이를 보여 주는 것은 임파선이었으며, 음의 값을 보 이는 경우 즉 D

PCXMC

가 D

TLD

보다 작게 나타나는 장기 중

C mode

E

PCXMC

(µSv) Scout 10.8

Main CBCT 281.8

Total 292.6

E

TLD

(µSv) 292.5

Difference 0.03%

EPCXMC: effective dose calculated by the PCXMC software

ETLD : effective dose measured using TLD technology, published data7) Difference : (EPCXMC – ETLD) / ETLD

Table 4. Absorbed organ doses at various organ and tissues calculated by PCXMC software and those measured using TLD and phantom

Organ/tissues Cone-beam CT (C-mode)

D

PCXMC

(μGy) D

TLD

(μGy) Difference

Bone marrow 348 290 20%

Oesophagus 52 232 -78%

Thyroid 3094 3582 -14%

Bone surface 1613 1043 55%

Brain 1875 1671 12%

Salivary glands 2989 2685 11%

Skin 515 191 170%

Remainder

Lymphatic nodes 690 145 376%

Muscle 161 145 11%

Extrathoracic airway 2079 2540 -18%

Oral mucosa 2403 2512 -4%

DPCXMC: absorbed organ dose calculated by the PCXMC software

DTLD : absorbed organ dose measured using TLD technology, published data7) Difference : (DPCXMC – DTLD) / DTLD

Protocols of CBCT

(7)

Fig. 3. This shows the positive direction of x, y, z axis of the phantom in PCXMC software.

Fig. 4. Lateral image of 3-dimensionally reconstructed CBCT (C mode) of the anthropomorphic phantom was used for the determination of Yref value of the rotation center. The width of this image is 20.0 cm and the length from the left margin to most mid- anterior point of the cervical vertebrae 12.0 cm.

Thus, the length from center to most mid-anterior point of cervical vertebrae is 2.0 cm. Meanwhile, the Y-axis value of the most mid-anterior point of cervical vertebrae inferior to the mandible was approximately –1.0. So Yref value of the rotation center was determined to be –3 cm.

Fig. 5. This shows ‘radiograph’ image with z axis 62 cm on

PCXMC program.

(8)

가장 작게 나타나는 장기는 식도였다.

유효선량에 기여도가 높은 기관인 골수, 갑상선, 타 액선, 외흉부기도와 구강점막의 흡수선량은 –18%에서 20%까지의 차이를 보여 주었다.

IV. 고찰

PCXMC 소프트웨어는 X-선 검사할 때 환자의 장기 및 유효선량을 계산하는 Monte Carlo 기반 시뮬레이 션 컴퓨터 프로그램

18,26,27)

으로, 정적인 상태에서 X-선 검사시 촬영 각도와 기타 촬영 프로토콜을 입력하여 선량을 계산할 수 있다. PCXMCRotation 소프트웨 어는 회전하는 X선 장비에서 X선이 여러 방향에서 환 자를 조사하는 경우에 쉽게 선량 계산을 할 수 있도록 고안된 인터페이스를 가진다. 본 연구에서는 PCXM- CRotation 소프트웨어와 PCXMC 소프트웨어를 각 각 CBCT 스캔의 주촬영, 전단계촬영의 선량 계산을 위해 사용하였다.

본 연구에서 소아에서의 CBCT의 유효선량을 PCX- MC 소프트웨어를 사용하여 산출하고, 이를 열형광선량 계와 10세 소아 두경부 인체모형 팬텀을 사용하여 얻은 선량 값과 비교해 본 결과, PCXMC 소프트웨어로 계산 된 유효선량은 292.6 µSv, 열형광선량계와 인체모형 팬 텀을 사용하여 측정한 유효선량은 292.5 µSv로 거의 동 일한 값을 보였다. Kim 등

19)

은 Alphard VEGA CBCT 장비의 3개 field of view (FOV)에서 성인에서의 유효 선량을 PCXMC 소프트웨어와 열형광선량계 방법으로 각각 구하여 비교하였는데, PCXMC 소프트웨어로 계산 된 유효선량은 181 µSv, 열형광선량계와 인체모형 팬 텀을 사용하여 측정한 유효선량은 216 µSv로, PCXMC 소프트웨어로 계산된 유효선량이 열형광선량계로 측 정한 선량 값보다 16% 낮은, 유사한 값을 보여 주었다.

Koivisto 등

18)

은 Promax 3D CBCT 장비의 유효선량 을 metal-oxide semiconductor field-effect transis- tor (MOSFET) 선량계와 PCXMC 시뮬레이션으로 구한 값을 비교하여, PCXMC 시뮬레이션으로 구한 유효선 량값이 MOSFET 선량계로 구한 값과 17% 정도의 비교 적 작은 차이를 보였다고 보고하였다. Kawasaki 등

23)

은 PCXMC 소프트웨어로 소아에서의 흉부 방사선촬 영시 기관 및 유효선량을 계산하여, silicon photodi- ode 선량계를 사용한 팬텀내 선량 측정시스템으로 얻 어진 값과 비교하였는데, PCXMC 소프트웨어로 얻어 진 유효선량은 선량 측정시스템으로 얻어진 값의 23%

이내로 일치하여 이 소프트웨어의 유용성을 보여 주었 다고 결론지었다.

본 연구에서 PCXMC 소프트웨어를 사용하여 산출한

유효선량은 열형광선량계로 측정한 유효선량과 거의 동

일한 값을 보였으나, 장기 흡수선량은 다양한 양상을 보

여 주었다. PCXMC 소프트웨어를 사용하여 산출한 흡

수선량은 식도, 갑상선, 외흉부기도, 구강 점막에서 열

형광선량계로 측정한 흡수선량보다 낮게 나온데 반해,

골수강, 골표면, 뇌, 타액선, 피부, 임파선, 근육에서 높

게 나타났다. 특히 임파선의 경우 열형광선량계로 측정

한 흡수선량보다 376% 높은 값을 보였다. Kim 등

19)

동일 장비 C-mode의 CBCT촬영의 성인에서 PCXMC

소프트웨어를 사용시 장기 흡수선량은 뇌, 피부, 임파선

에서는 높게, 나머지 조직 및 기관에서는 낮게 나타났으

며, 특히 임파선의 경우 열형광선량계로 측정한 흡수선

량보다 269% 높은 값을 보였다고 보고하였다. 두 연구

에서 동일하게 임파선의 흡수선량이 PCXMC 소프트웨

어를 사용하여 산출할 때, 열형광선량계로 측정할 때보

다 훨씬 높게 나오는 것은 두 가지 방법 중 어느 것이 더

정확한지 알기 어려우나, 열형광선량계 측정의 경우 임

파선 흡수선량을 위한 TLD 칩의 위치를 10개로 설정하

여 방사선에 조사되는 조직 및 기관의 비율을 곱하여 산

(9)

출한 값으로 비교적 정확한 값으로 생각할 수 있었고, PCXMC 소프트웨어에서 흡수선량 산출값이 너무 높게 산정된 것으로 추정되었다. 다행히 방사선에 조사되는 조직 및 기관의 비율이 임파선의 경우 5%

7~9,12)

로, 유효 선량에 기여하는 양이 작아 전체 유효선량에 큰 영향을 미치지 못하였다. PCXMC 소프트웨어로 산출한 흡수선 량이 열형광선량계로 측정한 흡수선량보다 가장 낮게 나오는 기관은 식도로, 열형광선량계로 측정한 흡수선 량보다 78% 낮게 산출되었다. 이는 Kim 등

19)

의 연구에 서도 동일하게 식도의 PCXMC 소프트웨어로 산출한 흡 수선량이 열형광선량계로 측정한 흡수선량보다 68% 낮 게 산출되었다. 가능한 원인은 열형광선량계로 흡수선 량 측정시 TLD 칩의 위치를 1개로 설정

7~9,12)

하여, 선량 을 많이 흡수하는 상부 한 군데에서만 측정한 값으로 흡 수선량을 결정했기 때문으로 생각되었으며, 따라서 열 형광선량계 측정 선량이 부정확할 수 있는 것으로 생각 되었다. 다행히 식도도 조직 및 기관의 비율은 10%

7~9,12)

로, 유효선량에 기여하는 양이 작아 전체 유효선량에 큰 영향을 미치지 못하였다.

CBCT 촬영시 방사선에 조사되는 조직 및 기관의 비 율과 조직가중계수를 고려해 볼 때 골수, 갑상선, 타액 선, 외흉부기도와 구강 점막이 유효선량에 가장 큰 기여 를 하는 기관이다

7,19)

. PCXMC 소프트웨어로 계산된 이

들 장기의 흡수선량값은 열형광선량계로 측정한 선량값 보다 –18%에서 20%까지의 차이를 보여 주었다. 골수와 타액선은 높게, 갑상선, 외흉부기도와 구강 점막은 낮게 나타났다. Kim 등

19)

의 연구에서 이들 장기는 –42%에서 –2%까지 모두 낮게 나타났으며, 두 연구 모두에서 외흉 부조직이 가장 낮은 값을 보였다. 본 연구에서 유효선량 에 큰 기여를 하는 조직 및 기관이 비교적 작은 차이를 보여, PCXMC 소프트웨어로 계산된 유효선량과 열형광 선량계로 측정한 유효선량이 거의 동일한 값을 보인 것 을 알 수 있었다.

유효선량을 구하는 일반적인 방법인 열형광선량계로 측정하는 경우에도 여러 단계에서 발생하는 차이, 예를 들어 선량계를 위치시키는 팬텀의 종류, 측정에 사용되 는 선량계의 수, 팬텀 내 선량계의 위치, 촬영시 FOV의 위치 등에 의해 유효선량값의 차이가 발생된다

13)

. 본 연 구에서 PCXMC 소프트웨어를 사용하여 산출한 조직 및 장기의 흡수선량은 다양한 양상을 보여 주었으나, 유효 선량에 가장 큰 기여를 하는 주요 장기들은 –18%에서 20%까지의 차이로 큰 차이를 보이지 않았다. 또한 전체 유효선량값은 열형광선량계로 측정한 유효선량 값과 거 의 동일한 값을 보여, PCXMC 소프트웨어는 소아에서 CBCT 스캔의 장기 흡수선량과 유효선량 측정에 사용할 수 있을 것으로 생각된다.

1. Arai Y, Tammisalo E, Iwai K, Hashimoto K, Shinoda K. Develop- ment of a compact computed tomographic apparatus for dental use.

Dentomaxillofac Radiol 1999;28:245-248.

2. Lofthag-Hansen S, Grondal K, Ekestubbe A. Cone-beam CT for preoperative implant planning in the posterior mandible: visibility of anatomic landmarks. Clin Implant Dent Relat Res 2009;11:246-255.

3. Momin MA, Matsumoto K, Ejima K, Asaumi R, Kawai T, Arai Y, Hon-

da K, Yosue T.Correlation of mandibular impacted tooth and bone morphology determined by cone beam computed topography on a premise of third molar operation. Surg Radiol Anat 2013;35:311-318.

4. Patel S, Dawood A, Whaites E, Ford T. New dimensions in end- odontic imaging: part 1. Conventional and alternative radiographic systems. Int Endod J 2009;42:447-462.

5. Silva MA, Wolf U, Heinicke F, Bumann A, Visser H, Hirsch E. Cone-

참 고 문 헌

(10)

beam computed tomography for routine orthodontic treatment planning: a radiation dose evaluation. Am J Orthod Dentofacial Or- thop 2008;133:640.e1-5.

6. Radiation protection No. 172. Evidence based guidelines on cone beam CT for dentaland maxillofacial radiology. [Internet]. Luxemburg:

European commission; 2012 [cited 2020 January 1]. Available from:

https://ec.europa.eu/energy/sites/ener/files/documents/172.pdf 7. 김은경. 소아환자에서 교정분석을 위한 콘빔CT 촬영시 유효선량에 관한

연구. 대한치의사협회지 2015;53:558-568.

8. Ludlow JB, Davis-Ludlow LE, Brooks SL, Howerton WB. Dosimetry of 3 CBCT devices for oral and maxillofacial radiology: CB Mercuray, NewTom 3G and i-CAT. Dentomaxillofac Radiol 2006;35:219-226.

9. Ludlow JB, Ivanovic M. Comparative dosimetry of dental CBCT de- vices and 64-slice CT for oral and maxillofacial radiology. Oral Surg Oral Med Oral Pathol Oral Radiol Endod 2008;106:106-114.

10. Roberts JA, Drage NA, Davies J, Thomas DW. Effective dose from cone beam CT examinations in dentistry. Br J Radiol 2009;82:35- 11. Loubele M, Bogaerts R, Van Dijck E, Pauwels R, Vanheusden S, 40.

Suetens P, Marchal G, Sanderink G, Jacobs R. Comparison be- tween effective radiation dose of CBCT and MSCT scanners for dentomaxillofacial applications. Eur J Radiol 2009;71:461-468.

12. Qu XM, Li G, Ludlow JB, Zhang ZY, Ma XC. Effective radiation dose of ProMax 3D cone-beam computerized tomography scanner with different dental protocols. Oral Surg Oral Med Oral Pathol Oral Radiol Endod 2010;110:770-776.

13. Pauwels R, Beinsberger J, Collaert B, Theodorakou C, Rogers J, Walker A, Cockmartin L, Bosmans H, Jacobs R, Bogaerts R, Horner K, The SEDENTEXCT Project Consortium. Effective dose range for dental cone beam computed tomography scanners. Eur J Radiol 2012;81:267-271.

14. Jeong DK, Lee SC, Huh KH, Yi WJ, Heo MS, Lee SS, Choi SC. Com- parison of effective dose for imaging of mandible between multi- detector CT and cone-beam CT. Imaging Sci Dent 2012;42:65-70.

15. Kim DS, Rashsuren O, Kim EK. Conversion coefficients for the estimation of effective dose in cone-beam CT. Imaging Sci Dent 2014;44:21-29.

16. Ludlow JB, Timothy R, Walker C, Hunter R, Benavides E, Samu- elson D, Scheske MJ. Effective dose of dental CBCT — a meta analysis of published data and additional data for nine CBCT units.

Dentomaxillofac Radiol 2015;44:20140197.

17. Martin CJ. Effective dose: how should it be applied to medical ex- posures? Br J Radiol 2007;80:639-647.

18. Koivisto J, Kiljunen T, Tapiovaara M, Wolff J, Kortesniemi M. Assess-

ment of radiation exposure in dental cone-beam computerized to- mography with the use of metal-oxide semiconductor field-effect transistor (MOSFET) dosimeters and Monte Carlo simulations. Oral Surg Oral Med Oral Pathol Oral Radiol 2012;114:393-400.

19. Kim EK. Han WJ. Choi JW. Battulga B. Estimation of the effec- tive dose of dental cone-beam computed tomography using per- sonal computer-based Monte Carlo software. Imaging Sci Dent 2018;48:21-30.

20. Vassileva J, Stoyanov D. Quality control and patient dosimetry in dental cone beam CT. Radiat Prot Dosimetry 2010;139:310-312.

21. Aps JK, Scott JM. Oblique lateral radiographs and bitewings; esti- mation of organ doses in head and neck region with Monte Carlo calculations. Dentomaxillofac Radiol 2014;43:20130419.

22. Lee C, Lee SS, Kim JE, Huh KH, Yi WJ, Heo MS, Choi SC. Com- parison of dosimetry methods for panoramic radiography: thermo- luminescent dosimeter measurement versus personal computer- based Monte Carlo method calculation. Oral Surg Oral Med Oral Pathol Oral Radiol 2016;121:322-329.

23 Kawasaki T, Aoyama T, Yamauchi-Kawaura C, Fujii K, Koyama S.

Organ dose and effective dose estimation in paediatric chest radio- graphic examinations by using pin silicon photodiode dosemeters.

Radiat Prot Dosimetry 2013;154:314-319.

24. Okano T, Matsuo A, Gotoh K, Yokoi M, Hirukawa A, Okumura S, Koyama S. Comparison of absorbed and effective dose from two dental cone beam computed tomography scanners. Nihon Ho- shasen Gijutsu Gakkai Zasshi 2012;68:216-225. (Article in Japa- nese)

25. Reeves TE, Mah P, McDavid WD. Deriving Hounsfield units using grey levels in cone beam CT: a clinical application. Dentomaxillofac Radiol 2012;41:500-508.

26. Tapiovaara M, Siiskonen T. PCXMC, a Monte Carlo program for calculating patient doses in medical X-ray examinations, 2nd ed. STUK-A231. [Internet] STUK. Helsinki; 2008 [cited 2020 January 1]. Available from https://www.stuk.fi/docu- ments/12547/474783/stuk-a231.pdf/c950e99c-3537-4344- bf76-07a54e5f1afa?t=1439557836831.

27. Tapiovaara M. PCXMC 2.0 supplementary programs user's guide.

[Internet] STUK. Helsinki; 2012 [cited 2020 January 1]. Available from https://www.stuk.fi/documents/12547/474783/PCX- MC_20_Supplementary_programs_UsersGuide.pdf/

28. The 2007 Recommendations of the International Commis- sion on Radiological Protection. ICRP Publication 103. Ann ICRP.

2007;37(2-4):1-332.

참 고 문 헌

수치

Table 1.   The technical specifications and the exposure parameters of the C mode of Alphard VEGA CBCT scanner used in this  study
Fig. 2.   Ionization chamber of DAP meter is located at the tube side of  CBCT scanner for the DAP measurement.
Table 2. Input values for dose calculation in PCXMC and  PCXMCRotation software
Table 4.   Absorbed organ doses at various organ and tissues calculated by PCXMC software and those measured using TLD  and phantom
+2

참조

관련 문서

Key words : Midpalatal suture, Rapid maxillary expansion, Cone-beam computed tomography, Cervical vertebral

ORAL BIOLOGY RESEARCH 2012; 36(1) 44 49 Case Report Cone beam computed tomography 영상에서의 쇄골두개형성이상 이근선ᆞ김재덕* 조선대학교

Objectives: This study aimed to compare the accuracy of conventional intraoral (CI) radiography, photostimulable phosphor (PSP) radiography, cone beam computed tomography (CBCT)

6 The use of novel imaging modalities such as cone-beam computed tomography (CBCT), with lower equipment costs, lower patient radiation dose, shorter scan- ning time, and

Objective: To estimate the projected cancer risk attributable to diagnostic cone-beam computed tomography (CBCT) performed under different exposure settings for orthodontic

Purpose: This study was performed to evaluate the feasibility of visualizing soft tissue lesions and vascular struc- tures using contrast-enhanced cone-beam computed

Purpose: This study was performed to evaluate the linear distance accuracy and reliability of stitched small field of view (FOV) cone-beam computed tomography (CBCT)

Cone-beam computed tomography (CBCT) has been widely accepted in dentistry since its introduction in 1998. 9,10 A few studies have used this imaging technique to evaluate