Introduction
Osteoporosis is a skeletal disease characterized by a low bone mass, deterioration of the bone structure, and an increased risk of bone fracture, and is a major health prob- lem.1Most of the cases are in women (90%), with Caucasian and Asian women at the highest risk. African-American and Latina women are at a lower but still significant risk.2,3 One-third of the women diagnosed with osteoporosis devel- op a fracture within 5 years.4Hence, early diagnosis can improve the prognosis and the quality of life of patients;
however, the silent nature of this disease may delay the diagnosis until fractures occur.5
Dentists are commonly consulted by a large segment of the population. Dental radiographs are usually taken to diagnose conditions affecting the teeth and jaws. Therefore, these radiographs may offer an opportunity as a screening tool for osteoporosis.6,7Moreover, it was observed that the mandibular and femoral cortical width were decreased in a similar manner.8
Cone-beam computed tomography (CBCT) has been widely accepted in dentistry since its introduction in 1998.9,10A few studies have used this imaging technique to evaluate osteoporosis of the jaw.11However, additional programs, special phantoms, or both were used in most of these studies to analyze CBCT images. These complicated procedures hinder the use of such a method as a screening tool for osteoporosis. There is also the additional cost of the software or the use of a phantom. However, manufac- turers of CBCT devices provide viewer software to study the images produced by their device. This software includes
Received January 18, 2014; Revised June 20, 2014; Accepted June 30, 2014
*Correspondence to : Dr. Imad Barngkgei
Oral Medicine Department, Faculty of Dentistry, Damascus University, Mazzeh Highway, Syrian Arab Republic-Damascus, Syria
Tel) 963-93-2785-671, Fax) 963-11-212-4757, E-mail) [email protected]
Copyright ⓒ 2014 by Korean Academy of Oral and Maxillofacial Radiology
This is an Open Access article distributed under the terms of the Creative Commons Attribution Non-Commercial License (http://creativecommons.org/licenses/by-nc/3.0) which permits unrestricted non-commercial use, distribution, and reproduction in any medium, provided the original work is properly cited.
Imaging Science in Dentistry∙pISSN 2233-7822 eISSN 2233-7830
Osteoporosis prediction from the mandible using cone-beam computed tomography
Imad Barngkgei1,*, Iyad Al Haffar1, Razan Khattab2
1Department of Oral Medicine, Faculty of Dentistry, Damascus University, Damascus, Syria
2Department of Periodontology, Faculty of Dentistry, Damascus University, Damascus, Syria
ABSTRACT
Purpose: This study aimed to evaluate the use of dental cone-beam computed tomography (CBCT) in the diagnosis of osteoporosis among menopausal and postmenopausal women by using only a CBCT viewer program.
Materials and Methods: Thirty-eight menopausal and postmenopausal women who underwent dual-energy X-ray absorptiometry (DXA) examination for hip and lumbar vertebrae were scanned using CBCT (field of view: 13 cm×
15 cm; voxel size: 0.25 mm). Slices from the body of the mandible as well as the ramus were selected and some CBCT- derived variables, such as radiographic density (RD) as gray values, were calculated as gray values. Pearson’s corre- lation, one-way analysis of variance (ANOVA), and accuracy (sensitivity and specificity) evaluation based on linear and logistic regression were performed to choose the variable that best correlated with the lumbar and femoral neck T-scores.
Results: RD of the whole bone area of the mandible was the variable that best correlated with and predicted both the femoral neck and the lumbar vertebrae T-scores; further, Pearson’s correlation coefficients were 0.5/0.6 (p value== 0.037/0.009). The sensitivity, specificity, and accuracy based on the logistic regression were 50%, 88.9%, and 78.4%, respectively, for the femoral neck, and 46.2%, 91.3%, and 75%, respectively, for the lumbar vertebrae.
Conclusion: Lumbar vertebrae and femoral neck osteoporosis can be predicted with high accuracy from the RD value of the body of the mandible by using a CBCT viewer program. (Imaging Sci Dent 2014; 44: 263-71)
KEY WORDS: Bone Density; Cone-Beam Computed Tomography; DXA Scan; Osteoporosis
the necessary tools for basic and simple analyses such as multi-planar reconstruction, and measurements of the di- mensions and radiographic density (RD) of the bone.
Therefore, the aim of this study was to evaluate the use of CBCT images in the prediction of osteoporosis in menopausal and postmenopausal women by using only the viewer program.
Materials and Methods
Subjects
Thirty-eight menopausal and postmenopausal women between the ages of 46 and 75 years (mean: 57.9±7.2 years) were enrolled in this study. All of them were free of dia- betes, thyroid disorders, and bone diseases other than osteopenia or osteoporosis. Conventionally, they were clas- sified into three groups, according to the T-score defined by the World Health Organization (WHO),12 once with respect to the lumbar T-score and the other time, with
respect to the femoral neck T-score. Group 1 consisted of those classified as normal with respect to bone mineral density (BMD) (T-score›-1); group 2, osteopenic women (-2.5⁄T-score⁄-1); and group 3, osteoporotic women (T-score‹-2.5). The numbers of subjects in each group were 10, 15, and 13, respectively, with respect to the lum- bar vertebrae T-score, and 17, 11, and 10 respectively, with respect to the femoral neck T-score. Taking into account ethical considerations, the Faculty of Dentistry-Damascus University Board approved this study. In addition, informed consent was obtained from each participating woman.
Dual-energy X-ray absorptiometry (DXA) examination A DXA examination of the participants had been ordered by the physicians. The patients were invited to participate in this study only after this examination. The examination was performed using the Hologic Discovery QDR® (Holog- ic Inc., Bedford, MA, USA), calibrated daily in accordance with the manufacturer’s recommendations. The lumbar spine (L1-L4) and the femoral neck were analyzed. T-scores
A B
C D
E F
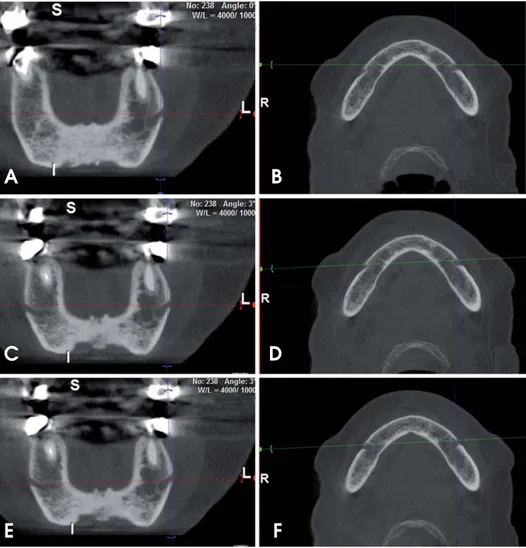
Fig. 1. The angulation adjustment procedure of the CBCT images is seen. Coronal (A) and axial (B) slices before angulation adjustment. Note that the openings of the left and the right foramina do not appear sym- metrical in the same coronal slice.
The angulation of the coronal slice (C) is adjusted using the coronal (the green) cursor on the axial slice win- dow (D). Now, both foramina appear simultaneously on the coronal views.
This is checked further by navigat- ing through all the coronal slices.
Using the axial (the red) cursor on the coronal slice window (E), we adjusted the angulation of the axial slice (F) to be parallel with the lower border of both foramina.
were calculated from the young adult normal white refer- ence databases as reported by the equipment manufacturer.
CBCT imaging
A WhiteFox® unit (Acteon Group Ltd., Milan, Italy) was used in this study. The field of view (FOV) and the voxel size were set at 13 cm×15 cm and 250μm, respec- tively. WhiteFox Imaging® Version 3 (Acteon Group Ltd., Milan, Italy) is the viewer software that was used to ana- lyze the CBCT images. Like most viewers, it contains basic tools such as those for RD calculations, dimension measurements, and multi-planar reconstruction.
Angulation adjustment of CBCT images
In order to reduce the differences in head position be- tween participants and for reproducibility purposes, the angulation of the slices was adjusted manually first by ad- justing the coronal cursor in the axial window, so that the right and left mental foramina had a symmetrical appear- ance. This was checked by navigating throughout the coro- nal slices and observing this symmetry of the right and left mental foramina (Figs. 1A-D). Second, the axial cursor (in the coronal window) was adjusted to pass through the lower borders of both mental foramina (Figs. 1E and F).
Slice selection and analysis
An axial slice that passes through the inferior border of both the right and the left mental foramina, described
above, was selected (Fig. 2A). In addition, two axial slices from each ramus were selected (i.e., four axial slices for each participant). The number of axial slices from the sig- moid notch to the convergence of the ramus with the body of the mandible was counted. The inferior slice and the slice in the middle of this range were both selected (Fig.
3A). In total, five slices were selected for each woman.
For each slice, the window level and width were adjusted to gray values of 960 and 0, respectively, so that the slice became a binary image (white and black) (Figs. 2B and 3B).
This would standardize the slice appearance among all the cases studied. Changing the window width to zero would make the bone borders clearer (Figs. 2B and 3B). In addi- tion, the bone would appear divided into two areas, an outer white cortex surrounding an inner black (or speckled black) area, which was considered in this study, and the cortical and the trabecular bone. There has been no previ- ous study that has reported thresholds of the cortical and trabecular bone on the CBCT device used in this study.
Therefore, this study depended on the manufacturer’s claim that they have calibrated the device’s gray values with the Hounsfield Unit (HU) of conventional CT,13and on corti- cal bone thresholds determined previously in CT images.14 Using the “measure polygon” tool with a magnification factor of 250%, we calculated the RD and area in square millimeters of the whole bony region (Figs. 2C and 3C) and of the trabecular bone alone (Figs. 2D and 3D) for each selected slice. Then, the ratio between the trabecular area and the whole bony area was calculated. In total, the values of two variables-RD in gray values for the whole bony
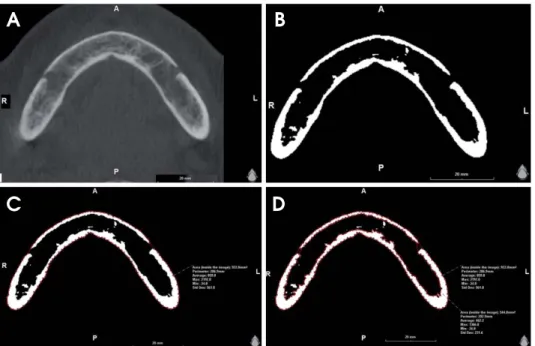
Fig. 2.Measurement procedure for the radiographic density (gray val- ues) and the area (mm2) of the whole bony region and for the trabecular bone alone the mandibular body slice. A. The image shows the slice before the adjustment of the window width and level. B. The window width and level are adjusted to 0 and 960 gray values, respectively. C.
The radiographic density (gray val- ues) and the area (mm2) of the whole bony region are measured using the software. D. The radiographic den- sity (gray values) and the area (mm2) of the trabecular bony region are measured.
A B
C D
area and for the trabecular area alone, and the cortical bone percentage-were calculated for each slice (i.e., 15 values were obtained for each participant).
Statistical analysis
One-way analysis of variance (ANOVA) and a subse- quent Bonferroni test were performed to investigate the significance of the differences between groups in the mean values of the CBCT-derived variables. In addition, Pearson’s correlation was used to find the relationship between the femoral neck and lumbar vertebrae T-scores and CBCT- derived variables. The correlation strength was considered weak, medium, or strong when the correlation coefficient values were 0.2⁄r‹0.4, 0.4⁄r⁄0.7, and r›0.7, respec- tively.14Correlation coefficient values of 0⁄r‹0.2 were regarded as showing no correlation. Next, a logistic regres- sion analysis was carried out, after regrouping subjects into
“osteoporotic” and “not osteoporotic” women according to the DXA results, to identify the strongest predictor of osteoporosis. These prediction models were assessed on
the basis of their statistical significance and the sensitivity, specificity, and accuracy of predicting the presence or absence of osteoporosis. For all statistical tests, the signif- icance level was set at 0.05. A kappa test was performed to assess the intra-examiner agreement for 10% (4 CBCT images) of the sample.15
Results
Table 1 summarizes the age and body mass index (BMI) for each group. None of the participants were alcoholic or had a previous bone fracture in either the lumbar vertebrae or the femoral neck. Descriptive data of the CBCT-derived variables for each group are presented in Table 2. Signifi- cances of differences between groups were tested by one- way ANOVA and subsequent Bonferroni tests (Table 2).
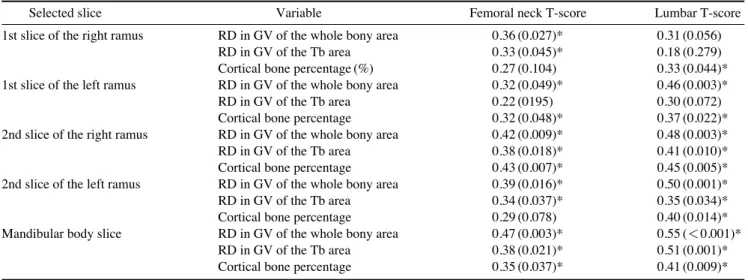
Table 3 shows the Pearson’s correlation test between CBCT-derived variables and lumbar vertebrae and femoral neck T-scores. Correlations with femoral neck T-scores ranged from weak (0.2›r¤0.4) to medium (0.4›r¤0.7).
Fig. 3.Measurement procedure for the radiographic density (gray values) and the area (mm2) of the whole bony region and for the trabecular bone alone the ramus slice A. The axial image shows the slice before the adjustment of the window width and level. B. The window width and level are adjusted to 0 and 960 gray values, respectively. C. The radiographic density (gray values) and the area (mm2) of the whole bony region are measured. D. The radiographic density (gray values) and the area (mm2) of the trabecular bony region are measured.
A B C D
Table 1.Age and body mass index (BMI) for each group
Groups Age (years old) BMI (kg/m2)
Normal (n==10) 52.3 (3.5)*† 29.7 (5.3)
Groups according to lumbar T-score Osteopenia (n==15) 59.1 (7.2)* 31.7 (8.2)
Osteopororsis (n==13) 60.9 (7.1)† 28.5 (3.1)
Normal (n==17) 55.1 (4.6)* 31.0 (7.5)
Groups according to femoral neck T-score Osteopenia (n==11) 58.1 (8.8) 30.4 (5.4)
Osteopororsis (n==10) 62.6 (6.9)* 28.4 (4.2)
*,†: the groups with statistical difference (α==0.05) according to subsequent Bonferroni test
One variable revealed a weak correlation with lumbar T- scores, whereas for the rest of the variables, the correla- tions were moderate. However, not all correlations were significant (Table 3).
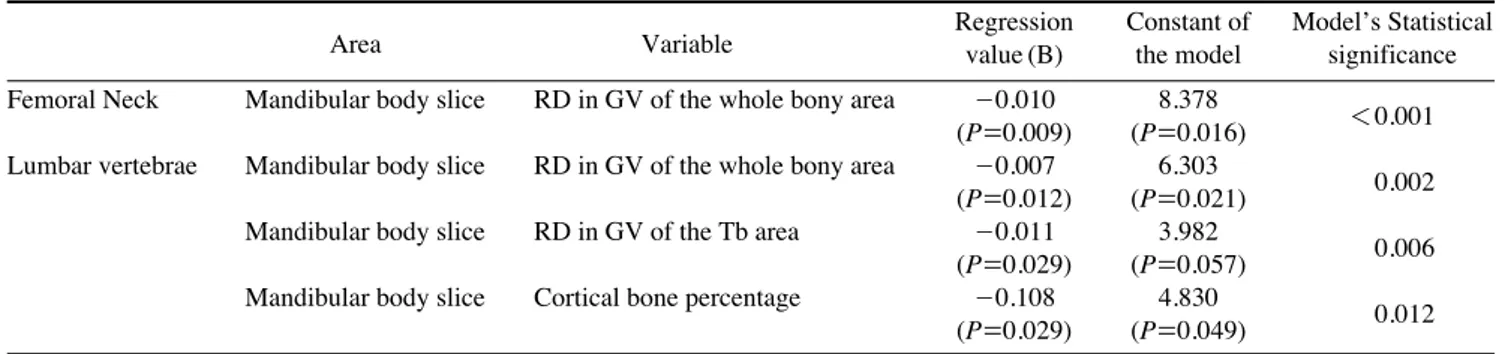
Sensitivity, specificity, and accuracy values based on the logistic regression analysis for each variable are presented in Table 4. A low sensitivity value is a predominant char- acterization. Simple logistic regression test results, for variables that revealed significant differences in their mean values between groups as well as the highest values of Pearson’s correlation and sensitivity, are presented in Table 5. The kappa test value was 0.87, indicating good intra- examiner agreement.
Discussion
Osteoporotic fractures may affect any area of the skele- ton other than the face, and the most common sites are the hip, vertebrae, proximal humerus, and the forearm.16-18The morbidity and mortality of fractures of the hip are the worst among fracture locations since 10%-20% of women die within the first year of fracture. Those who survive typi- cally suffer from disability that deteriorates the quality of their lives.19Mortality was found to increase by 15% when pain was associated with a vertebral fracture.20The silent nature of this disease increases the difficulty of its diagno- sis.5 Therefore, all medical professionals should partic- ipate in identifying patients suffering from this disease and refer suspicious cases to specialists.
The CBCT technique for dental use, which was intro- duced about one and a half decades ago, offers 2-dimen- sional and 3-dimensional images for the radiographed area with a relatively low cost as compared to conventional CT.
The radiation dose is comparable to that of panoramic imaging in the case of small FOVs. This may explain the widespread use of this technique in dentistry.9,21 It is expected that this imaging technique may substitute for periapical devices in dental clinics in the near future.
Manufacturers of CBCT scanners provide viewer soft- ware allowing the users to open the CBCT dataset and to study the case. Conventionally, this software has the tools necessary for basic analyses such as multi-planar recon- struction, dimension measurement, RD calculation, and the calculation of the mean value of voxel gray values.
Despite its advantages, the CBCT technology has a flaw with respect to RD measurement.21CBCT gray values are considered approximate values14,22 and thus, cannot be expressed as HU as in the case of conventional CT scans.11 Inaccuracy of gray values by CBCT was attributed to the
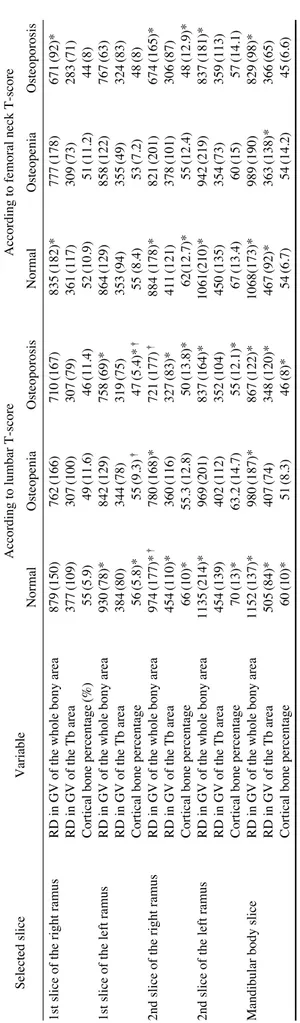
Table 2.Description of the CBCT-derived variables for each group(Mean(Standard deviation)) Selected sliceVariableAccording to lumbar T-scoreAccording to femoral neck T-score NormalOsteopeniaOsteoporosisNormalOsteopeniaOsteoporosis 1st slice of the right ramusRD in GV of the whole bony area879(150)762(166)710(167)835(182)*777(178)671(92)* RD in GV of the Tb area377(109)307(100)307(79)361(117)309(73)283(71) Cortical bone percentage(%)55(5.9)49(11.6)46(11.4)52(10.9)51(11.2)44(8) 1st slice of the left ramusRD in GV of the whole bony area930(78)*842(129)758(69)*864(129)858(122)767(63) RD in GV of the Tb area384(80)344(78)319(75)353(94)355(49)324(83) Cortical bone percentage56(5.8)*55(9.3)†47(5.4)*†55 (8.4)53(7.2)48(8) 2nd slice of the right ramusRD in GV of the whole bony area974(177)*†780(168)*721(177)†884 (178)*821(201)674(165)* RD in GV of the Tb area454(110)*360(116)327(83)*411(121)378(101)306(87) Cortical bone percentage66(10)*55.3(12.8)50(13.8)*62(12.7)*55(12.4)48(12.9)* 2nd slice of the left ramusRD in GV of the whole bony area1135(214)*969(201)837(164)*1061(210)*942(219)837(181)* RD in GV of the Tb area454(139)402(112)352(104)450(135)354(73)359(113) Cortical bone percentage70(13)*63.2(14.7)55(12.1)*67(13.4)60(15)57(14.1) Mandibular body sliceRD in GV of the whole bony area1152(137)*980(187)*867(122)*1068(173)*989(190)829(98)* RD in GV of the Tb area505(84)*407(74)348(120)*467(92)*363(138)*366(65) Cortical bone percentage60(10)*51(8.3)46(8)*54(6.7)54(14.2)45(6.6) RD: radiographic density, GV: gray values, Tb: trabecular bone. RDs are rounded to whole numbers, *,†: the groups with statistical difference(α=0.05) according to subsequent Bonferroni test
absence of water path calibration in contrast to conven- tional CT.23Most studies have reported that the gray values obtained by CBCT are higher than the HU values obtained by conventional CT of the same region.24,25What compli- cates this comparison further is the differences between CBCT scanners in terms of their gray values. Some studies conducted in the last 5 years have found high correlations between gray values of different CBCT scanners both in vitro23,26and in vivo,27and between gray values of CBCT and HU values of conventional CT;24,28,29further, some authors have also suggested equations or formulas for converting gray values to HU values. However, more research effort should be directed to this subject, particu-
larly at the clinical level.
“RD for the whole bony area” of the mandibular body slice was the variable with the strongest power to predict osteoporosis in both the femoral neck and the lumbar ver- tebrae. According to the logistic regression models and one-way ANOVA, if the RD of the whole bony area of the mandible is equal to or lower than gray values of 867-900 or 829-838, the woman is expected to have lumbar verte- brae or femoral neck osteoporosis, respectively. Apart from these absolute values, the current study showed differences in the RD of the mandibular slice by CBCT between the studied groups. Therefore, the above-mentioned thresholds can be converted to values that correspond with other
Table 3.Pearson correlation (P-value) between CBCT-derived variables and T-scores of lumbar and femoral neck
Selected slice Variable Femoral neck T-score Lumbar T-score
1st slice of the right ramus RD in GV of the whole bony area 0.36 (0.027)* 0.31 (0.056)
RD in GV of the Tb area 0.33 (0.045)* 0.18 (0.279)
Cortical bone percentage (%) 0.27 (0.104) 0.33 (0.044)*
1st slice of the left ramus RD in GV of the whole bony area 0.32 (0.049)* 0.46 (0.003)*
RD in GV of the Tb area 0.22 (0195) 0.30 (0.072)
Cortical bone percentage 0.32 (0.048)* 0.37 (0.022)*
2nd slice of the right ramus RD in GV of the whole bony area 0.42 (0.009)* 0.48 (0.003)*
RD in GV of the Tb area 0.38 (0.018)* 0.41 (0.010)*
Cortical bone percentage 0.43 (0.007)* 0.45 (0.005)*
2nd slice of the left ramus RD in GV of the whole bony area 0.39 (0.016)* 0.50 (0.001)*
RD in GV of the Tb area 0.34 (0.037)* 0.35 (0.034)*
Cortical bone percentage 0.29 (0.078) 0.40 (0.014)*
Mandibular body slice RD in GV of the whole bony area 0.47 (0.003)* 0.55 (⁄0.001)*
RD in GV of the Tb area 0.38 (0.021)* 0.51 (0.001)*
Cortical bone percentage 0.35 (0.037)* 0.41 (0.009)*
*: p⁄0.05, RD: radiographic density, GV==gray values, Tb==trabecular bone
Table 4.Sensitivity, specificity, and accuracy of the study variables (%)
Selected slice Variable Lumbar vertebrae Femoral Neck
Sensitivity Specificity Accuracy Sensitivity Specificity Accuracy
1st slice of the right ramus RD in GV of the whole bony area 23 88 66 10 86 66
RD in GV of the Tb area 0 100 66 10 100 76
Cortical bone percentage (%) 15 88 63 20 89 71
1st slice of the left ramus RD in GV of the whole bony area 54 88 76 0 89 66
RD in GV of the Tb area 15 92 66 0 100 74
Cortical bone percentage 54 88 76 20 96 76
2nd slice of the right ramus RD in GV of the whole bony area 31 84 66 30 93 76
RD in GV of the Tb area 15 84 61 20 96 76
Cortical bone percentage 39 88 71 30 96 79
2nd slice of the left ramus RD in GV of the whole bony area 31 80 63 30 89 74
RD in GV of the Tb area 23 88 66 0 100 74
Cortical bone percentage 31 84 66 0 100 74
Mandibular body slice RD in GV of the whole bony area 46 91 75 50 89 78
RD in GV of the Tb area 46 91 75 0 96 69
Cortical bone percentage 46 91 75 30 89 72
RD: radiographic density, GV: gray values, Tb: trabecular bone
scanners’ gray values, or this study methodology might be applied to other CBCT scanners.
A limitation of the current study was the dependence on the above-mentioned claim of the CBCT manufacturers with respect to the discrimination between cortical and trabecular bone. Further studies are highly recommended to determine the thresholds that best correspond with the real anatomy of bone for each CBCT device. However, in the current study, the results of the thresholds used showed quite a good degree of prediction (Tables 4 and 5).
Unlike most other studies, we utilized the simplicity of the viewer software without any additional programs or calibration phantoms that usually are neither available nor easy to use by most dentists. Moreover, no standard head position was used during scanning, and the resulting dif- ferences between participants were overcome by adjusting the angulation in the final sections. On the other hand, the angulation adjustment made the reproducibility of the mea- surements achievable, which was proven by the kappa test.
The two-stage procedure - modification of the angulation and RD calculation - was quite fast and easy. The developers of such software may add a new tool that performs these procedures automatically and sends a message to the den- tist to advice women for further investigation when low bone density is predicted in the femoral neck or the lumbar vertebrae.
In an opposite direction to the findings of Buyukkaplan et al,30this study found that the RD value of the mandibu- lar body of the whole bony area gave a general impression of the status of the femoral neck bone density. This might help to infer the status of one of these two locations when the status of the other site is known.
The correlation between trabecular bone RD and T-scores was less than that observed for the whole bony area. At first glance, this appeared to be opposite the expected result because previous studies found that trabecular bone
was more susceptible to the changes in bone metabolism than the cortex, thus providing better data for early diag- nosis and treatment efficacy.31,32However, our findings may be attributed to the fact that bone microarchitecture is mainly what deteriorates33,34and not the mineral content.
This was consistent with an old study35conducted years before the introduction of DXA and quantitative computed tomography (QCT); this old study reported changes in the trabecular bone during osteoporosis. Although our result regarding the relationship between the RD of the mandibu- lar trabecular bone and lumbar T-scores (r==0.51, p==0.001) was slightly higher than the findings of Naito et al14(r== 0.35; p==0.059) and was statistically significant, the predic- tion models of this variable were useless (Table 4).
Hua et al11compared DXA-BMD and the CBCT-derived density for the mandible and found no correlation. This did not contradict the findings of the current study, as we correlated the output values of both techniques in two different locations of the skeleton. On the other hand, they attributed the absence of correlation to the intensity inho- mogeneity of CBCT images. However, it should be noted that DXA measures only the mineral content (then divides it according to area), whereas CBCT-derived density is measured by calculating the mean of all pixels values (including those corresponding to the bone marrow) in the involved area. Therefore, a comparison of the same object with these two techniques may lead to an absence of a correlation as found by Hua et al.11
Koh and Kim36 found that some CBCT measurements could differentiate between normal and osteoporotic women, but their sample did not include osteopenic women.
Accordingly, it is worth asking whether detecting osteo- porotic women from a group of osteopenic women is possible using the same technique, taking into account the possibility that the difference between these two groups is less than the detection ability of the diagnostic tool.
Table 5.Prediction of osteoporosis in lumbar vertebrae and femoral neck using the simple logistic regression analysis
Area Variable Regression Constant of Model’s Statistical
value (B) the model significance Femoral Neck Mandibular body slice RD in GV of the whole bony area -0.010 8.378
⁄0.001 (P==0.009) (P==0.016)
Lumbar vertebrae Mandibular body slice RD in GV of the whole bony area -0.007 6.303
0.002 (P==0.012) (P==0.021)
Mandibular body slice RD in GV of the Tb area -0.011 3.982
0.006 (P==0.029) (P==0.057)
Mandibular body slice Cortical bone percentage -0.108 4.830
0.012 (P==0.029) (P==0.049)
RD: radiographic density, GV: gray values, Tb: trabecular bone
With respect to the variations of the correlation between panoramic-derived measurements and DXA-BMD, weak,37 medium,38and high39correlations were obtained. This was true for the CBCT and CT-derived measurements as well, where different correlation strengths were obtained.11,40-42 Intraoral radiographs were used to determine the jaw bone density, and the results differed according to the analysis technique.43These disparities seemed to be affected by the analysis procedure rather than the imaging techniques.
DXA is widely available and is the most common clini- cal technique used to diagnose bone fragility;44however, one of the main drawbacks of DXA is that it measures the bone mineral contents rather than the bone microarchitec- ture. The latter is measured clinically by high-resolution CT (hr-CT) and Q-CT45and is much more important in the detection of the etiology of osteoporosis.32 Although it was found that the correlation of mechanical competence (measured by DXA) between different sites in the skeleton is weak,46the use of bone microarchitecture-based tech- niques, such as CBCT, may lead to different conclusions.
In conclusion, femoral neck and lumbar spine osteoporo- sis can be predicted with high accuracy from the RD of the mandibular slice that passes through the lower borders of the mental foramina by using CBCT along with its viewer program.
References
1. NIH Consensus Development Panel on Osteoporosis Preven- tion Diagnosis and Therapy. Osteoporosis prevention, diagno- sis, and therapy. JAMA 2001; 285: 785-95.
2. Riera-Espinoza G. Epidemiology of osteoporosis in Latin America 2008. Salud Publica Mex 2009; 51 Suppl 1: S52-5.
3. Johnell O, Kanis J. Epidemiology of osteoporotic fractures.
Osteoporos Int 2005; 16 Suppl 2: S3-7.
4. Lindsay R, Pack S, Li Z. Longitudinal progression of fracture prevalence through a population of postmenopausal women with osteoporosis. Osteoporos Int 2005; 16: 306-12.
5. Guglielmi G. Preface. Imaging of osteoporosis. Radiol Clin North Am 2010; 48: xv.
6. Nackaerts O, Jacobs R, Devlin H, Pavitt S, Bleyen E, Yan B, et al. Osteoporosis detection using intraoral densitometry.
Dentomaxillofac Radiol 2008; 37: 282-7.
7. Verheij JG, Geraets WG, van der Stelt PF, Horner K, Lindh C, Nicopoulou-Karayianni K, et al. Prediction of osteoporosis with dental radiographs and age. Dentomaxillofac Radiol 2009; 38: 431-7.
8. Roberts M, Yuan J, Graham J, Jacobs R, Devlin H. Changes in mandibular cortical width measurements with age in men and women. Osteoporos Int 2011; 22: 1915-25.
9. White SC, Pharoah MJ. The evolution and application of dental maxillofacial imaging modalities. Dent Clin North Am 2008;
52: 689-705.
10. Mozzo P, Procacci C, Tacconi A, Martini PT, Andreis IA. A new volumetric CT machine for dental imaging based on the cone-beam technique: preliminary results. Eur Radiol 1998;
8: 1558-64.
11. Hua Y, Nackaerts O, Duyck J, Maes F, Jacobs R. Bone quality assessment based on cone beam computed tomography imag- ing. Clin Oral Implants Res 2009; 20: 767-71.
12. Assessment of fracture risk and its application to screening for postmenopausal osteoporosis. Report of a WHO Study Group.
World Health Organ Tech Rep Ser 1994; 843: 1-129.
13. Sennerby L, Andersson P, Pagliani L, Giani C, Moretti G, Molinari M, et al. Evaluation of a novel cone beam computed tomography scanner for bone density examinations in preoper- ative 3D reconstructions and correlation with primary implant stability. Clin Implant Dent Relat Res (in press).
14. Naitoh M, Kurosu Y, Inagaki K, Katsumata A, Noguchi T, Ariji E. Assessment of mandibular buccal and lingual cortical bones in postmenopausal women. Oral Surg Oral Med Oral Pathol Oral Radiol Endod 2007; 104: 545-50.
15. Landis JR, Koch GG. The measurement of observer agreement for categorical data. Biometrics 1977; 33: 159-74.
16. Stone KL, Seeley DG, Lui LY, Cauley JA, Ensrud K, Browner WS, et al. BMD at multiple sites and risk of fracture of multiple types: long-term results from the Study of Osteoporotic Frac- tures. J Bone Miner Res 2003; 18: 1947-54.
17. Kasturi GC, Cifu DX, Adler RA. A review of osteoporosis:
part I. Impact, pathophysiology, diagnosis and unique role of the physiatrist. PM R 2009; 1: 254-60.
18. Genant HK, Engelke K, Prevrhal S. Advanced CT bone imag- ing in osteoporosis Rheumatology (Oxford) 2008; 47 Suppl 4:
iv9-16.
19. Cummings SR, Melton LJ. Epidemiology and outcomes of osteoporotic fractures. Lancet 2002; 359: 1761-7.
20. Kado DM, Browner WS, Palermo L, Nevitt MC, Genant HK, Cummings SR. Vertebral fractures and mortality in older women: a prospective study. Study of Osteoporotic Fractures Research Group. Arch Intern Med 1999; 159: 1215-20.
21. Naitoh M, Katsumata A, Mitsuya S, Kamemoto H, Ariji E.
Measurement of mandibles with microfocus x-ray computer- ized tomography and compact computerized tomography for dental use. Int J Oral Maxillofac Implants 2004; 19: 239-46.
22. Cassetta M, Stefanelli LV, Di Carlo S, Pompa G, Barbato E.
The accuracy of CBCT in measuring jaws bone density. Eur Rev Med Pharmacol Sci 2012; 16: 1425-9.
23. Mah P, Reeves TE, McDavid WD. Deriving Hounsfield units using grey levels in cone beam computed tomography. Den- tomaxillofac Radiol 2010; 39: 323-35.
24. Parsa A, Ibrahim N, Hassan B, Motroni A, van der Stelt P, Wismeijer D. Reliability of voxel gray values in cone beam computed tomography for preoperative implant planning assessment. Int J Oral Maxillofac Implants 2012; 27: 1438-42.
25. Arisan V, Karabuda ZC, Avsever H, Ozdemir T. Conventional multi-slice computed tomography (CT) and cone-beam CT (CBCT) for computer-assisted implant placement. Part I: rela- tionship of radiographic gray density and implant stability. Clin Implant Dent Relat Res 2013; 15: 893-906.
26. Pauwels R, Nackaerts O, Bellaiche N, Stamatakis H, Tsiklakis K, Walker A, et al. Variability of dental cone beam CT grey
values for density estimations. Br J Radiol 2013; 86: 20120135.
27. Reeves TE, Mah P, McDavid WD. Deriving Hounsfield units using grey levels in cone beam CT: a clinical application, Dentomaxillofac Radiol 2012; 41: 500-8.
28. Parsa A, Ibrahim N, Hassan B, van der Stelt P, Wismeijer D.
Bone quality evaluation at dental implant site using multislice CT, micro-CT, and cone beam CT. Clin Oral Implants Res (in press).
29. Nomura Y, Watanabe H, Honda E, Kurabayashi T. Reliability of voxel values from cone-beam computed tomography for dental use in evaluating bone mineral density. Clin Oral Implants Res 2010; 21: 558-62.
30. Buyukkaplan US, Guldag MU, Yildiz M, Gumus BA. Com- parison of mandibular bone mineral density in osteoporotic, osteopenic and normal elderly edentulous subjects measured by the dual-energy X-ray absorptiometry technique. Gerodon- tology 2012; 29: e1098-102.
31. Carballido-Gamio J, Majumdar S. Clinical utility of microar- chitecture measurements of trabecular bone. Curr Osteoporos Rep 2006; 4: 64-70.
32. Genant HK, Delmas PD, Chen P, Jiang Y, Eriksen EF, Dalsky GP, et al. Severity of vertebral fracture reflects deterioration of bone microarchitecture. Osteoporos Int 2007; 18: 69-76.
33. Veigel E, Moore RJ, Zarrinkalam MR, Schulze D, Sauerbier S, Schmelzeisen R, et al. Osteopenia in the maxillofacial area:
a study in sheep. Osteoporos Int 2011; 22: 1115-21.
34. van der Linden JC, Weinans H. Effects of microarchitecture on bone strength. Curr Osteoporos Rep 2007; 5: 56-61.
35. Singh M, Nagrath AR, Maini PS. Changes in trabecular pattern of the upper end of the femur as an index of osteoporosis. J Bone Joint Surg Am 1970; 52: 457-67.
36. Koh KJ, Kim KA. Utility of the computed tomography indices on cone beam computed tomography images in the diagnosis of osteoporosis in women. Imaging Sci Dent 2011; 41: 101-6.
37. Klemetti E, Kolmakov S, Heiskanen P, Vainio P, Lassila V.
Panoramic mandibular index and bone mineral densities in postmenopausal women. Oral Surg Oral Med Oral Pathol 1993;
75: 774-9.
38. Jagelaviciene E, Kubilius R, Krasauskiene A. The relationship between panoramic radiomorphometric indices of the mandible and calcaneus bone mineral density. Medicina (Kaunas) 2010;
46: 95-103.
39. Taguchi A, Tsuda M, Ohtsuka M, Kodama I, Sanada M, Naka- moto T, et al. Use of dental panoramic radiographs in identi- fying younger postmenopausal women with osteoporosis.
Osteoporos Int 2006; 17: 387-94.
40. Marquezan M, Lau TC, Mattos CT, Cunha AC, Nojima LI, Sant’Anna EF, et al. Bone mineral density. Angle Orthod 2012;
82: 62-6.
41. Issever AS, Link TM, Kentenich M, Rogalla P, Burghardt AJ, Kazakia GJ, et al. Assessment of trabecular bone structure using MDCT: comparison of 64- and 320-slice CT using HR- pQCT as the reference standard. Eur Radiol 2010; 20: 458-68.
42. Norton MR, Gamble C. Bone classification: an objective scale of bone density using the computerized tomography scan. Clin Oral Implants Res 2001; 12: 79-84.
43. Nackaerts O, Jacobs R, Horner K, Zhao F, Lindh C, Karayi- anni K, et al. Bone density measurements in intra-oral radio- graphs. Clin Oral Investig 2007; 11: 225-9.
44. Damilakis J, Maris TG, Karantanas AH. An update on the assessment of osteoporosis using radiologic techniques. Eur Radiol 2007; 17: 1591-602.
45. Adams JE. Advances in bone imaging for osteoporosis. Nat Rev Endocrinol 2013; 9: 28-42.
46. Eckstein F, Lochmuller EM, Lill CA, Kuhn V, Schneider E, Delling G, et al. Bone strength at clinically relevant sites displays substantial heterogeneity and is best predicted from site-specific bone densitometry. J Bone Miner Res 2002; 17:
162-71.