645
Copyright © 2014 The Korean Society of Fisheries and Aquatic Science pISSN:0374-8111, eISSN:2287-8815
서 론
우리나라동해연안은조석간만의차가적고파랑의영향을 많이받으며
,
대륙붕이좁고해안선이단조로우며해안선에서 멀어질수록수심이급격히깊어지는특징을보인다.
특히,
본연 구해역은동해남부지역으로북한한류가대륙붕연안을따라 남하하고,
대한해협을통해고온,
고염의대마난류가유입되어 해황의시공간변화가심하게일어나는특징을보이는지역이 다(Park et al., 1991).
우리나라 동해 남부 연안의 어류의 종조성에 대해서는 고 리연안
(Baeck et al., 2010),
영일만(Lee, 1999; Hong et al., 2008),
신월성원자력발전소조간대(Choi et al., 2008),
동해 연안(Yoon et al., 2008),
울산연안(Han et al., 2002)
등에서연 구되었으며,
원자력발전소주변의해양생물에대해서는 플랑크톤과해조류의군집및식생이연구되었다
(Seo et al., 2009;
Kim et al., 2010).
원자력발전소의 수온이 상승한 냉각수가 해양으로 방출되 어발전소주변의수온이높아지고이로인해주변해양환경 에직
·
간접적으로영향을미치며(Crema and Bonvicini Pagliai, 1981; Lardicci et al., 1999),
온배수의유출량과물리적확산범위에따라다양한형태로생태계에영향을미친다
(Gibbons
and Sharits, 1974; Durrett and Pearson, 1975; Warwick, 1993;
Kim et al., 2007; Teixeira et al., 2009).
원자력발전소가주변해역의어류상변화에미치는영향과특 정요인을규명하기는쉽지않다
.
본연구는월성원자력발전소 지역에서서식하는어류의종조성과계절변동을분석하고,
나 아가발전소의주변해역해양환경요인들과의관계를파악하고 자한다.
월성원자력발전소 주변해역에서 저층트롤에 의해 어획된 어류의 종조성
최정화·김정윤 1 *·김진구 1 ·김종빈 2
국립수산과학원 자원관리과, 1부경대학교 자원생물학과, 2남서해수산연구소 아열대수산연구센터
Seasonal Variation of Species Composition of Fish in the Coastal Waters off Wolseong Nuclear Power Plant, East Sea of Korea by Otter Trawl
Survey
Jung Hwa Choi, Jung Yun Kim*, Jin Koo Kim
1
and Jung Bin Kim2
Fisheries Resources Research Division, National Fisheries Research and Development Institute, Busan 619-705, Korea
1
Department of Marine Biology, Pukyong National University, Busan 608-737, Korea
2
Southeastern Sea Fisheries Research Institute, National Fisheries Research and Development Institute, Jeju 556-823, Korea.
We examined seasonal variation in fish species composition in coastal waters near Wolseong Nuclear Power Plant in the East Sea of Korea. A total of 72 species, 39 families, 14 orders, 46,214 individuals, and 4,639,667 g were col- lected. Glyptocephalus stelleri was the most dominant species by number of individuals (35%), followed by Clupea pallasii (26%). Liparis tanakai and Lophius litulon were the dominant species by biomass, accounting for 46% and 28%, respectively. We showed that bottom salinity and temperature are the most important environmental factors influencing fish species composition. Although bottom salinity did not differ statistically among seasons or stations, we detected some variation among stations. Additionally, bottom temperature differed among seasons and stations ( P <0.05), affecting numbers of individuals and biomass. Thus, seasonal variation in fish assemblages can be classi- fied into two groups: spring/summer and autumn/winter.
Key words: Nuclear power plant, Species composition, Fish assemblage
This is an Open Access article distributed under the terms of the Creative Commons Attribution Non-Commercial Licens (http://creativecommons.org/licenses/by-nc/3.0/)which permits unrestricted non-commercial use, distribution, and reproduction in any medium, provided the original work is properly cited.
http://dx.doi.org/10.5657/KFAS.2014.0645 Kor J Fish Aquat Sci 47(5) 645-653, October 2014
Received 19 August 2014; Revised 10 October 2014; Accepted 15 October 2014
*Corresponding author: Tel: +82. 51-720-2284 Fax: +82. 51-720-2277
E-mail address: [email protected]
재료 및 방법
어류표본은월성원자력발전소주변해역에서저인망
(Otter trawl)
을사용하여2006
년부터2008
년까지총3
년동안연4
회, 2
월(
겨울), 5
월(
봄), 8
월(
여름), 11
월(
가을)
에계절별로채집하였다
(Fig. 1).
조사정점은 발전소저질이유사한지역으로발전소취수구주변해역
(
취수구에서3 km
이내지점),
배수구주 변해역(
배수구에서3 km
이내지점),
그리고발전소로부터5-8 km
밖에대조구주변해역을선정하였다.
매채집시기에수온,
염분,
수소이온농도(pH),
용존산소(DO)
를다항목수질측정기(YSI 6600, USA)
로각정점의표층및저층에대하여측정하였다
.
채집에사용된저인망은길이약
29 m,
망목은날개그물과몸통그물이
40.4 mm,
자루그물이20.0 mm
였다.
각정점에서약2 knot/h
의속도로30
분예망하였으며,
예망시그물이약8 m
가벌어져입구면적은8 m
2, 1
회채집면적은약15,000 m
2 였 다.
채집된어류는얼음을채운아이스박스에담아냉장상태로실 험실로운반하여종수준까지동정한후개체수와생체량을측 정하였다
.
생체량은습중량으로1 g
단위까지측정하였다.
출현어류의시기별변동양상을파악하기위하여
,
종다양도지 수(H') (Shannon, 1948)
를월별개체수자료를이용하여산출하였으며
,
각지수의계산식은아래와같다. H'= -∑
si=0[ni N ln( ni N
)]
(n
i: i
번째종의월별출현개체수, N:
해당월에채집된종의개 체수, S:
출현종수)
종간출현양상의유사도는출현한종의개체수값을
Square root
변환후Bray-Curtis similarity
지수를계산하여비가중산술평균
(UPGMA)
방법으로 수상도(Dendrogram)
를 작성하는계보적집괴분석
(Hierarchical cluster analysis)
을이용하였다.
또한
,
출현종의시기별정점별출현개체수자료를PRIMER
V5
를 사용하여 주성분분석(Principal Component Analysis, PCA)
을하였으며구하여진Principal Score
값과월별정점별 해양환경요인과의 상관분석(Correlation Analysis)
을통해종 조성변동의원인을살펴보았다.
결 과
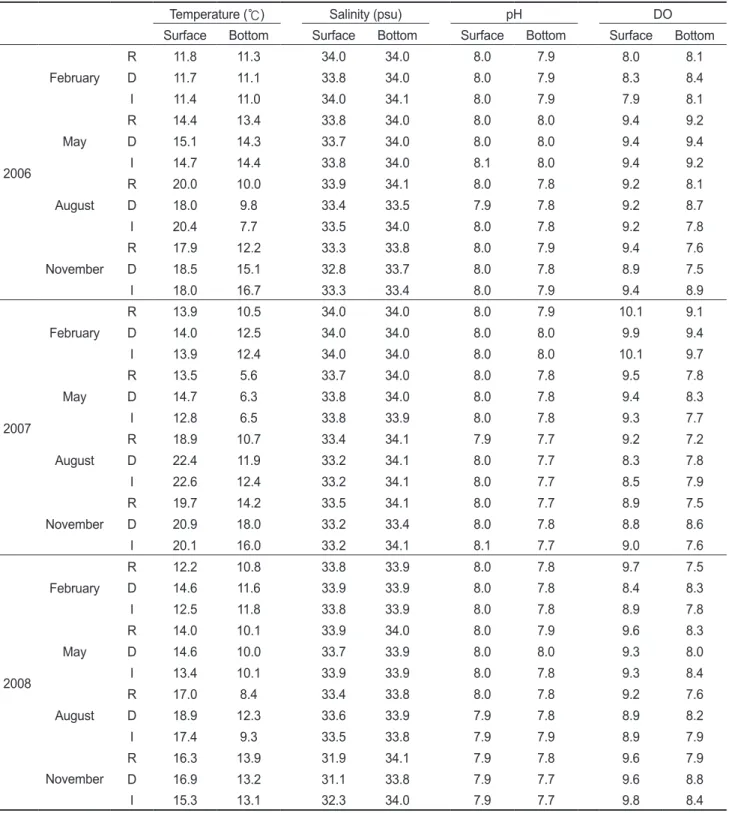
해양 환경
채집시기의정점별수온은대조구주변해역에비해배수구 주변해역과취수구주변해역의수온이높은경향을보였으며
,
표층12.6-20.2℃,
저층9.6-15.4℃
의범위였다(Table 1).
세정 점모두표층에서는8
월수온이가장높았으며, 2
월에가장낮 았다.
저층에서는2
월수온보다5
월수온이더낮았으며11
월 로갈수록점차증가하는경향을보였다.
염분은세정점에서표 층32.4-33.9 psu,
저층33.7-34.0 psu
의범위였으며,
표층에서 는2
월에가장높았고,
계절이바뀔수록점차염분이낮아졌다.
대조구주변해역의저층은월별차이가거의없는반면에취·
배 수구주변해역에서는11
월로갈수록점차염분이낮아졌다.
수 소이온농도(pH)
는7.7-8.0
값으로계절과정점별로차이가없 었으며,
용존산소(DO)
는전계절에서대조구주변해역이취수 구주변해역과배수구주변해역에비해표층에서는높고,
저층 에서는낮았다.
종조성
월성원자력발전소주변해역에서저인망에채집된어류는총
14
목(Order), 39
과(Family), 72
종(Species)
이었다(Table 2).
분 류군별출현종수는농어목(Perciformes)
어류가16
과20
종으 로가장많았으며,
쏨뱅이목(Scorpaeniformes)
은6
과16
종,
가 자미목(Pleuronectiformes)
은2
과9
종,
대구목(Gadiformes)
과 청어목(Clupeiformes)
은2
과4
종,
달고기목(Zeiformes)
과바다 빙어목(Osmeriformes)
이1
과2
종이채집되었으며,
나머지는1
과1
종씩채집되었다.
개체수에서 기름가자미
(Glyptocephalus stelleri)
가 전체 어종의
35.0% (16,153
개체)
를 차지하여 가장 많이 채집되었고
,
다음으로는청어(Clupea pallasii)
가25.6% (11,851
개체)
Fig. 1. Sampling stations of the coastal waters off Wolseong nu-clear power plant.
Principle Component 2
Principle Component 1
-15 -10 -5
Grourp 4
Grourp 3
Grourp 2 Grourp 5
Grourp 1
0 5 10
6 4 2 0 -2 -4 -6 -8 -10
Ref Bonggil-ri D
Korea
Naa-ri
0 3km
I
I D Ref
: Intake : Discharg : Reference
E129°30' E129°35'
N35°40'N35°45'
35°43'30"N 129°30'30"E
35°41'30"N 129°30'30"E
35°42'30"N 129°33'50"E WS NPP
Reference
Number of Species Number of individuals Biomass (g) Diversity index (H’)
Season
1,632,619 g
Feb. 2006 May Aug. Nov . Feb. 2007 May Aug. Nov . Feb. 2008 May Aug. Nov .
2.50 2.00 1.50 1.00 0.50 0.00 600,000 500,000 400,000 300,000 200,000 100,000 5,000 4,000 3,000 2,000 1,000 0 40 30 20 10 0
Discharg Intake Total
로차우점하였다
.
이외에도물메기(Liparis tessellatus),
전갱 이(Trachurus japonicus),
황아귀(Lophius litulon),
용가자미(Hippoglossoides pinetorum)
가각각채집개체수의약5.3%
씩을차지하였다
.
생체량에서는꼼치(Liparis tanakai)
가채집 된어류의45.6% (2,116,296 g)
를차지하였고,
황아귀가27.6%
(1,279,005 g)
로차우점하였다.
이외에도기름가자미와청어가Table 1. Environment factors at the stations of intake (I), discharge (D) and reference (R) in the coastal waters off Wolseong nuclear power plant
Temperature (℃) Salinity (psu) pH DO
Surface Bottom Surface Bottom Surface Bottom Surface Bottom
2006
February
R 11.8 11.3 34.0 34.0 8.0 7.9 8.0 8.1
D 11.7 11.1 33.8 34.0 8.0 7.9 8.3 8.4
I 11.4 11.0 34.0 34.1 8.0 7.9 7.9 8.1
May
R 14.4 13.4 33.8 34.0 8.0 8.0 9.4 9.2
D 15.1 14.3 33.7 34.0 8.0 8.0 9.4 9.4
I 14.7 14.4 33.8 34.0 8.1 8.0 9.4 9.2
August
R 20.0 10.0 33.9 34.1 8.0 7.8 9.2 8.1
D 18.0 9.8 33.4 33.5 7.9 7.8 9.2 8.7
I 20.4 7.7 33.5 34.0 8.0 7.8 9.2 7.8
November
R 17.9 12.2 33.3 33.8 8.0 7.9 9.4 7.6
D 18.5 15.1 32.8 33.7 8.0 7.8 8.9 7.5
I 18.0 16.7 33.3 33.4 8.0 7.9 9.4 8.9
2007
February
R 13.9 10.5 34.0 34.0 8.0 7.9 10.1 9.1
D 14.0 12.5 34.0 34.0 8.0 8.0 9.9 9.4
I 13.9 12.4 34.0 34.0 8.0 8.0 10.1 9.7
May
R 13.5 5.6 33.7 34.0 8.0 7.8 9.5 7.8
D 14.7 6.3 33.8 34.0 8.0 7.8 9.4 8.3
I 12.8 6.5 33.8 33.9 8.0 7.8 9.3 7.7
August
R 18.9 10.7 33.4 34.1 7.9 7.7 9.2 7.2
D 22.4 11.9 33.2 34.1 8.0 7.7 8.3 7.8
I 22.6 12.4 33.2 34.1 8.0 7.7 8.5 7.9
November
R 19.7 14.2 33.5 34.1 8.0 7.7 8.9 7.5
D 20.9 18.0 33.2 33.4 8.0 7.8 8.8 8.6
I 20.1 16.0 33.2 34.1 8.1 7.7 9.0 7.6
2008
February
R 12.2 10.8 33.8 33.9 8.0 7.8 9.7 7.5
D 14.6 11.6 33.9 33.9 8.0 7.8 8.4 8.3
I 12.5 11.8 33.8 33.9 8.0 7.8 8.9 7.8
May
R 14.0 10.1 33.9 34.0 8.0 7.9 9.6 8.3
D 14.6 10.0 33.7 33.9 8.0 8.0 9.3 8.0
I 13.4 10.1 33.9 33.9 8.0 7.8 9.3 8.4
August
R 17.0 8.4 33.4 33.8 8.0 7.8 9.2 7.6
D 18.9 12.3 33.6 33.9 7.9 7.8 8.9 8.2
I 17.4 9.3 33.5 33.8 7.9 7.9 8.9 7.9
November
R 16.3 13.9 31.9 34.1 7.9 7.8 9.6 7.9
D 16.9 13.2 31.1 33.8 7.9 7.7 9.6 8.8
I 15.3 13.1 32.3 34.0 7.9 7.7 9.8 8.4
Table 2. Species composition of fish collected by an otter trawl in the coastal waters of f W olseong nuclear power plant. N and W represent the number of individuals and biomass (g) of annual fish catch, respectively (/ca. 15,000 m
2), and the cross mark (+) represents the value less than 0.1% 2006 2007 2008 Total Scientific name N W %N %W N W %N %W N W %N %W N W %N %W Glyptocephalus stelleri 4,181 84,221 27.8 8.9 2,706 38,685 20.9 3.2 9,266 269,146 50.7 10.8 16,153 392,052 35.0 8.5 Clupea pallasii 1,818 64,624 12.1 6.8 6,042 213,705 46.7 17.8 3,991 74,514 21.9 3.0 11,851 352,843 25.6 7.6 Liparis tessellatus 963 72,486 6.4 7.6 1,247 30,342 9.6 2.5 250 13,414 1.4 0.5 2,460 116,242 5.3 2.5 Trachurus japonicus 2,370 15,768 15.8 1.7 31 242 0.2 + 13 266 + + 2,414 16,276 5.2 0.4 Lophius litulon 748 344,483 5.0 36.3 1,164 758,802 9.0 63.3 371 175,720 2.0 7.0 2,283 1,279,005 4.9 27.6 Hippoglossoides pinetorum 1,344 70,815 8.9 7.5 436 37,565 3.4 3.1 300 29,559 1.6 1.2 2,080 137,939 4.5 3.0 Liparis tanakai 666 171,985 4.4 18.1 53 72,010 0.4 6.0 1,174 1,872,301 6.4 75.1 1,893 2,1 16,296 4.1 45.6 Apogon lineatus 320 1,71 1 2.1 0.2 149 697 1.1 + 1,199 4,464 6.6 0.2 1,668 6,872 3.6 0.1 Arctoscopus japonicus 968 28,437 6.4 3.0 11 3 4,853 0.9 0.4 1,081 33,290 2.3 0.7 Gadus macrocephalus 409 9,942 2.7 1.0 220 3,458 1.7 0.3 444 3,387 2.4 0.1 1,073 16,787 2.3 0.4 Coleorhynchus multispinu - losus 40 314 0.3 + 203 3,878 1.6 0.3 545 8,942 3.0 0.4 788 13,134 1.7 0.3 Engraulis japonicus 307 2,509 2.0 0.3 57 798 0.4 + 69 445 0.4 + 433 3,752 0.9 0.1 Psenopsis anomala 304 9,158 2.0 1.0 5 390 + + 35 1,558 0.2 + 344 11,106 0.7 0.2 Acropoma japonicum 20 51 0.1 + 242 1,866 1.3 + 262 1,917 0.6 + Malakichthys wakiyae 243 3,002 1.9 0.3 2 46 + + 245 3,048 0.5 0.1 Pleuronectes yokohamae 141 41,896 0.9 4.4 46 14,057 0.4 1.2 28 7,608 0.2 0.3 215 63,561 0.5 1.4 Trichiurus lepturus 8 79 + + 72 6,269 0.6 0.5 98 7,402 0.5 0.3 178 13,750 0.4 0.3 Konosirus punctatus 89 7,546 0.6 0.8 6 828 + + 95 8,374 0.2 0.2 Chelidonichthys spinosus 12 2,404 + 0.3 16 2,432 0.1 0.2 51 8,068 0.3 0.3 79 12,904 0.2 0.3 Decapterus maruadsi 69 782 0.5 + 69 782 0.1 + Coilia nasus 12 328 + + 27 1,285 0.2 0.1 25 1,194 0.1 + 64 2,807 0.1 0.1 Larimichthys polyactis 61 2,387 0.4 0.3 3 181 + + 64 2,568 0.1 0.1 Hemitripterus villosus 12 85 + + 43 2,963 0.2 0.1 55 3,048 0.1 0.1 Coleorhyncus japonicus 46 1,386 0.4 0.1 1 43 + + 47 1,429 0.1 + Conger myriaster 28 4,290 0.2 0.5 5 824 + + 14 1,617 + + 47 6,731 0.1 0.1 Helicolenus hilgendorfi 8 446 + + 5 390 + + 20 914 0.1 + 33 1,750 0.1 + Callionymidae sp. 28 391 0.2 + 28 391 0.1 + Hexagrammos otakii 24 5,546 0.2 0.6 1 883 + + 25 6,429 0.1 0.1 Sphyraena pinguis 16 1,101 0.1 0.1 16 1,101 + + Stephanolepis cirrhifer 16 264 0.1 + 16 264 + + Repomucenus lunatus 13 753 + + 13 753 + + Sillago sihama 9 336 + + 9 336 + + Synagrops philippinensis 4 13 + + 4 34 + + 8 47 + + Alcichthys elongatus 7 1,935 + + 7 1,935 + +
Scomberomorus niphonius 4 2,625 + 0.3 3 686 + + 7 3,31 1 + 0.1 Clidoderma asperrimum 5 98 + + 2 389 + + 7 487 + + Hypodytes rubripinnis 4 15 + + 1 4 + + 1 3 + + 6 22 + + Xenocephalus elongatus 4 73 + + 1 26 + + 1 3 + + 6 102 + + Doederleinia berycoides 4 139 + + 1 25 + + 5 164 + + Pampus echinogaster 1 243 + + 4 506 + + 5 749 + + Coleorhyncus longissimus 5 75 + + 5 75 + + Maurolicus muelleri 5 3 + + 5 3 + + Synagrops japonicus 5 80 + + 5 80 + + Cynoglossus robustus 4 154 + + 4 154 + + Bathycallionymus kaianus 4 41 + + 4 41 + + Parascolopsis inermis 4 259 + + 4 259 + + Callanthias japonicus 4 11 9 + + 4 11 9 + + Collichthys niveatus 4 109 + + 4 109 + + Gymnocanthus herzensteini 4 213 + + 4 213 + + Zenopsis nebulosa 3 850 + + 1 250 + + 4 1,100 + + Johnius grypotus 4 69 + + 4 69 + + Sebastes thompsoni 4 749 + + 4 749 + + Sebastiscus albofasciatus 4 81 + + 4 81 + + Squalus acanthias 3 147 + + 3 147 + + Zoarces gilli 3 274 + + 3 274 + + Tanakius kitaharai 2 65 + + 2 65 + + Zeus faber 2 17 + + 2 17 + + Eopsetta grigorjewi 2 11 9 + + 2 11 9 + + Pholis nebulosa 2 111 + + 2 111 + + Argentina kagoshimae 1 13 + + 1 13 + + Neobythites sivicolus 1 9 + + 1 9 + + Pleuronichthys cornutus 1 87 + + 1 87 + + Saurida undosquamis 1 24 + + 1 24 + + Pampus argenteus 1 491 + + 1 491 + + Scorpaena neglecta 1 71 + + 1 71 + + Glossanodon semifasciatus 1 14 + + 1 14 + + Inimicus japonicus 1 311 + + 1 311 + + Cottiusculus schmidti 1 10 + + 1 10 + + Leiognathus nuchalis 1 24 + + 1 24 + + Microstomus achne 1 376 + + 1 376 + + Cottidae sp. 1 82 + + 1 82 + + Lepidotrigla hime 1 16 + + 1 16 + + Total 15,030 948,376 100.0 100.0 12,925 1,197,572 100.0 100.0 18,259 2,493,719 100.0 100.0 46,214 4,639,667 100.0 100.0
최정화
ㆍ
김정윤ㆍ
김진구ㆍ
김종빈650
채집된어종생체량의각각
8.5%
와7.6%,
용가자미와물메기는각각
3.0%
를차지하였다. 종조성 변동
연도별로는
2006
년41
종, 2007
년40
종, 2008
년47
종이채집 되었으며, 2006
년과2008
년에는기름가자미가, 2007
년에는청 어가가장많이채집되었다.
정점별로는대조구주변해역47
종,
취수구주변해역50
종,
배수구주변해역49
종이채집되었으며,
대조구주변해역과배수구주변해역에서는기름가자미가,
취 수구주변해역에서는청어가우점적으로채집되었다.
월별출현종수는
2006
년2
월에11
종으로가장적었고, 2008
년2
월에는30
종으로가장많았으나시기별로변동양상은뚜 렷하지않았다(Fig. 2).
개체수에서는
2008
년8
월에317
개체로가장적은개체가채 집되었고, 2008
년5
월에는11,358
개체로가장많은개체가채 집되었다.
채집개체수의시기별증감은기름가자미와청어의 출현양상과매우밀접하였다.
정점별개체수의변동은유사하 였지만배수구주변해역에서특히채집량이많았다.
생체량에서는
2008
년8
월에8,584 g
으로낮았고, 2008
년11
월에는1,914,726 g
으로가장높았다.
시기별증감의형태는정점마다차이를보였는데
, 2007
년11
월의배수구주변해역과2008
년11
월의취수구주변해역에서는각각개체무게가큰황 아귀와꼼치가많이잡혀생체량이높았다.
종다양도지수
(H′, Diversity index)
는0.52 (2008
년11
월)- 1.77 (2008
년2
월)
의범위였다.
매년11
월낮은값을보였는데,
특히2008
년에는청어가3,422
개체로전체어종의약88%,
꼼 치가약8%
를차지하여종다양도지수값이 다른시기에비해 낮았다.
정점별로는대조구주변해역에서0.16-1.80,
배수구주 변해역에서0.77-1.86,
취수구주변해역에서는0.75-2.00
의분 포값을보였다.
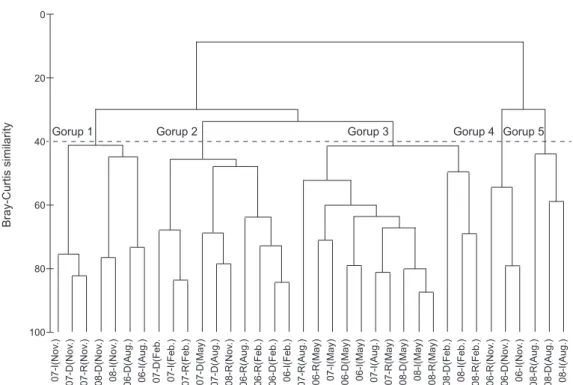
군집분석
채집된전체우점종의개체수값을이용하여시기와정점에 따른출현양상을군집분석한결과
, 40%
의유사도에서5
개의 그룹으로구분되었다(Fig. 3).
그룹1
은꼼치,
줄비늘치(Coleo- rhynchus multispinulosus),
청어,
황아귀가공통적으로출현했 고,
그룹2
는청어와황아귀가집중적으로출현하였으며,
그룹3
은기름가자미,
물메기,
용가자미,
청어,
황아귀가공통적으로 출현하였다.
그룹4
는멸치(Engraulis japonicus),
샛돔(Psenop- sis anomala),
전갱이가공통적으로출현하는그룹이며,
그룹5
는반딧불게르치(Acropoma japonicum)
와샛돔이공통적으로 출현하며반딧불게르치가우점하는그룹이었다.
조사시기와 정점들간어류종조성의 차이를살펴보기 위하 여주성분분석수행한결과총
23
개의성분으로분리되었다.
전체변동의누적50%
까지기여하는상위성분을분석한결 과, PC 1-5
까지의고유값(Eigen values)
은5.0
이상이었고,
변화율의대소차가
4.6%
로모든성분이비슷하게종조성변동에기여하였다
(Table 3).
어류의종조성변동에가장많은영향을 미치는해양환경요인을알아보기위해주성분분석을수행한결과
(Table 4), PC 1
은저층염분에유의한차이가있었으며(P<0.05), PC 2
는저층수온에유의한차이가있었다(P<0.05).
이외에도
PC 3
은유의한해양환경요인이없었고, PC 4
는저층 염분, PC 5
는표층수온에유의한결과를보였다(P<0.05).
종조성에가장영향을미치는상위두개의주성분의분석결과
(Fig.
4), PC 1
과PC 2
는각각저층염분과저층수온으로군집분석의5
개의그룹으로나타냈다. PC 1
의(-)
값은염분이낮았던시기Fig. 2. Seasonal variations in number of species, number of indi- viduals, biomass (g), and diversity index of fish collected by an otter trawl in the coastal waters off Wolseong nuclear power plant.
Principle Component 2
Principle Component 1
-15 -10 -5
Grourp 4
Grourp 3
Grourp 2 Grourp 5
Grourp 1
0 5 10
6 4 2 0 -2 -4 -6 -8 -10
Ref Bonggil-ri D
Naa-ri
0 3km
I
I D Ref
: Intake : Discharg : Reference
E129°30' E129°35'
N35°40'N35°45'
35°43'30"N 129°30'30"E
35°41'30"N 129°30'30"E
35°42'30"N 129°33'50"E WS NPP
Reference
Number of Species Number of individuals Biomass (g) Diversity index (H’)
Season
1,632,619 g
Feb. 2006 May Aug. Nov . Feb. 2007 May Aug. Nov . Feb. 2008 May Aug. Nov .
2.50 2.00 1.50 1.00 0.50 0.00 600,000 500,000 400,000 300,000 200,000 100,000 5,000 4,000 3,000 2,000 1,000 0 40 30 20 10 0
Discharg Intake Total
로
, 2006
년11
월모든정점이속하였으며그룹4
에속하는어종 들이공통적으로출현하였으나대부분의그룹이(+)
에속하는 것으로나타났다. PC 2
는수온이낮았던11
월, 2
월의가을,
겨울 그룹과5
월, 8
월의봄,
여름그룹으로분리되었다.
고 찰
저인망을이용한본연구에서채집된어류는총
72
종이었으 며전갱이,
청어,
전어(Konosirus punctatus),
멸치와같이일부 부어류를제외하고대부분이저어류(Benthic fish)
였다.
저인망은저어류가주로채집되는어구로알려져있지만일시적으로 유집되는청어
,
멸치등부어류도일부채집되는것으로알려 져 있다(Lee 1991, 1999).
영일만에서저인망을 이용한연구 에서는총59
종의어류가채집되었으며,
돛양태(Repomucenus lunatus),
두줄망둑(Tridentiger trigonocephalus),
춤양태(Re- pomucenus huguenini),
까나리(Ammodytes personatus),
청보 리멸(Sillago japonica)
등의소형저어류가주로채집되어본연 구와는종조성에서차이를보였다(Lee, 1999).
이는본연구해 역이외해와연결되어있고,
수심이깊은서식환경특성에기인 한것으로판단된다.
또한울진과후포연안에서는각각20
종,
Fig. 3. Dendrogram of hierarchical clustering on fish assemblage for seasonal sampling in the coastal waters off Wolseong nuclear power plant (I: intake, D: discharge, R: reference).Bray-Curtis similarity
Gorup 1 Gorup 2 Gorup 3 Gorup 4 Gorup 5
0
20
40
60
07-I(Nov .) 07-D(Nov .) 07-R(Nov .) 08-D(Nov .) 08-I(Nov .) 06-D(Aug.) 06-I(Aug.) 07-D(Feb. 07-I(Feb.) 07-R(Feb.) 07-D(May) 07-D(Aug.) 08-R(Nov .) 06-R(Aug.) 06-R(Feb.) 06-D(Feb.) 06-I(Feb.) 07-R(Aug.) 06-R(May) 07-I(May) 06-D(May) 06-I(May) 07-I(Aug.) 07-R(May) 08-D(May) 08-I(May) 08-R(May) 08-D(Feb.) 08-I(Feb.) 08-R(Feb.) 06-R(Nov .) 06-D(Nov .) 06-I(Nov .) 08-R(Aug.) 08-D(Aug.) 08-I(Aug.) 80
100
Table 3. Eigen value, variance and cumulative variance of the prin- ciple components
PC Eigen Variance (%) Cum. Variance (%)
1 8.61 12.0 12.0
2 6.73 9.3 21.3
3 5.86 8.1 29.4
4 5.40 7.5 36.9
5 5.30 7.4 44.3
6 4.58 6.4 50.7
7 4.46 6.2 56.9
8 4.07 5.7 62.5
9 3.78 5.3 67.8
10 2.73 3.8 71.6
Table 4. Correlation coefficients between principle component (PC) scores and environment factors. The mark (*) denoted sig- nificant level at P<0.05
Environmental factor PC1 PC2 PC3 PC4 PC5 Suarface Temperature -0.100 -0.200 0.205 -0.176 0.392*
Bottom Temperature -0.272 -0.411* 0.257 0.004 0.231 Suarface Salinity 0.141 0.039 -0.123 0.100 -0.184 Bottom Salinity 0.524* 0.182 -0.014 0.461* 0.048 Suarface pH -0.012 -0.308 0.039 0.094 0.114 Bottom pH -0.142 0.168 -0.140 0.018 -0.082 Suarface DO -0.072 0.086 -0.201 0.137 -0.042 Bottom DO -0.082 0.168 -0.278 -0.028 0.273
최정화
ㆍ
김정윤ㆍ
김진구ㆍ
김종빈652
23
종이출현하였으며,
물메기,
기름가자미,
용가자미가우점하 는것으로나타났는데(Lee, 2011),
본연구보다출현한어종이 적었지만우점종이저어류라는점은동일하였다.
우점적으로출현한기름가자미는동해전연안에서자망
,
연 승,
저층트롤등으로주로어획되고있으며,
분포밀도또한높 은것으로알려져있다.
동해북부해역(
고성아야진,
수심: 300- 450 m)
과중부해역(
울진후포,
수심: 110-130 m)
에서우점적으 로출현하고,
부산과강릉사이의연안해구들과강원도동부심 해(200-1,000 m)
에서도출현하는것으로알려져있다(Park et al., 2007, Yoon et al., 2008; Choi et al., 2012).
본연구에서는5
월에가장많은출현개체수를보였는데,
이는산란기인3-5
월 에연안으로이동한기름가자미의생태적특성에의한것으로 보이며(Kim et al., 2005; Cha et al., 2008), 11
월의낮은출현(4
개체)
양상은연안에서외해로이동했기때문에거의어획되지 않은것에기인한것으로판단된다(Park et al., 2007).
한편
, 1,000
개체이상채집된10
개어종중 도루묵의경우, 94%
이상이2006
년5
월에어획되었다.
도루묵은서식수온이2-13℃,
산란수온이6-10.5℃
로낮은수온에서서식하는종으로알려져있으며
(Kim et al., 2005),
가을철에산란을위해강원 도연안으로회유하는어종으로보고되었다(Yang et al., 2012).
본연구에서는봄에높은출현개체수를보였으나
,
여름과가을 에는출현하지않는것으로나타나월성에서서식하는개체들 이수온의상승과함께산란을위해북상한것으로판단된다.
또 한,
매년월성에서출현하는도루묵출현량이급격히줄어드는결과를보였는데
, 2006
년이후해양환경의변화에따라도루묵의어장이연도별로점차북상하여대부분강원도연안에서형 성되었기때문인것으로생각된다
(Yang et al., 2012).
본연구결과에서월성주변해역의어류종조성에가장많은영 향을미치는해양환경요인은저층염분과저층수온이었다
.
저층염분은계절별정점별로뚜렷한차이를보이지않았으며
,
염 분변화에직접적인영향을미칠수있는지형요인이없는것 으로알려져있어간접적으로어류의종조성에영향을미쳤을 것으로판단된다(Choi et al., 2008).
저층수온은시기별,
정점 별뚜렷한변동양상을보였으며채집개체수와생체량에서통 계적으로유의한차이가있었다(P<0.05). Kim et al. (2010)
은 월성원자력발전소주변해역에서식하는동물플랑크톤의분포 와군집구조역시계절적수온에영향을받았으며배수구주변 해역에서는출현종수및개체수와수온사이에상관관계가존 재하는것으로나타난다고보고하였으나,
온배수영향보다기 타해양환경요인(
영양염,
먹이원등)
이영향을미칠것이라고 보고되었다.
본연구해역인월성연안에서의저인망에채집된어류군집구 조는봄
(5
월),
여름(8
월)
과가을(11
월),
겨울(2
월)
의두그룹으 로구분되어계절적인요인보다는PC 2
인저층수온의영향을 많이받는것으로나타났다.
연구해역보다남쪽에위치한영일 만또한어류군집구조의변화가여름(8
월),
가을(11
월)
과겨 울(2
월),
봄(5
월)
으로계절적인구조는다르나PC 2
인저층수 온에의해이루어지는것으로나타나저층수온이동해안저어 류군집구조를결정짓는중요한요인인것으로판단된다(Lee et al., 2012).
사 사
본연구는국립수산과학원
(RP-2013-FR-099)
에의해수행되 었습니다.
References
Baeck GW, Huh SH, Park SC, Kim JH and Park JM. 2010. Sea- sonal variation in species composition and abundance of fish assemblages collected by a three-side fyke net in the coastal waters off Gori. Kor J Ichthy 22, 186-194.
Cha HK, Kwon HC, Lee SI, Yang JH, Chang DS and Chun YY.
2008. Maturity and spawning of Korean flounder Glypto-
cephalus stelleri (Schmidt) in the East Sea of Korea. Kor J
Ichthy 20, 263-271.Choi KH, Han MH, Kang CK, Park JM, Choi JH, Park JH, Sohn MH Baeck GW, Choy EJ and Lee CI. 2012. Seasonal varia- tions in species composition of fish assemblage collected by trammel net in coastal waters of the East Sea. Bull Kor Soc Fish Tech 48, 415-427.
Choi Y, Lee HH and Jang JH. 2008. Ichthyofauna of the Intertid- al Zone around the Nuclear Power Plants off Sinweolseong, Eastern Coast, Kor J Ichthy 20, 313-317.
Crema, R and Bonvicini Pagliai AM. 1981. The structure of benthic communities in an area of thermal discharge from a coastal power station. Mar Pollut Bull 11, 221-224.
Durrett, CW and Pearson WD. 1975. Drift of macroinver- Fig. 4. Principle component analysis of fish assemblage for sea-
sonal sampling in the coastal waters off Wolseong nuclear power plant (I: intake, D: discharge, R: reference).
Principle Component 2
Principle Component 1
-15 -10 -5
Grourp 4
Grourp 3
Grourp 2 Grourp 5
Grourp 1
0 5 10
6 4 2 0 -2 -4 -6 -8 -10
Ref Bonggil-ri D
Naa-ri
0 3km
I
I D Ref
: Intake : Discharg : Reference
E129°30' E129°35'
N35°40'N35°45'
35°43'30"N 129°30'30"E
35°41'30"N 129°30'30"E
35°42'30"N 129°33'50"E WS NPP
Reference
Number of Species Number of individuals Biomass (g) Diversity index (H’)
Season
1,632,619 g
Feb. 2006 May Aug. Nov . Feb. 2007 May Aug. Nov . Feb. 2008 May Aug. Nov .
2.50 2.00 1.50 1.00 0.50 0.00 600,000 500,000 400,000 300,000 200,000 100,000 5,000 4,000 3,000 2,000 1,000 0 40 30 20 10 0
Discharg Intake Total
tebrates in a channel carrying heated water from a power plant. Hydrobiologia 46, 33-43.
Gibbons, JW and Sharits RR. 1974. Thermal ecology. U.S.
Atomic Energy Commission, Springfield, Virginia, 670pp.
Han KH, Kim JH and Baek SR. 2002. Seasonal variation of species composition of fishes collected by set net in coastal waters of Ulsan, Korea. Kor J Ichthy 14, 61-69.
Hong BK, Kim JK, Park KD, Jeon KA, Chun YY, Hwang KS, Kim YS and Park KY. 2008. Species composition of fish collected in gill nets from Youngil Bay, East Sea of Korea.
Kor J Fish Aquat Sci 41, 353-362.
Kim IS, Choi Y, Lee CL, Lee YJ, Kim BJ and Kim JH. 2005.
Illustrated book of Korean fishes. Kyohaksa, Seoul, 613pp.
Kim MH, Moon HT, Shin SH, Shon MB, Byun JY, Choi HC and Son MH. 2010. Characteristics of zooplankton commu- nity in the coastal waters of Wolseong Nuclear Power Plant, East Sea of Korea. Kor J Environ Biol 28, 40-48.
Kim YH, Ahn JK, Yoon HD and Jang MA. 2007. Effects of heated effluents on the intertidal macroalgal community near Gori Nuclear Power Plant. Algae 22, 297-304.
Lardicci, C, Rossi F and Maltagliati F. 1999. Detection of ther- mal pollution: Variability of benthic communities at two dif- ferent spatial scales in an area influenced by a coastal power station. Mar Pollut Bull 38, 293-303.
Lee JB, Shin YJ, Lee SJ, Lee JH, Choi YM, Lee DW, Kim SW and Yang JH. 2012. Seasonal variations of fisheries resourc- es composition in the coastal ecosystem of the Yongil Bay, Korea. J Environ Sci Inter 21, 1275-1285.
Lee TW. 1991. The demersal fishes of Asan Bay I. optimal sam- ple size. Kor J Fish Aquat Sci 24, 248-254.
Lee TW. 1999. Seasonal variation in species composition of de- mersal fish in Yongil Bay, East Coast of Korea. Kor J Fish Aquat Sci 32, 512-519
Lee TW. 2011. Seasonal variation in species composition of de- mersal fish in the coastal water off Uljin and Hupo in the East Sea of Korea in 2002. Kor J Ichthy 23, 187-197.
Park HH, Jeong EC, Bae BS, Yang YS, Hwang SJ, Park JH, im YS, Lee SI and Choi SH. 2007. Fishing investigation and species composition of the catches caught by a bottom trawl in the deep East Sea. Bull Kor Soc Fish Tech 44, 183-191.
Park JS, Lee SS, Kang YS and Huh SH. 1991. Distribution of in- dicator species of copepods and chaetognaths in the middle East Sea of Korea and their relationships to the characteris- tics of water masses. Kor J Fish Aquat Sci 24, 203-213.
Seo IS, Moon HT, Choi BM, Kim MH, Kim DI, Yun JS, Byun JY, Choi HC and Son MH. 2009. Community structure of macrobenthic assemblages around the Wolseong Nuclear Plant, East Sea of Korea. Kor J Environ Eco 27, 341-352.
Shannon, CE. 1948. The mathematical theory of communica- tion. Bell System Technical Journal 27, 379-423.
Teixeira, TP, Neves LM and Araujo FG. 2009. Effects of a nu- clear power plant thermal discharge on habitat complexity
and fish community structure in Ilha Grande Bay, Brazil.
Mar Environ Res 68, 188-195.
Warwick, RM. 1993. Environmental impact studies on marine communities: Pragmatical consideration. Aus J Ecol 18, 63- Yang JH, Lee SI, Park KY, Yoon SC, Kim JB, Chun YY, Kim 80.
SW and Lee JB. 2012. Migraton and distribution changes of the sandfish, Arctoscopus japonicus in the East Sea. Bull Kor Soc Fish Tech 48, 401-414.
Yoon SC, Cha HK, Lee SI, Chang DS, Hwang SJ and Yang JH.
2008. Variation in species composition of demersal organ- isms caught by trawl survey in the East Sea. Bull Kor Soc Fish Tech 44, 323-344.