1
ACCOUNTING FOR IMPORTANCE OF VARIABLES IN MULTI- SENSOR DATA FUSION USING RANDOM FORESTS
No-Wook Park and Kwang-Hoon Chi
Geoscience Information Center, Korea Institute of Geoscience and Mineral Resources 30 Gajeong-dong, Yuseong-gu, Daejeon 305-350, Korea
[email protected]
ABSTRACT:
To account for the importance of variable in multi-sensor data fusion, random forests are applied to supervised land- cover classification. The random forests approach is a non-parametric ensemble classifier based on CART-like trees. Its distinguished feature is that the importance of variable can be estimated by randomly permuting the variable of interest in all the out-of-bag samples for each classifier. Supervised classification with a multi-sensor remote sensing data set including optical and polarimetric SAR data was carried out to illustrate the applicability of random forests. From the experimental result, the random forests approach could extract important variables or bands for land-cover discrimination and showed good performance, as compared with other non-parametric data fusion algorithms.
KEY WORDS: Random Forests, Data Fusion, Classification, Importance of Variable
1.
INTRODUCTION
Nowadays, multi-sensor data fusion in remote sensing communities has been gaining increased interests. In remote sensing data analysis, images acquired over the same site by different sensors are, in general, partially redundant or complementary, since they have different characteristics and physical interaction mechanisms are different. Fusion with redundant data can help reduce imprecision and fusion with complementary data can provide a more complete description. Unlike the situation where single sensor data are only dealt with, however, one of the most serious problems faced in multi-sensor data fusion is the information content and relative reliability of each sensor. Since data come from various sensors, the data inevitably have varying degrees of reliabilities for a target and it may be impossible to maintain a consistent level of detail.
To account for relative reliability or importance, this paper applies random forests to multi-sensor data fusion for land-cover classification. The random forests approach is one of ensemble methods and a non- parametric approach and thus, it can be effectively applied to multi-sensor data fusion. By randomly deleting the information contained in a certain variable in the out- -of-bag samples for each classifier, especially, the importance of variable can be computed (Gislason et al., 2003). The potentiality of the methods was evaluated from the case study of land-cover classification with multi-sensor data.
2.
RANDOM FORESTS
Random forests are the general term of an ensemble method for classification and regression and are a combination of tree-structured classifiers such that each tree depends on the values of a random vector sampled independently and with the same distribution for all trees in the forest (Breiman, 2001). Random forests can be categorized into two types: one is a classification and regression tree (CART)-like trees type (Breiman, 2001) and the other is a binary hierarchy classifier (Ham et al., 2005). The main difference of those two lies in the splitting manner on each node. The splitting manner of the CART-like trees approach is based on variables or features. Meanwhile, in the binary hierarchy classifier, a split on each node is based on classes or labels. In this paper, the random forests approach based on CART-like trees will be only dealt with.
For the purpose of classification, the random forests grow each tree on an independent bootstrap sample from the training data. At each node, first, m variables out of all M possible variables (independently for each node) are randomly selected. Then the best split on the selected m variables will be found. After that, the tree is grown to maximum depth and a large number of trees vote for the most popular class and the majority class will be a final output. Especially, to improve accuracy, the randomness injected has to minimize the correlation while maintaining strength. The forests considered consist of using randomly selected inputs or combinations of inputs at each node to grow each tree. The resulting forests give accuracy that compare favourably with Adaboost (Breiman, 2001; Gislason et al., 2003; Joelsson et al., 2005).
Main advantage of the random forests approach is that
it can provide several analytical results by using out-of-
bag samples. The out-of-bag-samples mean the remaining
2
samples that are not selected as the bootstrap ones. They
can serve as a test set for the tree grown on the bootstrap samples. Especially, variable importance can be computed by using the out-of-bag samples. The computation procedure is as follows: First, a tree is used to predict the class of each out-of-bag sample. Then, the values of the variable of interest will be randomly permuted in all the out-of-bag samples and the tree is used to predict the class for these perturbed out-of-bag samples. The variable importance is the increase in the misclassification or error rate between those two steps. It means that by randomly deleting or destroying a certain variable from the whole variables in the out-of-bag samples for each classifier, the increase in the out-of-bag error indicates that the variable deleted is important, since it removal results in the increase of error rate. The importance of a certain variable is averaged over all trees in the forest.
3.
EXPERIMENT
The multi-sensor data set used in the experiment for supervised land-cover classification was provided by the IEEE GRSS Data Fusion Committee (http://www.dfc- grss.org). It includes airborne Thematic Mapper Scanner data with 6 channels and NASA JPL AirSAR data with 9 channels in the C-, L- and P-bands and HH, HV and VV polarizations. Five land-cover classes in an agricultural area are considered: (1) Sugar beets, (2) Stubble, (3) Bare soil, (4) Potatoes, (5) Carrots. In this experiment, the random forest approach was implemented by using a Fortran program provided by Leo Breiman and Adele Cutler (http://oz.berkeley.edu/users/breiman/RandForests/
). For the random forests, the number of random splits was set to 4 and the trees in the forest were grown to 50.
0 0.0005 0.001 0.0015 0.002 0.0025 0.003 0.0035 0.004 0.0045
ATM 1
ATM 2
ATM 3
ATM 4
ATM 5
ATM 6
Chh Chv
Cvv Lhh
Lhv Lvv
Phh Phv
Pvv Variable
Average increased OOB error
Figure 1. Results of importance of variable computation.
The importance of variable is shown in Figure 1. If the average increased out-of-bag error value is large, the variable can be considered more important. As expected, infrared bands, ATM4, ATM5 and ATM6, are the most important variables. In addition, L-band data, HV, VV, HH, showed relatively higher values than other C- and P- band SAR data. This outcome resulted in the penetrating depth related to wavelength of the SAR sensor. It means that L-band has the proper amount of penetration power
and can reveal better discrimination capability of scattering characteristics between crop classes.
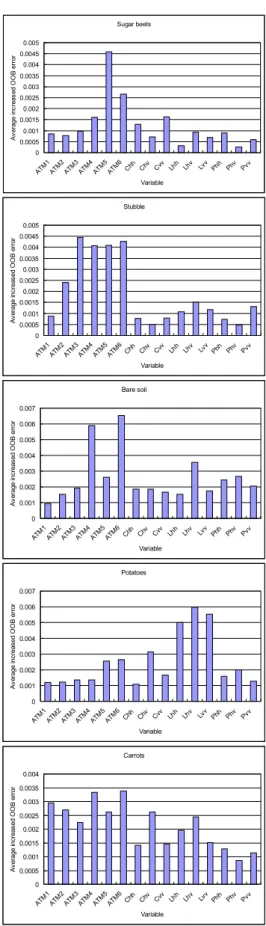
Furthermore, the importance of variable for each land- cover class was also computed and is shown in Figure 2.
Sugar beets
0 0.0005 0.001 0.0015 0.002 0.0025 0.003 0.0035 0.004 0.0045 0.005
ATM 1
ATM 2
ATM 3
ATM 4
ATM 5
ATM 6
Chh Chv
Cvv Lhh Lhv
Lvv Phh Phv Pvv Variable
Average increased OOB error
Stubble
0 0.0005 0.001 0.0015 0.002 0.0025 0.003 0.0035 0.004 0.0045 0.005
ATM 1
ATM 2
ATM 3
ATM 4
ATM 5
ATM 6
Chh Chv
Cvv Lhh
Lhv Lvv
Phh Phv Pvv Variable
Average increased OOB error
Bare soil
0 0.001 0.002 0.003 0.004 0.005 0.006 0.007
ATM 1
ATM 2
ATM 3
ATM 4
ATM 5
ATM 6Chh
Chv Cvv
Lhh Lhv
Lvv Phh Phv Pvv Variable
Average increased OOB error
Potatoes
0 0.001 0.002 0.003 0.004 0.005 0.006 0.007
ATM 1
ATM 2
ATM 3
ATM 4
ATM 5
ATM 6
Chh Chv
Cvv Lhh
Lhv Lvv
Phh Phv Pvv Variable
Average increased OOB error
Carrots
0 0.0005 0.001 0.0015 0.002 0.0025 0.003 0.0035 0.004
ATM 1
ATM 2
ATM 3
ATM 4
ATM 5
ATM 6
Chh Chv
Cvv Lhh
Lhv Lvv Phh Phv Pvv Variable
Average increased OOB error
Figure 2. Results of importance of variable for each class.
3
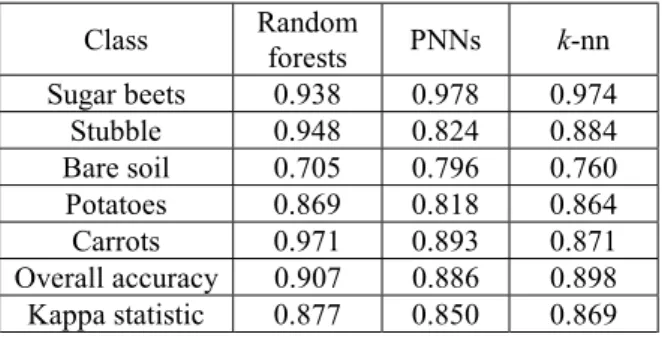
Finally, the performance of the random forests
approach was compared with previous results obtained by different classification or fusion methods to the same data sets and training /reference samples (Serpico et al., 1996).
In Serpico et al.(1996), the probabilistic neural network and k-nn method were applied. For accuracy statistics, overall accuracy, user’s accuracy and kappa statistic were computed by constructing a confusion matrix. The results are given in Table 1. In that, random forests show similar or improved classification performances. The improvements for the stubble and carrots classes were significant but the performance for the bare soil class was poorer than PNNs and k-nn algorithms.
Table 1. Accuracy statistics. PNNs and k-nn results are quoted from Serpico et al.(1996).
Class Random
forests PNNs k-nn Sugar beets 0.938 0.978 0.974
Stubble 0.948 0.824 0.884
Bare soil 0.705 0.796 0.760
Potatoes 0.869 0.818 0.864
Carrots 0.971 0.893 0.871
Overall accuracy 0.907 0.886 0.898 Kappa statistic 0.877 0.850 0.869
4.
CONCLUSIONS
Random forests for the classification of multi-sensor data and accounting for the importance of variable have been applied in this paper. The distinguished feature of the random forests approach is its ability to estimate or compute the importance of variable by using out-of-bag samples. In the experiment, the random forests approach could estimate which variable or band played a major role in discriminating the land-cover classes considered. Also, it indicated a good classification accuracy comparable to other non-parametric data fusion algorithms. Especially, the feature selection based on the information on the importance of variable in the random forests approach will be incorporated into multi-sensor /source data fusion or hyperspectral data classification.
5.
REFERENCES
Breiman, L., 2001. Random forests. Machine Learning, 45(1), pp. 5-32.
Gislason, P.O., J.A. Benediktsson, and J.R. Sveinsson, 2004. Random forest classification of multisource remote sensing and geographic data. Proceedings of IGARSS 2004, DVD publication.
Ham, J., Y. Chen, M.M. Crawford, and J. Ghosh, 2005.
Investigation of the random forest framework for
classification of hyperspectral data. IEEE Transactions on Geoscience and Remote Sensing, 43(3), pp. 492-501.
Joelsson, S.R., J.A. Benediktsson, and J.R. Sveinsson, 2005. Random forest classifiers for hyperspectral data.
Proceedings of IGARSS 2005, DVD publication.
Serpico, S.B., L. Bruzzone, and F. Roli, 1996. An experimental comparison of neural and statistical non- parametric algorithms for supervised classification of remote-sensing images. Pattern Recognition Letters, 17(13), pp. 1331-1341.
6.