Seasonal variation in fatty acid composition in various parts of broccoli cultivars
Shiva Ram Bhandari, Mi Young Park, Won Byoung Chae, Dae-Young Kim, Jung-Ho Kwak*
Vegetable Research Division, National Institute of Horticultural and Herbal Science, Rural Development Administration, Suwon, 440-706, Republic of Korea
Received on 11 November 2013, revised on 26 November 2013, accepted on 27 November 2013
Abstract : To evaluate seasonal variation in fatty acid composition in broccoli, 12 commercial cultivars of broccoli were grown in spring and fall season at the field of NIHHS, and their floret, leaf and stem parts were used for the fatty acid composition analyses. Among 14 fatty acids detected in broccoli, linolenic, palmitic and linoleic acids were major fatty acids comprising more than 80% of total fatty acids in both the seasons and all the parts. Likewise, stearic and oleic acids were also present in considerable amount while remaining fatty acids; caproic, lauric, myristic, pentadecanoic, palmitoleic, heptadecanoic, arachidic, behenic and lignoceric acids showed their minor compositional ratio. Among the three parts, stem exhibited highest SFAs (49.681% in spring and 50.717% in fall season) compared to MUFA and PUFA, while highest compositional ratio of PUFAs were observed in leaves (62.588% in spring and 68.931% in fall season), which indicates leaves as a good source of health beneficial fatty acids. In contrast, floret part exhibited highest SFA (48.786%) and PUFA (57.518%) in spring and fall seasons, respectively. Major fatty acids; palmitic, linoleic and linolenic acid showed lowest cultivar dependent variation (below 10%) and leaf showed least variation in both the seasons compared to floret and stem. Our results suggest that all the fatty acids are significantly influenced by genotype of cultivars (C), plant parts (P) and growing seasons (S). Among the 14 fatty acids, myristic and palmitic acid showed highest positive or negative correlationship with oleic (r=0.912**) and linolenic acid (r=-0.933**), respectively. The most abundant fatty acid, linolenic acid, showed either negative or no correlation ship with other fatty acids while palmitic acid, a second major fatty acid, exhibited either positive or negative correlation ship.
Key words : Broccoli, Floret, Stem, Leaves, Seasonal variation, Fatty acids
*Corresponding author: Tel: +82-31-240-3642 E-mail address: [email protected]
I. Introduction
Fatty acids are important constituents of plants, which provide various human health benefits. The main constituent of all the oil is the fatty acids which include saturated fatty acid (SFA), monounsaturated fatty acid (MUFA) and polyunsaturated fatty acid (PUFA) that influence human physiology in different ways. These fatty acids are classified as essential fatty acids; linolenic and linoleic fatty acid and non essential fatty acids depending upon the body requirement and synthesis. Essential fatty acids are required for the human body since they cannot be synthesized and
must be acquired through diet. As the saturated fatty
acids increase the risks of cardiovascular diseases,
cancer and autoimmune disorders (Iso et al., 2002),
high ratio of such fatty acids in foods are not suitable
for human health. In contrast, a diet rich in unsaturated
fatty acids are more nutritional (Aronson et al., 2001)
because a diet rich in mono unsaturated fatty acids
such as oleic acid, may decrease blood cholesterol
levels (Hargrove et al., 2001), improve high-density
lipoprotein (HDL) fluidity (Villa et al., 2002) and
protects against ischemic and stroke and lacunar
infarction (Iso et al., 2002). Similarly, polyunsaturated
fatty acids, such as linoleic and linolenic acids, may
benefit the structure and function of membrane proteins,
enzymes, and active transport molecules (Yaqoob, 2002),
and their different compositional ratio is related to
the reduction in many cardiovascular diseases, cancer, asthma as well as depression (Simopoulos, 2002). So the compositional ratio of these fatty acids in any food products is an important factor that determines the nutritional value of the food.
Broccoli, a member of genus Brassica is one of the most commonly consumed green vegetable throughout the world. It contains a wide range of health beneficial phytochemicals and a good source of glucosinolates, vitamins, phenols and flavonoids. Previous studies in broccoli showed the presence of considerable amount of wide range of various health beneficial phytochemicals such as glucosinolates, vitamins, carotenoids, minerals, phenolics and flavonoids (Rosa and Rodrigens, 2001;
Podsedek, 2007; Singh et al., 2007; Koh et al., 2009).
There are several reports having fatty acid composition in seeds as well as vegetative parts of several Brassica crops (Velasco et al., 1998; West et al., 2002; Matthaus et al., 2003; Barthet, 2008; Vidrih et al., 2009), however information regarding fatty acid composition in broccoli is limited. Although, fatty acid composition in floret part of broccoli has been studied (West et al., 2002; Vidrih et al., 2009), only one cultivar was selected and the name was not clearly identified. Furthermore, regarding the fatty acid composition in leaves and stem parts, there are no official data available. So it will be noteworthy to find out the compositional ratio of fatty acids in different parts of various commercial broccolis.
Therefore, with this study, we aimed to analyze various saturated as well as unsaturated fatty acids in commercial broccoli cultivars, to determine how these fatty acids are distributed in their different parts, to trace the influence of growing seasons in their compositional ratio and to find how these fatty acids are correlated to each other.
II. Materials and Methods
1. Plant Materials
Twelve commercial broccoli cultivars namely 05-C3,
AMaGi, BaeRiDom, CheonJae, Diamond, Grace, Grandeur, JikNok#28, NokJae, NokYeom#1, TS-2319 and YuDoRi#1 were grown at the experimental filed of NIHHS, RDA (Suwon, Korea) in spring and fall seasons. After harvesting at 80 days after sowing, the plants were then separated into floret, leaf and stem parts. They were freeze dried and ground into fine powder and then stored at -20°C until the use for chemical analyses.
2. Sample preparation of fatty acid composition
Samples for fatty acid composition analysis were prepared according to Bhandari et al. (2012). Powdered broccoli samples (0.1 g) were mixed with 680 μL of methylation mixture (MeOH: benzene: 2,2-dimethoxy- propane: H
2SO
4= 39: 20: 5: 2 by volume) and 400 μL of heptane. After vigorous mixing, the solution was heated for 2 h at 80°C in a water bath and cooled to room temperature. Then the heptanes layer was collected by centrifugation and was injected into the GC for fatty acid composition analysis.
3. Fatty acid composition analysis
Fatty acid composition was analyzed using a GC (CP-3800; Varian, Mulgrave, VIC, Australia) equipped with a flame ionization detector and a capillary column: CP SIL 88 CB FAME (50 m × 0.25 mm, 0.25 μm) according to method described by Bhandari et al.
(2012). The temperature was set 210°C for both the
injector and FID detector. The injection volume was
1 μL with split ratio 1:50 on constant column flow (1
mL/min) of helium gas. The oven temperature was
initially maintained at 100°C for 5 min, and FID
increased up to 160°C at a rate of 5°C/min, maintained
for 5 min, and again increased up to 180°C at a rate
of 4°C/min.
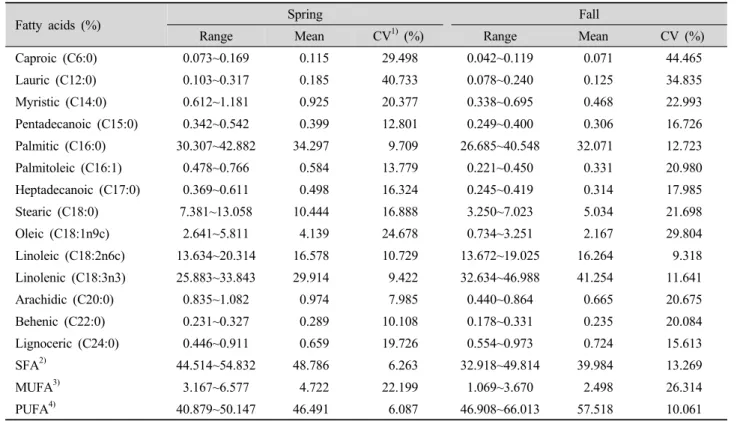
Table 1. Descriptive analysis of fatty acid composition in two seasons of broccoli cultivars in floret.
Fatty acids (%) Spring Fall
Range Mean CV
1)(%) Range Mean CV (%)
Caproic (C6:0) 0.073~0.169 0.115 29.498 0.042~0.119 0.071 44.465
Lauric (C12:0) 0.103~0.317 0.185 40.733 0.078~0.240 0.125 34.835
Myristic (C14:0) 0.612~1.181 0.925 20.377 0.338~0.695 0.468 22.993
Pentadecanoic (C15:0) 0.342~0.542 0.399 12.801 0.249~0.400 0.306 16.726
Palmitic (C16:0) 30.307~42.882 34.297 9.709 26.685~40.548 32.071 12.723
Palmitoleic (C16:1) 0.478~0.766 0.584 13.779 0.221~0.450 0.331 20.980
Heptadecanoic (C17:0) 0.369~0.611 0.498 16.324 0.245~0.419 0.314 17.985
Stearic (C18:0) 7.381~13.058 10.444 16.888 3.250~7.023 5.034 21.698
Oleic (C18:1n9c) 2.641~5.811 4.139 24.678 0.734~3.251 2.167 29.804
Linoleic (C18:2n6c) 13.634~20.314 16.578 10.729 13.672~19.025 16.264 9.318 Linolenic (C18:3n3) 25.883~33.843 29.914 9.422 32.634~46.988 41.254 11.641
Arachidic (C20:0) 0.835~1.082 0.974 7.985 0.440~0.864 0.665 20.675
Behenic (C22:0) 0.231~0.327 0.289 10.108 0.178~0.331 0.235 20.084
Lignoceric (C24:0) 0.446~0.911 0.659 19.726 0.554~0.973 0.724 15.613
SFA
2)44.514~54.832 48.786 6.263 32.918~49.814 39.984 13.269
MUFA
3)3.167~6.577 4.722 22.199 1.069~3.670 2.498 26.314
PUFA
4)40.879~50.147 46.491 6.087 46.908~66.013 57.518 10.061
1)
CV: Coefficient of variation.
2)
SFA: Saturated fatty acid.
3)
MUFA: Monounsaturated fatty acid.
4)
PUFA: Polyunsaturated fatty acid.
4. Authentic standards and chemicals
A standard for FAME (fatty acid methyl ester) was obtained from Supelco (Bellefonte, PA, USA). Chemicals such as 2,2-dimethoxypropane was purchased from Sigma-Aldrich (St. Louis, MO, USA). Benzene, n-heptanes, and sulfuric acid were acquired from Daejung Chemical Co., Ltd. (Gwangju Si, Gyeonggi-Do, Republic of Korea).
5. Statistical analysis
Means of two independent sample replications were used for all the statistical analyses. The significance of differences among cultivars (C), growing seasons (S), plant parts (P) and their interactions (C × S, C
× P, S × P and C × S × P) was assessed by mixed model ANOVA by using SPSS (ver. 18; SPSS, Inc.,
Chicago, IL, USA). Relationships among fatty acids were assessed by multivariate analyses using Spearman’s rank order correlation coefficients (R) at P ≤ 0.05.
III. Results and discussions
1. Fatty acid composition
Descriptive analysis of fatty acid composition among different parts of broccoli cultivars in two growing seasons is presented in Table 1-3. Among the 37 fatty acids analyzed, only 14 fatty acids could be detected under our experimental conditions in both the seasons in floret part (Table 1). In spring season, most abundant fatty acid was palmitic acid (30.307~
42.882%), which was followed by linolenic (25.883~
33.843%) and linoleic acid (13.634~20.314%), however
linolenic acid showed highest compositional ratio
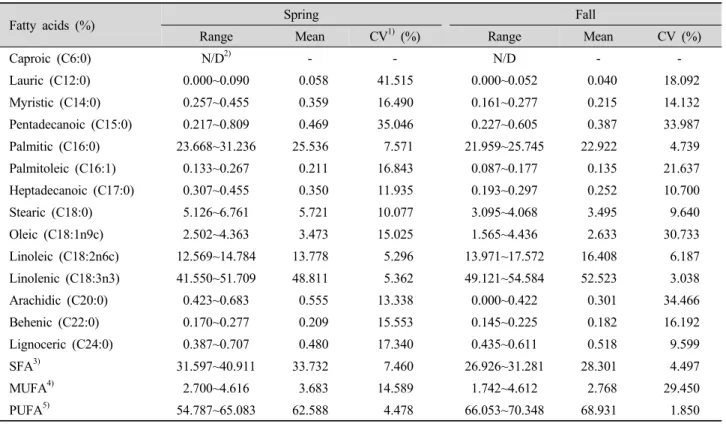
Table 2. Descriptive analysis of fatty acid composition in two seasons of broccoli cultivars in leaf.
Fatty acids (%) Spring Fall
Range Mean CV
1)(%) Range Mean CV (%)
Caproic (C6:0) N/D
2)- - N/D - -
Lauric (C12:0) 0.000~0.090 0.058 41.515 0.000~0.052 0.040 18.092
Myristic (C14:0) 0.257~0.455 0.359 16.490 0.161~0.277 0.215 14.132
Pentadecanoic (C15:0) 0.217~0.809 0.469 35.046 0.227~0.605 0.387 33.987
Palmitic (C16:0) 23.668~31.236 25.536 7.571 21.959~25.745 22.922 4.739
Palmitoleic (C16:1) 0.133~0.267 0.211 16.843 0.087~0.177 0.135 21.637
Heptadecanoic (C17:0) 0.307~0.455 0.350 11.935 0.193~0.297 0.252 10.700
Stearic (C18:0) 5.126~6.761 5.721 10.077 3.095~4.068 3.495 9.640
Oleic (C18:1n9c) 2.502~4.363 3.473 15.025 1.565~4.436 2.633 30.733
Linoleic (C18:2n6c) 12.569~14.784 13.778 5.296 13.971~17.572 16.408 6.187
Linolenic (C18:3n3) 41.550~51.709 48.811 5.362 49.121~54.584 52.523 3.038
Arachidic (C20:0) 0.423~0.683 0.555 13.338 0.000~0.422 0.301 34.466
Behenic (C22:0) 0.170~0.277 0.209 15.553 0.145~0.225 0.182 16.192
Lignoceric (C24:0) 0.387~0.707 0.480 17.340 0.435~0.611 0.518 9.599
SFA
3)31.597~40.911 33.732 7.460 26.926~31.281 28.301 4.497
MUFA
4)2.700~4.616 3.683 14.589 1.742~4.612 2.768 29.450
PUFA
5)54.787~65.083 62.588 4.478 66.053~70.348 68.931 1.850
1)
CV: Coefficient of variation.
2)
N/D: Not detected
3)
SFA: Saturated fatty acid.
4)
MUFA: Monounsaturated fatty acid.
5)
PUFA: Polyunsaturated fatty acid.
(41.254%) in fall season with the range of 32.634~
46.988%. In both of the seasons, all three major fatty acids exhibited quite similar cultivar dependent variation (9.318% in linoleic acid to 12.723% in palmitic acid ) as measured by coefficient of variation (CV%). The other fatty acids such as stearic and oleic acid also showed their considerable value in both of the seasons, however the values were higher in spring season compared to fall season. Other fatty acids; caproic, lauric, myristic, pentadecanoic, palmitoleic, arachidic, behenic and lignoceric acids were minor fatty acids and most of them showed less than 1% of total fatty acids in both of the seasons. Between the two seasons, total saturated fatty acid (SFA) and mono unsaturated fatty acid (MUFA) percentages were higher in spring season compared to fall season, while polyunsaturated fatty acid (PUFA) showed higher compositional ratio in fall season. Unlike the major fatty acids, SFA,
MUFA and PUFA showed higher cultivar dependent variation in fall season compared to spring season.
In leaves, all the fatty acids except lauric acid as
present in floret parts were detected in both of the
seasons (Table 2). The major fatty acids were similar
as in floret parts; however most abundant fatty acid
was linolenic (48.811%) that was followed by palmitic
(25.536%) and linoleic acid (13.778%) in spring
season. Similar higher compositional ratio was found
in fall season but palmitic acid exhibited higher ratio
in spring season compared to fall season while both
the linolenic and linoleic acids showed their higher
compositional value in fall season than in spring
season. Average SFA (33.732%) and MUFA (3.683%)
in spring season were higher than in fall season,
while PUFA showed their higher compositional ratio
in fall season (68.931%) than in spring season
(62.588%). Similar to the floret, leaf also exhibited
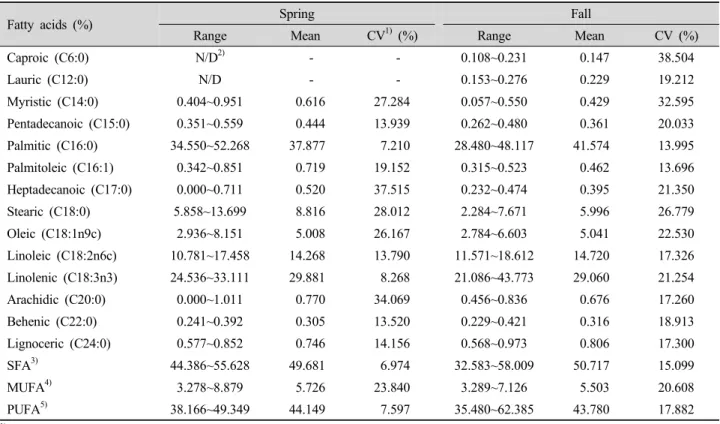
Table 3. Descriptive analysis of fatty acid composition in two seasons of broccoli cultivars in stem.
Fatty acids (%) Spring Fall
Range Mean CV
1)(%) Range Mean CV (%)
Caproic (C6:0) N/D
2)- - 0.108~0.231 0.147 38.504
Lauric (C12:0) N/D - - 0.153~0.276 0.229 19.212
Myristic (C14:0) 0.404~0.951 0.616 27.284 0.057~0.550 0.429 32.595
Pentadecanoic (C15:0) 0.351~0.559 0.444 13.939 0.262~0.480 0.361 20.033
Palmitic (C16:0) 34.550~52.268 37.877 7.210 28.480~48.117 41.574 13.995
Palmitoleic (C16:1) 0.342~0.851 0.719 19.152 0.315~0.523 0.462 13.696
Heptadecanoic (C17:0) 0.000~0.711 0.520 37.515 0.232~0.474 0.395 21.350
Stearic (C18:0) 5.858~13.699 8.816 28.012 2.284~7.671 5.996 26.779
Oleic (C18:1n9c) 2.936~8.151 5.008 26.167 2.784~6.603 5.041 22.530
Linoleic (C18:2n6c) 10.781~17.458 14.268 13.790 11.571~18.612 14.720 17.326 Linolenic (C18:3n3) 24.536~33.111 29.881 8.268 21.086~43.773 29.060 21.254
Arachidic (C20:0) 0.000~1.011 0.770 34.069 0.456~0.836 0.676 17.260
Behenic (C22:0) 0.241~0.392 0.305 13.520 0.229~0.421 0.316 18.913
Lignoceric (C24:0) 0.577~0.852 0.746 14.156 0.568~0.973 0.806 17.300
SFA
3)44.386~55.628 49.681 6.974 32.583~58.009 50.717 15.099
MUFA
4)3.278~8.879 5.726 23.840 3.289~7.126 5.503 20.608
PUFA
5)38.166~49.349 44.149 7.597 35.480~62.385 43.780 17.882
1)
CV: Coefficient of variation.
2)
N/D: Not detected
3)
SFA: Saturated fatty acid.
4)
MUFA: Monounsaturated fatty acid.
5)
PUFA: Polyunsaturated fatty acid.
higher SFA and MUFA in spring season and lower PUFA in fall season, however seasonal variation was not prominent compared to genotypic variation. In the leaves, we found comparatively higher ratio of omega-3 fatty acid i.e. linolenic acid, which suggests that leaves contribute more health beneficial activity for human health because omega-3 PUFAs have hypcholes- teremic effect and inhibit the atherosclerotic process and coronary thrombosis (Connor and Connor, 1997).
In the case of stem, all the 14 fatty acids as present in floret parts are found in fall season; however two fatty acids; caproic and lauric acid were not detected in spring season (Table 3). Palmitic acid was the most abundant fatty acid (37.877% in spring and 41.574%
in fall season), which followed by linolenic and linoleic acid in both of the seasons. Variation due to the influence of cultivars was higher in fall season compared to spring season in major fatty acids as well
as most of the minor fatty acids, which suggest that environmental factors are also responsible for the variation in fatty acids in broccoli stem. Although, average compositional ratio of major fatty acids was similar in both of the seasons, they showed more cultivar dependent variation in both of the seasons compared to floret and leaves. Average content of total SFA, MUFA and PUFA were 49.681%, 5.726% and 44.149%, respectively in spring season. The value observed in fall season was also quite similar to the spring season; however cultivar dependent variation was higher in fall season than in spring season.
Among the three parts, stem exhibited comparatively
higher SFAs in both the spring (49.681%) and fall
seasons (50.717%) and highest compositional ratio of
PUFAs were observed in leaves in both spring (62.588%)
and fall season (68.931%). In contrast, floret part
exhibited highest SFA and PUFA in spring and fall
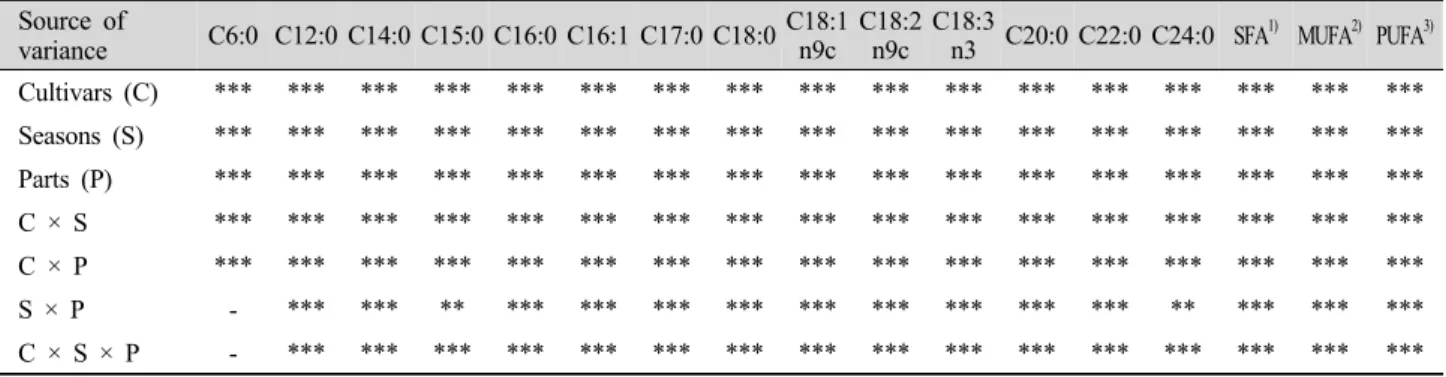
Table 4. Statistical analysis of variance for the fatty acid composition in broccoli cultivars.
Source of
variance C6:0 C12:0 C14:0 C15:0 C16:0 C16:1 C17:0 C18:0 C18:1 n9c C18:2 n9c C18:3
n3 C20:0 C22:0 C24:0 SFA
1)MUFA
2)PUFA
3)Cultivars (C) *** *** *** *** *** *** *** *** *** *** *** *** *** *** *** *** ***
Seasons (S) *** *** *** *** *** *** *** *** *** *** *** *** *** *** *** *** ***
Parts (P) *** *** *** *** *** *** *** *** *** *** *** *** *** *** *** *** ***
C × S *** *** *** *** *** *** *** *** *** *** *** *** *** *** *** *** ***
C × P *** *** *** *** *** *** *** *** *** *** *** *** *** *** *** *** ***
S × P - *** *** ** *** *** *** *** *** *** *** *** *** ** *** *** ***
C × S × P - *** *** *** *** *** *** *** *** *** *** *** *** *** *** *** ***
**, ***Significant at P<0.01 and 0.001, respectively.
1)
SFA: Saturated fatty acid;
2)MUFA: Monounsaturated fatty acid;
3)PUFA: Polyunsaturated fatty acid.
seasons, respectively. The presence of higher com- positional ratio of PUFA in leaves suggests their higher health beneficial effects, as PUFA may decrease blood cholesterol levels (Hargrove et al., 2001) and improve HDL fluidity (Villa et al., 2002). Furthermore, leaves also exhibited lowest cultivar dependent variation (below 10%) in major fatty acids; palmitic, linoleic and linolenic acid in both of the seasons.
However, all the above results revealed that all the fatty acids were significantly affected by cultivars (C), plant parts (P) and growing seasons (S) (Table 4). Similarly, all the interactions (C × S, C × P, S
× P and C × S × P) were also significant. Similar cultivar dependent as well as seasonal dependent significant variation was also observed by Balouchi et al. (2011), Koh et al. (2009), Kurilich et al. (1999), Rosa and Rodrigues (2001), Rosa et al. (2001), Singh et al. (2007) and Vallejo et al. (2003) in various phytochemicals such as glucosinolates, vitamin C, phenolics, flavonoids, free sugars, however this is the first report that describes such variations (genotypic, seasonal as well as parts) in term of fatty acid composition in broccoli.
As we know that some saturated fatty acids such as lauric (12:0), myristic (14.0) and palmitic (16:0) acids (Denkeand Grundy, 1992; Zock et al., 1994) raise cholesterol levels, which is a major risk factor in CHD (Grundy, 1997), high compositional ratio of these fatty acids in food is not suitable for health. So, to
overcome from this situation, development of cultivar having lower ratio of saturated fatty acid (higher UFA ratio), will be good for the human diet.
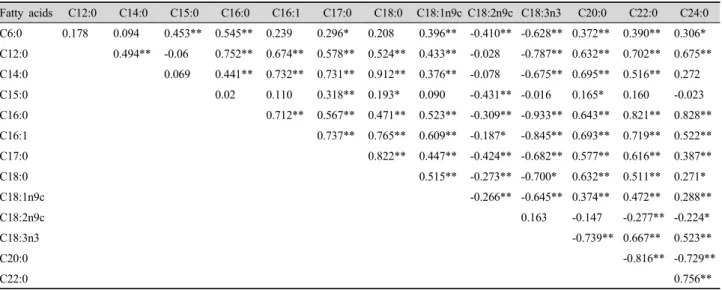
2. Correlationship among fatty acids
To understand the distribution pattern of various
fatty acids in broccoli, we evaluated the correlation
ship among fatty acids regardless of genotypes, their
parts and growing seasons. The most abundant fatty
acid; linolenic acid showed either significantly
negative or no correlation ship with other fatty acids
in that most significant negative correlation ship was
observed with palmitic acid (r=-0.933**) which was
followed by oleic acid (r=-0.845**) (Table 5). Similar
to the linolenic acid, linoleic acid also showed either
negative or no correlationship with other fatty acids,
however the relationship was poor (r value below
-0.431**) compared to that of linolenic acid. In
contrast, palmitic acid, most abundant SFA showed
significantly positive correlations with lignoceric acid
(r=0.828**), behenic acid (r=0.821**), lauric acid
(r=0.752**) and other fatty acids except with both
PUFAs; linolenic and linoleic acid. These results
indicate that decrease in compositional ratio in
palmitic acid increases the compositional ratio of
linolenic and linoleic acid. This is important because
a breeding approach could focus on increasing the
compositional ratio of unsaturated fatty acids such as
Table 5. Correlation coefficients among fatty acids in broccoli.
Fatty acids C12:0 C14:0 C15:0 C16:0 C16:1 C17:0 C18:0 C18:1n9c C18:2n9c C18:3n3 C20:0 C22:0 C24:0 C6:0 0.178 0.094 0.453** 0.545** 0.239 0.296* 0.208 0.396** -0.410** -0.628** 0.372** 0.390** 0.306*
C12:0 0.494** -0.06 0.752** 0.674** 0.578** 0.524** 0.433** -0.028 -0.787** 0.632** 0.702** 0.675**
C14:0 0.069 0.441** 0.732** 0.731** 0.912** 0.376** -0.078 -0.675** 0.695** 0.516** 0.272
C15:0 0.02 0.110 0.318** 0.193* 0.090 -0.431** -0.016 0.165* 0.160 -0.023
C16:0 0.712** 0.567** 0.471** 0.523** -0.309** -0.933** 0.643** 0.821** 0.828**
C16:1 0.737** 0.765** 0.609** -0.187* -0.845** 0.693** 0.719** 0.522**
C17:0 0.822** 0.447** -0.424** -0.682** 0.577** 0.616** 0.387**
C18:0 0.515** -0.273** -0.700* 0.632** 0.511** 0.271*
C18:1n9c -0.266** -0.645** 0.374** 0.472** 0.288**
C18:2n9c 0.163 -0.147 -0.277** -0.224*
C18:3n3 -0.739** 0.667** 0.523**
C20:0 -0.816** -0.729**
C22:0 0.756**
*, **, Correlation is significant at P<0.05 and 0.01, respectively.