한국정보통신학회논문지(J. Korea Inst. Inf. Commun. Eng.) Vol. 21, No. 1 : 90~98 Jan. 2017
IoT 서비스를 사용하는 사용자 계층별 차이에 대한 만족도 분석
박종운1* · 권창희2
User satisfaction analysis for layer-specific differences using the IoT services
Chong-Woon Park
1*· Chang-Hui Kwon
21*
Department of U-City IT Convergence Urban Policy, Hansei University Graduate School, Gunpo 15852, Korea
2
Department of U-City IT Convergence Urban Policy, Hansei University Graduate School, Gunpo 15852, Korea
요 약
2010년 이후 스마트폰의 폭발적 보급이 탄생시킨 SNS가 대중의 광고 플랫폼으로 자리 잡고 있으며, 사물인터넷 (IoT)시대의 탄생이 단계적으로 초읽기에 들어간 것이 우리에게 이미 다가와 있다. 이에 위치기반 서비스를 활용한 다양한 IoT 서비스(비콘, O2O)가 활용되고 있는 것에 대한 유 경험 사용자들의 계층별 차이에 대한 만족도를 분석하 는데 본 논문의 초점을 둔다. 논문의 내용을 전개하기 위하여 현재 서비스가 이루어지고 있는 대표적 IoT서비스의 종 류와 전체적 활용 개념을 고찰한다. 가설은 피터모빌의 User Experience Honeycomp이라고 불리우는 UX벌집모형 에서 용이성, 매력성, 신뢰성, 가치성 4가지로 설문을 재구성하였다. 본 연구에서 IoT 서비스를 제공하는 기업은 사 용자의 만족도 차이에 따라 보다 정확한 맞춤형 서비스를 제공하는데 도움이 되는 기초자료로 활용이 될 수 있을 것 으로 기대된다.
ABSTRACT
Since 2010, SNS was holding the explosive spread of smartphones has created a place of public advertising platform, and it entered the Internet of Things (IoT) is born gradually countdown of the era came to us already. In utilizing a variety of location-based services IoT services (beacon, O2O) The focus of this paper to analyze the differences in satisfaction with the oil layer by experienced users of what is being used. We consider the type and overall utilization of the concepts typical IoT service in the current service is made to expand the contents of the paper.
Hypothesis was reconstructed ease, attractiveness, a survey reliability, value four kinds of models, called Honeycomb UX, User Experience Honeycomp Peter Mobil. Company that provides the service IoT in this study are expected to be used as basic data to help provide a more accurate personalized service according to the user's satisfaction difference.
키워드 : IoT, 사물인터넷, O20, 비콘, 빅데이터, 계층별 차이, 사용자 만족도
Key word : IoT, Internet of Things, O2O, Beacon, BigData, Hierarchy difference, User Satisfaction
Received 20 September 2016, Revised 27 September 2016, Accepted 17 October 2016
* Corresponding Author Chong-Woon Park(E-mail:[email protected], Tel:+82-31-450-5072
Department of U-City IT Convergence Urban Policy, Hansei University Graduate School, Gunpo 15852, Korea
Open Access
http://doi.org/10.6109/jkiice.2017.21.1.90
print ISSN: 2234-4772 online ISSN: 2288-4165Ⅰ. 서 론
1.1. 연구의 배경 및 목적
2010년 이후 스마트 폰의 수요 증가는 다양한 모바 일 기기들의 등장을 야기 시켰고 이는 곳 미디어 산업 과 광고지상에까지 변화를 선도하기 시작하였다. 이러 한 스마트폰의 대중화가 이끌어낸 모바일 광고는 기존 미디어를 통한 광고 경쟁 속에서 보다 높은 사용 점유 율을 나타내고 있다.
이러한 스마트 디바이스들이 제공하는 다양한 서비 스는 사용자들로 하여금 새로운 경험으로 다가오고 있 다. 특히 스마트폰에 IoT 기능을 겸비한 타켓 서비스는 고객에게 맞춤형 메시지를 전달할 수 있는 기능으로 까지 발전하여 시간과 장소에 구애 받지 않는다는 위치 기반서비스의 서막을 보여주고 있다[1].
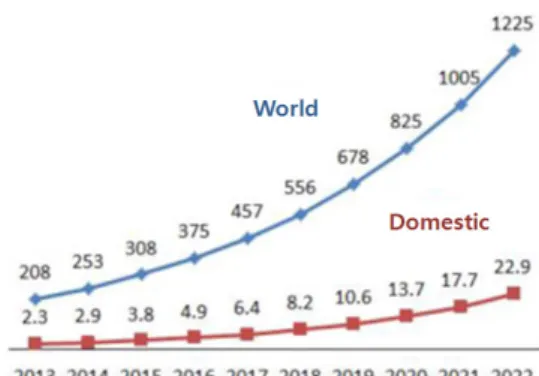
인터넷에 연결되는 사물의 수는 PC, 태블릿, 스마트 폰을 제외하고 2020년에 약 260억 개까지 증가할 것으 로 전망된다. 약 3,000억 달러의 서비스 및 제품 시장 창 출과 1.9조 달러 규모의 경제적 파급효과가 발생할 것 으로 예상된다. 사물인터넷 글로벌 시장은 네트워크, 단말기 등의 하드웨어 시장 뿐 아니라 IoT 서비스 분야 가 크게 확대될 것으로 예상되며 ‘서비스 및 애플리케 이션’ 분야의 성장세는 매년 90%씩 큰 폭으로 성장하 여, 2022년에는 29.7%에 해당하는 높은 비중을 차지할 것으로 주목된다.
기존에는 사용자가 정보를 찾아가는 환경 이었다면 현재는 사용자에게 정보를 제공하여 사용자들이 직접 선택하도록 하는 환경이 이루어지고 있다. 이에 따라 사용자에게 즉각적으로 다양한 정보를 전달해주는 역할을 하며 IoT 시대를 맞아 몰락해가던 블루투스 (bluetooth) 기술을 부활시키고 오프라인(off-line) 시장 을 살릴 수 있는 주역으로 비콘이 주목받고 있다. 또한 위치기반 서비스를 포함한 온라인과 오프라인의 경계 를 아우르는 O2O 서비스가 온라인 쇼핑을 대체하는 새 로운 트렌드로 자리잡고 있다.
본 연구는 정보의 접근성이 스마트폰을 통해 빠른 속 도로 다가오는 요즘 시대의 트렌드를 반영하여 스마트 폰을 기본으로 한 IoT 서비스를 사용하고 있는 소비자 들의 인구통계학적 분석을 통하여 사용자 계층별 차이 를 분석 후 이 차이에 대한 만족도를 분석 하고자 하는 데 초점을 둔다.
1.2. 연구의 방법 및 내용
본 연구의 목적인 IoT 서비스 사용자의 인구통계학 적 차이에 대한 서비스 만족도를 분석하기 위한 연구의 방법 및 내용은 다음과 같다.
첫째, 사물인터넷의 개념과 의미를 알기 위하여 사물 인터넷 문헌연구와 사례연구의 이론적 고찰을 통하여 IoT 서비스의 개념과 역할에 대하여 살펴본다. 또한 사 물인터넷의 시대별 변화 추이를 나타내어 IoT 서비스가 빠르게 변하고 있는 기업의 대체 광고 매체 임을 알아 본다.
둘째, IoT 서비스의 종류를 알아본다. 소비 형태를 공통점으로 갖고 있는 IoT 서비스의 특성상 소비자의 행동을 관찰하기 위해 사용 경험요소를 분석 하고자 IoT 서비스의 유경험자를 중심으로 용이성, 매력성, 신 뢰성, 가치성 4가지의 유형으로 설문을 작성한다.
셋째, IoT 서비스 유형에 따른 사용자의 계층별 차이 에 대한 만족도 분석을 위해 인구통계학적 분석(성별, 결혼여부, 학력, 연령, 월소득, 직업)을 활용한 표본을 추출한다.
Ⅱ. 이론적 배경
2.1. IoT 서비스의 이해
IoT는 ‘인터넷이나 다른 기기들과 데이터 교환을 통 해 더 나은 가치와 서비스를 받을 수 있는 연결성을 가 진 개체들의 네트워크’라 정의하고 있으며 급속도로 빠 르게 발전하고 있는 IoT 서비스 관련 산업들은 그 개념 조차 빠르게 바꾸어 가고 있다[2]. 아래 그림 1은 사물 인터넷의 이해를 돕는 개념 그림이다.
Fig. 1 The concept of Internet of Things
IoT의 3대 구성요소는 ‘사람, 사물, 서비스의 3가지 요소로 이루어져 있으며 사물, 사물과 사물, 사물과 서 비스, 서비스와 특정 서비스 등 각 요소 간의 상호작용 이 원활해야 최대의 효과를 얻을 수 있다.’고 하였다[3].
아래 그림 2는 사물인터넷의 개념도 이다
Fig. 2 Three components of IoT
IoT의 3대 주요 요소 기술로는 ‘센싱기술, 유무선 통 신/네트워킹 기술, IoT 서비스 인터페이스 기술’로서 아 래 표 1의 3가지로 정의하였다[4].
Table. 1 Three main elements of the IoT technologies
The mainelements Characteristic
Sensing Technology
· It includes a physical sensor for obtaining information from a type of object and the surrounding environment
· Recently physical sensor has developed into a smart sensor with a built-in standardized interface and information processing capability so as to improve the application properties
Wired and wireless communications,
network infrastructure
skills
· People and objects, meaning any wired or wireless network and connect to the service
IoT services interface technology
· IoT key by interlocking the three components and the application service to perform a particular function means a portion that serves
· But the concept of network interface sensing information, processing, storage and situational awareness / recognition, security / privacy, authentication / authorization, discovery, object, formal, virtualization, location, process management, open platform technology, middleware technology, data mining It serves as the interface (storage, processing, conversion, etc.) for technical, social networks, such as services performed
가트너에 의하면 ‘IoT 기기가 2014년 37.5억대, 2015 년에는 30% 증가한 48.8억대에 이르고 2020년에는 250 억대에 이를 것으로 전망했으며 특히 2020년 IoT 기기 의 절반이상이 소비자 부문에서 발생할 것으로 전망’하 였다[5].
2.2. IoT 서비스의 시대별 변화 추이
사물인터넷이란 우리 일상속의 모든 기기가 인터넷 과 연결되어 서로 교신하고 정보를 저장하는 기술로, 사람들이 어디서, 누구와, 무엇을 하는지 알 수 있게 해 주기 때문에 특히 마케팅과 고객관리 영역에서 빅데이 터 기술과 결합해 엄청난 혁신을 가져올 것이다[6].
아래 그림 3은 산업 연구원에서는 2014 사물인터넷 시장규모를 예측한 그래프이다(단위 : 조원).
Fig. 3 Internet of Things market
2.3. IoT 서비스를 활용한 광고
산업 연구원에서는 사물인터넷 시장규모를 국내시 장 22.9조원에서 세계시장 1225조원으로 추정 하고 있 다. 스마트폰 사용자들 중 약 70% 이상의 사용자들이 모바일 쇼핑에 경험이 있는 것으로 파악되고 있으며, 이를 위하여 기업은 보다 편리한 모바일 쇼핑을 제공 하고자 다양한 어플리케이션을 제공하고 이를 광고에 까지 활용하고 있다.
2.4. IoT 서비스 종류와 활용 사례
2.4.1. 비콘(beacon) 서비스 개념 및 활용 사례
비콘서비스란 근거리에 있는 사용자 위치를 찾아 문
자 전송, 모바일 결제, 정보 제공 등을 가능케 하는 스마
트폰 근거리 통신서비스를 말한다. 또한 비콘(Beacon)
서비스는 저전력 블루투스 BLE(Bluetooth Low Energy),
NFC(Near Field Communication), QR코드(Quick Response code), 초음파(Ultrasonic signal) 등 여러 기술 을 통하여 구현한다. 아래의 그림4는 우리가 사용하고 있는 비콘의 서비스 구조를 간단한 그림으로 나타내 주 고 있다.
Fig. 4 Beacon service structure
아래의 표 2는 비콘의 종류를 그 가치와 활용성을 적 용하여 보여주고 있다.
Table. 2 Kind of beacon
Kinds Characteristic
pebBLE Type
Small clothing store into a small pebble form, restaurants, cafes, retail-optimized beacon to the environment
marBLE Type
The room is equipped to the positioning as well as navigation capabilities optimized for the large interior space, such as a hospital or at an airport beacon
nimBLE Type
And specializes in the exhibition hall, art galleries, museums need to frequently change the nature of the location, check-in, and both mounted navigation beacon
treBLE Type
The possible use of a beacon in large spaces such as stadiums and concert halls
이러한 비콘의 등장은 우리에게 정확한 정보와 편리 함을 갖고 생활에 친숙하게 다가와 지속적으로 진화하
고 있다. 아래의 표 3은 비콘의 활용예를 보여주고 있다.
Table. 3 Best Practice beacon
Kinds Use Cases
syrrup
YAP
2.4.2. O2O(Online to Offline)서비스 개념 및 활용사례 현재 IoT 서비스 를 응용한 모바일 O2O 마케팅은 온 라인과 오프라인을 유기적으로 연결하여 각종 쿠폰 이 나 할인티켓을 발행하여 고객을 자연스럽게 오프라인 으로 유도하는 서비스이다. ‘모바일 서비스의 가장 큰 특성은 위치기반적 특징을 적용하여 고객의 위치와 정 보를 파악하고 개인식별성의 상황기반 제공성’으로 정 의할 수 있다[7]. 아래의 그림 5는 O2O의 전체 개념을 그림으로 보여주고 있다.
By connecting online and offline organically To create value services
Fig. 5 O2O service structure
아래의 표 4는 O2O의 활용예를 보여주고 있다.
Table. 4 Best Practice O2O
Kinds Use Cases
KAKA O Taxi
ya nolja
yo gi yo
Ⅲ. 연구모형과 설계
3.1. 연구모형의 도출 및 설계
사용자의 IoT 서비스의 사용성을 파악하기 위하여 사용자의 전체적인 느낌을 알아보기 위한 연구모형의 설계를 위해 이론적 유형을 적용하기에 적합한 피터모 빌의 허니콤 모델을 적용하였다. 허니콤 모델의 7가지 원칙의 사용성, 유용성, 검색성, 신뢰성, 접근성, 가치성, 매력성 중 IoT 서비스와 이를 사용하는 사용자와의 유 기적 작용을 고려하여 사용성과 유용성을 합한 용이성 과 나머지 중 매력성, 신뢰성, 가치성의 총 4가지 원척 으로 연구 유형을 도출하였다[8].
사용 용이성은 학습과 사용에 대한 효율적 편리함에 초점을 두어 측정하였으며, 매력성은 보고 사용하는 사 용자들의 감각적 요소의 유무에 대하여, 신뢰성은 개인 정보의 수집과 가공이 사용자에게 얼마나 보안적으로 신뢰를 주는지, 가치성은 사용자의 사용 후 느낌이 사 용 만족에 얼만큼 상업적 활용 가치를 두는지에 대하여 측정하였다. IoT 서비스에 대한 사용자의 서비스 만족 도를 측정하기 위해 아래 표5와 같은 유형별 설문을 5 점척도 문항으로 진행하였다.
Table. 5 The analysis of frequency on Hierarchy-specific
Item Questionnaire
Easy
1. Understanding of the beacon, using method, information about whether the information has.
2. After installing the application, enter information about the settings, positioning, provide information about yourself, think it is easy to check.
3. The contents of push notification messages are considered easy to recognize.
4. OK, think that the approval process and easy way to practical use.
5. Think easy way to check the coupons, event information, push notification of messages.
6. Think easy way to check the coupons, event information, push notification of messages.
7. I think it is easy to order online utilizing smartphones.
8. I think easy ordering via push notification service.
9. I think the connection of the induction service provider marketing ever additional services that facilitate access via push notifications when service.
10. I think that to understand fully the services and take advantage of Bluetooth beacons.
Attrac tivene ss
1. I think that the screen structure of the application is easy and convenient.
2. I think that the visual arrangement of elements arranged to determine, depending on what side.
3. I think information delivery methods / presentation of push notifications is attractive.
4. I think that satisfaction is worth about push notification / information.
5. I think that satisfaction is worth about push notification / information.
6. I think it is excellent overall design of the application.
7. After one bite O2O services, such as online ordering and satisfaction in the service of coming to find offline.
8. O2O service after the order of the Starbucks siren such as online ordering and satisfaction of customer pick-up service offline.
9. I think the overall design of the application that the impact on the purchase decision.
10. There are doctors continue to use the application.
Respo nsibili ty
1. Guess confidence going service for the beacon receives via Bluetooth.
2. I think confidence about going to live always turn on the Bluetooth.
3. I think that Bluetooth is automatically trust the information he provided about what was going on when entering the store.
4. Doctors have to buy things for receiving push notifications without approval.
5. The birthplace of confidence going to the store at
3.2. 연구의 변수 및 빈도분석
조절변수인 용이성, 매력성, 신뢰성, 가치성의 4가지 원칙에 인구통계학적 분석(성별, 결혼여부, 학력, 연령, 월소득, 직업)이라는 통제 변수를 적용하여 IoT를 사용 하는 사용자 계층별 차이를 분석하기 위한 설문을 구성 하였다.
설문조사를 위한 설문지는 본 논문의 핵심과 같은 맥
락을 적용하고자 모바일 플렛폼을 적용하여 완성하였 다. 모바일 설문을 구성 후 236명의 설문지 대상자들에 게 개별적으로 설문을 배포하고 설명하여 불성실한 응 답자 29명을 제외한 207명의 설문 표본을 수집하였다.
허나 연령대별 분포 80%가 20대와 30대에 편중되어 사 용자 계층별 차이의 정확한 파악을 위해 추가 200표본 을 산정하여 연령대의 고른 분포를 위하여 온라인 패널 에게 선택적으로 문의해 설문조사를 실시하였다. 온라 인 패널들 317명의 응답 중 97명의 설문 또한 불성실응 답자로 판단하여 220명의 응답자 설문지로 설문 표본 을 확보하였다. 아래는 표 6은 표본의 빈도를 분석한 결 과표이다.
Table. 6 The analysis of frequency on Hierarchy-specific
Variable Item Frequency %
Gender Man 227 53.2
Woman 200 46.8
Marital Status
Single 187 43.8
Married 240 56.2
Level of education
High school graduation
or less 40 9.4
High school graduation 115 26.9 College graduates 49 11.5 University graduate 173 40.5 Graduate school or higher 50 11.7
Age
20's 138 32.3
30's 94 22.0
40's 93 21.8
50's 83 19.4
60's 19 4.4
Monthly Income
Less than 1 million won 87 20.4
1~2 million won 65 15.2
2~3 million won 95 22.2
3~4 million won 70 16.4
4~5 million won 36 8.4
5~6 million won 31 7.3
More than 6 million won 43 10.1
Job
Housewife 43 10.1
Student 95 22.2
Self-Employment 35 8.2
Professional 49 11.5
Sales / Service jobs 20 4.7
Office workers 165 38.6
Inoccupation 9 2.1
Etc 11 2.6
Item Questionnaire
the time of admission Customisable (login, visit history, product preferences and consumption patterns) features.
6. I think confidence is going to the customer personalized service privacy.
7. Tailored to the customer's personal information to think positively.
8. Visit the store even when Bluetooth is turned on, it automatically think about going to the Beacon Trust Services.
9. Push notification service stores that you visit frequently think that it is worth using.
10. Customer information is collected in consumption patterns and think positively about the use of personal information that is the big ingestion.
Value
1. Push notifications think the impact on store traffic is crazy, buying goods.
2. I think the availability for a personalized visit history, product preferences, auto-approved offers.
3.The provision of differentiated services to customers through the beacon analysis according to the customer the use frequency value of the guess is utilized.
4. Typical applications are switching to the moment beacon service applications, visit the store and think positively about providing only the important information.
5. Do you think there would be a push notification if a satisfactory experience provided some degree of information per store?
6. Beacon service is thought to be higher influence of the push notification service.
7. The beacon think O2O and services such as smartphones take advantage of online services to replace the consumption of utilizing PC.
8. About goods through customizable push notifications, it is purchasing.
9. Since the coupon via push notifications have thought to go to the store.
10. Against the coupons issued by a variety of different forms that are published every day in the same store and think positively.
Ⅳ. 연구분석 및 결과
4.1. 계층별 만족도 분석 결과
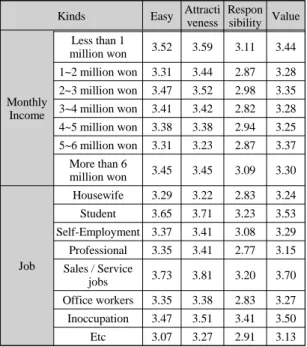
IoT 서비스를 사용하는 사용자 계층별 차이에 대한 만족도를 분석해 보면 다음과 같다. IoT 서비스 사용자 들은 용이성, 매력성, 신뢰성, 가치성 중 매력성에 가장 큰 관심을 보였으며, 신뢰성이 가장 낮게 나타났다. 4가 지 유형의 전체적인 분석결과 용이성은 보편적인 사항 으로 분석이 되었으나 스마트폰의 사용이 쉽지 않은 60 대에서 가장 낮게 나타났다. 매력성에서는 용이성에서 와 마찬가지의 결과가 나왔다. 신뢰성은 전체적인 계층 에서 거부감을 나타내었으며 특히, 교육정도가 올라가 고 연령이 많아질수록 더욱 낮게 나타났다. 특이 할 점 은 직업별 분류 중 전문직과 직장인의 거부감이 현저함 을 나타내는 것으로 보아 스마트폰 사용 비중이 업무적 으로 많이 이루어지는 계층 일수록 신뢰성이 낮아지는 것으로 보여진다. 마지막으로 가치성을 보게 되면 전체 계층에서 편리한 서비스로 받아 들여지고 있어 서비스 를 제공 받고 활용하는 사용자들에게 굉장한 호감을 보 인 것으로 나타났다. 특이 할 점은 성별 분석과 소득별 분석에서는 통계적으로 유의한 차이가 없다는 분석이 나왔다. 아래의 표 7인 인구통계학적 평균분석 결과를 보여주고 있다.
Table. 7 The demographic average analysis
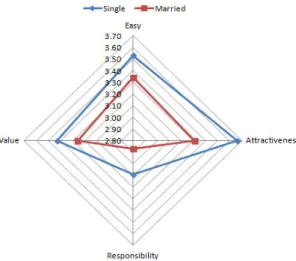
4.2. 계층별 만족도 분석 결과 방사형 그래프 아래 그림 6은 성별 만족도 분석 결과 그래프이다.
Fig. 6 Type of analysis according to Gender
아래 그림 7은 결혼여부별 만족도 분석 결과 그래프 이다. 그림 8은 학력별 만족도 분석 결과 그래프이다.
그림 9는 연령별 만족도 분석 결과 그래프이다. 그림 10 은 소득별 만족도 분석 결과 그래프이다. 그림 11은 직 업별 만족도 분석 결과 그래프이다.
Kinds Easy Attracti
veness Respon
sibility Value Gender Man 3.44 3.44 3.00 3.33 Woman 3.41 3.50 2.93 3.34 Marital
Status
Single 3.53 3.66 3.09 3.43 Married 3.34 3.31 2.87 3.26
Level of education
High school
graduation or less 3.49 3.65 3.20 3.39 High school
graduation 3.62 3.63 3.13 3.48 College graduates 3.30 3.31 2.91 3.21
University
graduate 3.28 3.35 2.81 3.26 Graduate school
or higher 3.53 3.50 2.99 3.34
Age
20's 3.61 3.74 3.19 3.53 30's 3.44 3.58 2.92 3.33 40's 3.28 3.24 2.76 3.13 50's 3.37 3.30 2.92 3.35 60's 2.94 2.78 2.74 2.89
Kinds Easy Attracti
veness Respon sibility Value
Monthly Income
Less than 1
million won 3.52 3.59 3.11 3.44 1~2 million won 3.31 3.44 2.87 3.28 2~3 million won 3.47 3.52 2.98 3.35 3~4 million won 3.41 3.42 2.82 3.28 4~5 million won 3.38 3.38 2.94 3.25 5~6 million won 3.31 3.23 2.87 3.37
More than 6
million won 3.45 3.45 3.09 3.30
Job
Housewife 3.29 3.22 2.83 3.24 Student 3.65 3.71 3.23 3.53 Self-Employment 3.37 3.41 3.08 3.29 Professional 3.35 3.41 2.77 3.15 Sales / Service
jobs 3.73 3.81 3.20 3.70 Office workers 3.35 3.38 2.83 3.27 Inoccupation 3.47 3.51 3.41 3.50 Etc 3.07 3.27 2.91 3.13
Fig. 7 Type of analysis according to Marital Status
Fig. 8 Type of analysis according to Education
Fig. 9 Type of analysis according to Age
Fig. 10 Type of analysis according to Monthly Income
Fig. 11 Type of analysis according to Job
Ⅴ. 결 론
본 연구는 연구의 목적 달성을 위해 양적 접근에 의
존 하였으며, 인구 통계학적 설문 표본을 확보하기 위
해 본 논문 작성자가 표본 대상들을 개별적으로 만나고
논문의 취지를 설명하면서 작성이 시작되었다. 이러한
조건 아래 우리의 생활 속에서 IoT 서비스가 어떤 형태
로 이루어지고 있는지를 살펴봤고, 그 속에서의 다양한
소비패턴이 성별, 결혼여부, 교육정도, 연령, 월소득, 직
업에 따라 어떻게 차이를 보이고 만족도를 나타내며 용
이성, 매력성, 신뢰성, 가치성 4가지의 유형별 특성에
각각 적용하여 일정한 관련성과 차이를 보이는지를 실
증 분석을 통해 입증하는 것이 목적이였다.
IoT 서비스는 온라인과 오프라인을 동시에 만족시키 는 양방향 서비스로 사용자들은 새롭게 탄생한 소비문 화에 관심도가 높아지고 있다. 세계를 대표하는 IT기술 과 인프라를 갖추고 있는 우리는 정보가 생명인 정보사 회에서 살아가고 있다. 이 놀라운 정보기술의 발전은 소비자들의 편리함을 제공하는 차원을 넘어 소비자들 의 소비패턴까지 분석하여 고객 맞춤형 서비스를 제공 해주는 대까지 이르렀다. 스마트폰과 함께하는 생활이 생활의 패턴이 되어버린 우리는 스마트폰으로 하여금 소비자의 정보가 수집, 가공되고 있으며, 이 방대한 양 의 정보는 빅데이터화 되고 있어 우리의 소비 영역에서 큰 영향을 보여주고 있다. 아울러 온라인 소비패턴의 변화가 모바일로 변화되는 지금의 시점에서 이러한 계 층별 만족도 차이를 지속적으로 연구한다면 보다 양질 의 서비스가 맞춤형 제공되어 신 소비패턴 문화로의 탄 생도 조심스레 기대해본다.
본 연구의 핵심인 IoT 서비스를 사용하는 사용자 계 층별 차이에 대한 만족도 분석은 IoT 서비스를 제공하 는 기업의 보다 정확한 고객맞춤형 서비스 제공과 고객 정보 수집의 보다 정확한 타게팅에 도움이 될 것이다.
또한 사회문제로 대두되고 있는 개인정보의 수집에 대 해 소비자들의 원하지 않는 정보의 수집 방법에 대해 기업은 귀를 기울일 필요가 있다.
REFERENCES
[1] M. S. Lee, “Interactivity need for cognition and multitasking effect: Based on the Tablet PC mobile application ad,” M. S Theses, Korea University Graduate School of Media, June 2012.
[2] Internet of Things. [Internet]. Available : https://ko.wikipedia.org/
wiki/IOT.
[3] S. H. Lee, D. W. Lee, “A Study on Internet of Things in IT Convergence Period,” Journal of Digital Convergence, vol.
14, no. 7, pp.267-272, July 2014.
[4] H. W. Kim, D. K. Kim, “IoT technologies and security,”
Journal of The Korea Institute of Information Security &
Cryptology, vol. 22, no. 1, pp.7-13, Feb. 2012.
[5] Gartner. (November, 2014). Gartner Says 4.9 Billion Connected “Things” Will Be in Use in 2015 [Internet].
Available : http://www.gartner.com/newsroom/id/2905717.
[6] Trends of Internet of Things. (July, 2014) [Internet].
Available : http://blog.naver.com/dusl0127/220067546685.
[7] J. J. Choi, “Beacon-based O2O (Online to Offline) Tourist Information System Design and Implementation,” M. S Theses, Chonbuk National University Graduate School of Information Science and Technology, Aug. 2015.
[8] J. A. Lee and S.I. Kim, “Beacons in the IoT user environment analysis and guidelines proposed,” Journal of The
Communication Design Research, vol. 54, no. 1, pp.212-224,
Jan. 2016.박종운(Chong-Woon Park)
2002년 동아방송예술대학 방송기술과 2004년 평택대학교 컴퓨터과학 학사
2006년 ~ 현재 (주)다우리커뮤니케이션즈 기업부설연구소장 / 등기이사 2006년 ~ 현재 한국IT솔루텍 대표
2007년 단국대학교 정책경영대학원 석사“총학생회장”
2016년 한세대학교 대학원 U-city IT융합 도식정책 공학박사
※관심분야 : U-City, 스마트팩토리, IT융합, 빅데이터, CCTV, 출입통제시스템,
권창희(Chang-Hui Kwon)
공학박사
한세대학교 산업보안학과 전임교수
일반대학원 U-City IT융합 도시정책학과 학과장 산업보안안전대학원 재난안전학과 학과장 (사)한국 U-City 학회 회장
※관심분야 : U-City, IT융합, 도시정책, 산업보안, 산업안전, 재난안전, 방재안전