257 Korean Chem. Eng. Res., 58(2), 257-265 (2020)
https://doi.org/10.9713/kcer.2020.58.2.257 PISSN 0304-128X, EISSN 2233-9558
Application of Flory-Treszczanowicz-Benson model and Prigogine-Flory-Patterson theory to Excess Molar Volume of Binary Mixtures of Ethanol with
Diisopropyl Ether, Cyclohexane and Alkanes (C
6-C
9)
Pinki Kashyap*, Manju Rani*,**,†, Dinesh Pratap Tiwari*,*** and So-Jin Park**,†
*Department of Chemical Engineering, Deenbandhu Chhotu Ram University of Science and Technology, Murthal-131 039, India
**Department of Chemical Engineering and Applied Chemistry, College of Engineering, Chungnam National University, 99, Daehak-ro, Yuseong-gu, Daejeon, 34134, Korea
***Rajiv Gandhi Government Engineering College, Kangra-176047, Himachal Pradesh, India (Received 26 July 2019; Received in revised form 4 January 2020; accepted 6 January 2020)
Abstract − Densities (ρ) for binary mixtures of ethanol (1) + diisopropyl ether (DIPE) or cyclohexane or alkane (C6-C9) (2) were measured at 298.15 K, 308.15 K and 318.15 K. The excess molar volume ( ) of binary mixtures was calculated using ρ data and correlated with Redlich-Kister polynomial equation. The values for binary mixtures of ethanol (1) + cyclohexane or n-alkane (C6-C9) (2) were positive, whereas for ethanol (1) + DIPE (2) these were negative.
The magnitude of values follows the order: cyclohexane > n-nonane > n-octane > n-heptane > n-hexane > DIPE. The values have been interpreted qualitatively and also quantitatively in terms of Flory-Treszczanowicz-Benson (FTB) model and Prigogine-Flory-Patterson (PFP) theory. The values predicted using FTB model agree well with experimental values at all mole fractions. But the PFP theory describes well data in ethanol-rich region (x1 > 0.5) for all binary mixtures and is able to predict the sign of vs x1 curve for ethanol-lean region (x1< 0.5) except for ethanol (1) + nonane (2) mixtures.
Key words: Excess molar volume, Ethanol, DIPE, Alkanes, FTB, PFP
VmE VmE VmE
VmE
VmE
VmE VmE
VmE
1. Introduction
Environmental pollution is a major problematic issue these days.
One of the major sources of environmental pollution is poisonous gases and components released by the burning of fuels. Therefore, there is a need to develop environment-friendly fuel using oxygenates which have low emission of CO2 and CO, high-octane rating and high fuel efficiency [1-8]. Oxygenated compounds like ethers and alcohols play an important role in fuel reformulation as they increase octane rating, improve combustion of fuel in engines and reduce environmental pollution. DIPE has high octane number, low toxicity, low production cost and good anti-knocking property [3,9,10]. It is a highly flammable, non-reactive and colorless liquid which is slightly soluble in water but easily miscible with organic compounds. Ethanol is a colorless, low-cost monohydric primary alcohol used as a gasoline additive, gasohol, a mixture of 90% gasoline and 10%
ethanol [11,12]. Methyl t-butyl ether (MTBE) was used as a gasoline additive as it increases the octane number. But due to its high solubility in water, it has polluted the groundwater and contaminated soil due to leakage at gas stations. In the replacement for MTBE, ethanol is being used as an additive for petrol [1,13-15]. Ethanol is a
renewable fuel produced from plants and agricultural wastes. Due to these reasons, researchers are focused on studying the various interactions taking place in the mixture of oxygenate with the components of gasoline such as alkanes, cycloalkane, and aromatics [16,17]. The thermo-physical properties of the mixture and their deviation from ideal mixture helps in understanding the molecular interaction taking place in the mixture [18]. In the present paper, experimental densities (ρ) along with calculated values of excess molar volume ( ) of binary mixture of ethanol with DIPE or cyclohexane or alkane (C6-C9) have been reported from 298.15 K to 318.15 K. FTB model and PFP theory were also used to determine values theoretically and to analyze the various molecular interactions taking place in binary solution.
2. Experimental
Ethanol, cyclohexane and n-alkane (C6–C8) were supplied by Merck, while n-nonane and DIPE were supplied by Sigma Aldrich and Loba, respectively. Ethanol and n-alkane (C6–C9) were simply distilled and their middle fraction was collected. DIPE was purified using standard method [19]. Then all chemicals were kept over molecular sieves (4 Å) for more than 72 hours; their specifications are given in Table 1. Purity of compounds was ensured by measuring the density (ρ) as well as refractive index (nD) of pure compounds and comparing the measured values with literature data [13-15,20- 35] (Table 2). Chemicals were degassed prior to sample preparation.
VmE
VmE
†To whom correspondence should be addressed.
E-mail: [email protected], [email protected]
This is an Open-Access article distributed under the terms of the Creative Com- mons Attribution Non-Commercial License (http://creativecommons.org/licenses/by- nc/3.0) which permits unrestricted non-commercial use, distribution, and reproduc- tion in any medium, provided the original work is properly cited.
The experimental ρ data for mixtures are reported in Table 3 in the temperature range 298.15 to 318.15 K.
The ρ were measured using Anton Paar Density meter (Model DSA5000M) with uncertainty of 10−6 g cm−3. The equipment has two integrated Pt 100 platinum thermometers with a proportional temperature controller which keeps the sample at the required temperature. The apparatus was calibrated at the working temperature with dry air and distilled water. The temperature in the cell was regulated to ±0.001 K with an inbuilt solid-state thermostat by the Peltier method. The density meter performance was ensured by determining the values for the binary mixture of benzene (1) + cyclohexane (2) at 298.15 K, and these agree within the experimental limits with corresponding literature. The nD were measured with refractometer (Abbemat-200) having an accuracy ±1×10⁻⁴ and temperature controlled within ±0.01 K. All samples were prepared by using a weighing balance (OHAUS, AR224CN) having accuracy
±0.1 mg and the uncertainty in mole fraction was 1×10⁻⁴. Experimental ρ values were used to calculate .
VmE
VmE Table 1. Chemicals specifications
S. No. Sample CAS No. Make Mass Fraction Purity Purification Method
1. ethanol 64-17-5 Merck ≥0.999 Distillation
2. diisopropyl ether 108-20-3 Loba ≥0.985 Distillation
3. n-hexane 110-54-3 Merck ≥0.985 Distillation
4. cyclohexane 110-82-7 Merck ≥0.990 Distillation
5. n-heptane 142-82-5 Merck ≥0.990 Distillation
6. n-octane 111-65-9 Merck ≥0.990 Distillation
7. n-nonane 111-84-2 Sigma-Aldrich ≥0.990 Distillation
Table 2. Measured densities (ρ/kg m-3) and refractive indices (nD) of the pure components
Compound T/K ρ nD
This work Literature This work Literature ethanol 298.15 787.08 786.60[15] 1.3612 1.3593[20]
308.15 778.41 777.94[15] 1.3566 1.3553[21]
318.15 769.57 769.15[15] 1.3520 1.3512[21]
di-isopropyl ether 298.15 720.12 719.17[13] 1.3654 1.3652[14]
308.15 709.51 708.12[14] 1.3598 1.3596[22]
318.15 698.71 --- 1.3541 --- n-hexane 298.15 655.56 655.13[23] 1.3733 1.3732[24]
308.15 646.40 646.07[23] 1.3679 1.3672[25]
318.15 637.12 636.79[23] 1.3628 --- cyclohexane 298.15 773.97 773.92[23] 1.4237 1.4235[26]
308.15 764.49 764.51[23] 1.4180 1.4175[27]
318.15 754.89 754.85[23] 1.4123 --- n-heptane 298.15 679.58 679.78[28] 1.3846 1.3852[28]
308.15 671.02 671.27[28] 1.3793 1.3800[28]
318.15 662.34 662.50[29] 1.3740 --- n-octane
298.15 698.72 698.60[30] 1.3953 1.3951[31]
1.3955[15]
308.15 690.60 690.42[32] 1.3902 1.3906[15]
318.15 682.38 682.19[15] 1.3853 1.3849[15]
n-nonane 298.15 713.97 713.96[33] 1.4032 1.4030[33]
308.15 706.15 706.01[34] 1.3985 1.3989[35]
318.15 698.36 698.12[34] 1.3934 1.3938[35]
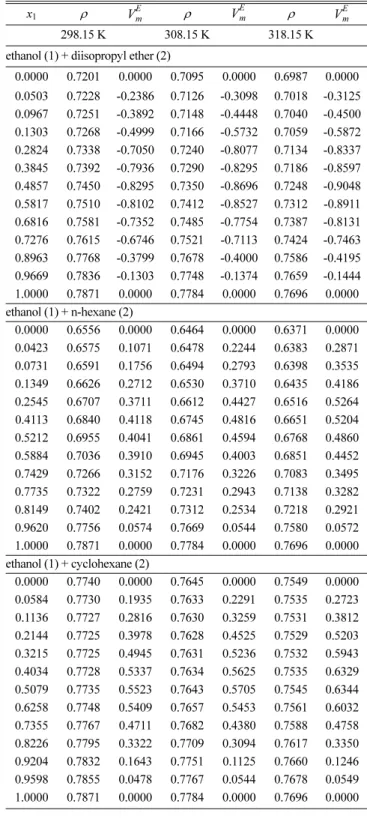
Table 3. Experimental densities (ρ/g cm-3) and excess molar volume ( /cm3mol-1) of binary liquid mixtures
x1 ρ ρ ρ
298.15 K 308.15 K 318.15 K
ethanol (1) + diisopropyl ether (2)
0.0000 0.7201 0.0000 0.7095 0.0000 0.6987 0.0000 0.0503 0.7228 -0.2386 0.7126 -0.3098 0.7018 -0.3125 0.0967 0.7251 -0.3892 0.7148 -0.4448 0.7040 -0.4500 0.1303 0.7268 -0.4999 0.7166 -0.5732 0.7059 -0.5872 0.2824 0.7338 -0.7050 0.7240 -0.8077 0.7134 -0.8337 0.3845 0.7392 -0.7936 0.7290 -0.8295 0.7186 -0.8597 0.4857 0.7450 -0.8295 0.7350 -0.8696 0.7248 -0.9048 0.5817 0.7510 -0.8102 0.7412 -0.8527 0.7312 -0.8911 0.6816 0.7581 -0.7352 0.7485 -0.7754 0.7387 -0.8131 0.7276 0.7615 -0.6746 0.7521 -0.7113 0.7424 -0.7463 0.8963 0.7768 -0.3799 0.7678 -0.4000 0.7586 -0.4195 0.9669 0.7836 -0.1303 0.7748 -0.1374 0.7659 -0.1444 1.0000 0.7871 0.0000 0.7784 0.0000 0.7696 0.0000 ethanol (1) + n-hexane (2)
0.0000 0.6556 0.0000 0.6464 0.0000 0.6371 0.0000 0.0423 0.6575 0.1071 0.6478 0.2244 0.6383 0.2871 0.0731 0.6591 0.1756 0.6494 0.2793 0.6398 0.3535 0.1349 0.6626 0.2712 0.6530 0.3710 0.6435 0.4186 0.2545 0.6707 0.3711 0.6612 0.4427 0.6516 0.5264 0.4113 0.6840 0.4118 0.6745 0.4816 0.6651 0.5204 0.5212 0.6955 0.4041 0.6861 0.4594 0.6768 0.4860 0.5884 0.7036 0.3910 0.6945 0.4003 0.6851 0.4452 0.7429 0.7266 0.3152 0.7176 0.3226 0.7083 0.3495 0.7735 0.7322 0.2759 0.7231 0.2943 0.7138 0.3282 0.8149 0.7402 0.2421 0.7312 0.2534 0.7218 0.2921 0.9620 0.7756 0.0574 0.7669 0.0544 0.7580 0.0572 1.0000 0.7871 0.0000 0.7784 0.0000 0.7696 0.0000 ethanol (1) + cyclohexane (2)
0.0000 0.7740 0.0000 0.7645 0.0000 0.7549 0.0000 0.0584 0.7730 0.1935 0.7633 0.2291 0.7535 0.2723 0.1136 0.7727 0.2816 0.7630 0.3259 0.7531 0.3812 0.2144 0.7725 0.3978 0.7628 0.4525 0.7529 0.5203 0.3215 0.7725 0.4945 0.7631 0.5236 0.7532 0.5943 0.4034 0.7728 0.5337 0.7634 0.5625 0.7535 0.6329 0.5079 0.7735 0.5523 0.7643 0.5705 0.7545 0.6344 0.6258 0.7748 0.5409 0.7657 0.5453 0.7561 0.6032 0.7355 0.7767 0.4711 0.7682 0.4380 0.7588 0.4758 0.8226 0.7795 0.3322 0.7709 0.3094 0.7617 0.3350 0.9204 0.7832 0.1643 0.7751 0.1125 0.7660 0.1246 0.9598 0.7855 0.0478 0.7767 0.0544 0.7678 0.0549 1.0000 0.7871 0.0000 0.7784 0.0000 0.7696 0.0000
VmE
VmE VmE VmE
3. Results
The values were calculated by using Eq. (1) and recorded in Table 3:
(1)
where and ρm represents excess molar volume and density of binary mixture. The ρ1 and ρ2 represent density of pure components.
The calculated values were correlated with Redlich-Kister
polynomial Eq. (2) [36].
(2)
where V(n) represents adjustable parameters. The standard devia- tions were calculated using Eq. (3).
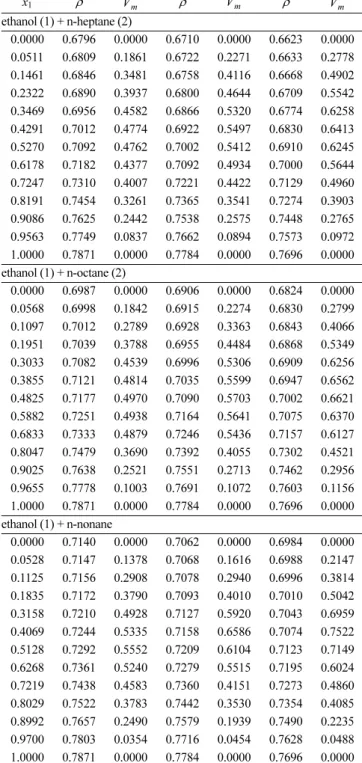
(3) where m and n represent the number of measured data points and number of adjustable parameters, respectively. The choice of n to have 1-4 values was determined by the consideration that the max- imum deviation of as calculated using Eq. (3) from corresponding experimental values satisfied the relation . The adjustable parameters V(n) and standard deviations are given in Table 4. The experimental data for binary mixtures agree well with literature [14,37,38] at 298.15 K as shown in Fig. 1. Effect of temperature on the values of binary system is shown in Fig. 2.
4. Discussion
The values for binary systems of ethanol (1) + cyclohexane or n-alkane (C6-C9) (2) are positive, whereas for ethanol (1) + DIPE (2) mixtures these are negative as shown in Fig. 1 (b). Magnitude of values follows the sequence: cyclohexane > n-nonane > n-octane >
n-heptane > n-hexane > DIPE. The H-bonds in self-associated ethanol broke due to involvement of nonpolar n-alkanes and cycloalkane, resulting in increase in volume [39,40]. The values increased with increase in chain length of n-alkane due to weakening of bonding between the unlike molecules. The positive value of in ethanol
VmE
VmE (x1M1+x2M2) ρm
--- x1M1 ρ1 --- x2M2
ρ2 --- – –
=
VmE
VmE
VmE x1(1–x1) V( )n(2x1–1)(n–1) n–1
∑4
=
σ V( )mE
σ V( )mE ={[Σ V( mE–Vcalcd.(Eq.(2))E )2] m n⁄( – )}1 2⁄
σ V( )mE VmE VmE σmax( ) 2σ VVmE ≤ ( )mE
σ V( )mE VmE
VmE
VmE
VmE
VmE
VmE Table 3. Continued
x1 ρ ρ ρ
ethanol (1) + n-heptane (2)
0.0000 0.6796 0.0000 0.6710 0.0000 0.6623 0.0000 0.0511 0.6809 0.1861 0.6722 0.2271 0.6633 0.2778 0.1461 0.6846 0.3481 0.6758 0.4116 0.6668 0.4902 0.2322 0.6890 0.3937 0.6800 0.4644 0.6709 0.5542 0.3469 0.6956 0.4582 0.6866 0.5320 0.6774 0.6258 0.4291 0.7012 0.4774 0.6922 0.5497 0.6830 0.6413 0.5270 0.7092 0.4762 0.7002 0.5412 0.6910 0.6245 0.6178 0.7182 0.4377 0.7092 0.4934 0.7000 0.5644 0.7247 0.7310 0.4007 0.7221 0.4422 0.7129 0.4960 0.8191 0.7454 0.3261 0.7365 0.3541 0.7274 0.3903 0.9086 0.7625 0.2442 0.7538 0.2575 0.7448 0.2765 0.9563 0.7749 0.0837 0.7662 0.0894 0.7573 0.0972 1.0000 0.7871 0.0000 0.7784 0.0000 0.7696 0.0000 ethanol (1) + n-octane (2)
0.0000 0.6987 0.0000 0.6906 0.0000 0.6824 0.0000 0.0568 0.6998 0.1842 0.6915 0.2274 0.6830 0.2799 0.1097 0.7012 0.2789 0.6928 0.3363 0.6843 0.4066 0.1951 0.7039 0.3788 0.6955 0.4484 0.6868 0.5349 0.3033 0.7082 0.4539 0.6996 0.5306 0.6909 0.6256 0.3855 0.7121 0.4814 0.7035 0.5599 0.6947 0.6562 0.4825 0.7177 0.4970 0.7090 0.5703 0.7002 0.6621 0.5882 0.7251 0.4938 0.7164 0.5641 0.7075 0.6370 0.6833 0.7333 0.4879 0.7246 0.5436 0.7157 0.6127 0.8047 0.7479 0.3690 0.7392 0.4055 0.7302 0.4521 0.9025 0.7638 0.2521 0.7551 0.2713 0.7462 0.2956 0.9655 0.7778 0.1003 0.7691 0.1072 0.7603 0.1156 1.0000 0.7871 0.0000 0.7784 0.0000 0.7696 0.0000 ethanol (1) + n-nonane
0.0000 0.7140 0.0000 0.7062 0.0000 0.6984 0.0000 0.0528 0.7147 0.1378 0.7068 0.1616 0.6988 0.2147 0.1125 0.7156 0.2908 0.7078 0.2940 0.6996 0.3814 0.1835 0.7172 0.3790 0.7093 0.4010 0.7010 0.5042 0.3158 0.7210 0.4928 0.7127 0.5920 0.7043 0.6959 0.4069 0.7244 0.5335 0.7158 0.6586 0.7074 0.7522 0.5128 0.7292 0.5552 0.7209 0.6104 0.7123 0.7149 0.6268 0.7361 0.5240 0.7279 0.5515 0.7195 0.6024 0.7219 0.7438 0.4583 0.7360 0.4151 0.7273 0.4860 0.8029 0.7522 0.3783 0.7442 0.3530 0.7354 0.4085 0.8992 0.7657 0.2490 0.7579 0.1939 0.7490 0.2235 0.9700 0.7803 0.0354 0.7716 0.0454 0.7628 0.0488 1.0000 0.7871 0.0000 0.7784 0.0000 0.7696 0.0000
VmE VmE VmE
Table 4. Values of adjustable parameters (V(n)) of Redlich-Kister equation and standard deviation
Property T/K V(1) V(2) V(3) V(4) ethanol (1) +
diisopropyl ether (2)
298.15 K -3.2547 0.0312 -1.4847 0.4979 0.0001 308.15 K -3.4218 0.1807 -2.0621 0.8437 0.0002 318.15 K -3.5680 0.1240 -2.0730 0.8135 0.0002 ethanol (1) +
n-hexane (2)
298.15 K 1.6371 -0.2304 0.602 -0.4902 0.0001 308.15 K 1.7833 -0.3352 1.2358 -1.6966 0.0003 318.15 K 1.9226 -0.3783 1.799 -2.2322 0.0006 ethanol (1) +
cyclohexane (2)
298.15 K 2.2354 0.3941 0.4649 -1.4407 0.0001 308.15 K 2.2988 0.1424 0.4588 -1.9006 0.0000 318.15 K 2.5559 0.0468 0.6157 -2.2085 0.0001 ethanol (1) +
n-heptane (2)
298.15 K 1.8517 -0.0858 1.3939 -0.4038 0.0003 308.15 K 2.1140 -0.2088 1.5698 -0.6555 0.0004 318.15 K 2.4485 -0.3666 1.7887 -0.9383 0.0004 ethanol (1) +
n-octane (2)
298.15 K 1.9869 0.1821 1.2997 -0.4890 0.0001 308.15 K 2.2771 0.0990 1.4776 -0.7611 0.0001 318.15 K 2.6214 -0.0455 1.7340 -1.0039 0.0001 ethanol (1) +
n-nonane (2)
298.15 K 2.1945 0.046 0.7168 -0.3986 0.0002 308.15 K 2.5049 -0.7420 -0.0654 0.3928 0.0002 318.15 K 2.8520 -0.9552 0.3468 0.1788 0.0002
σ V( mE)
σ V( )mE
(1) + cyclohexane (2) system is due to rupture of hydrogen bonding in ethanol and breakage of cohesive forces in cyclohexane [38].
Positive value of in ethanol (1) + n-alkane (2) is due to breakage of hydrogen bonding in ethanol on mixing with nonpolar n-alkanes (C6-C9). Longer the chain of alkanes, weaker is the interaction between the unlike molecules, as straight chain alkanes get fitted into linearly associated ethanol. Therefore, the for binary mixture of ethanol (1) + n-alkane (2) are lower as compared to the for binary mixture of ethanol (1) + cyclohexane (2). The values for ethanol (1) + DIPE (2) are negative because ethers have an oxygen atom connected to two alkyl groups. Interactions between a polar component (alcohol) and ether form a complex compound containing strong n-π interactions [1]. There is a temperature effect also on values. The values become more positive as temperature increases from 298.15 K - 318.15 K for all binary systems as represented in Fig. 2. This is due to the increase in randomness with increase in temperature as intermolecular forces weaken with temperature rise.
4-1. Prigogine-Flory-Patterson (PFP) theory
Further, PFP theory [41-43] was applied to predict theoretically, according to which is the resultant of three factors: interaction
between unlike molecules, free volume change and change in internal pressure as given in Eq. (4).
(4)
(5)
where all the terms used in Eq. (5) have their standard meaning [41- 43]. The pure component parameters used in PFP theory calculations are given in Table 5 [19,30,44-48]. The and val- ues at equimolar composition along with interactional parameter are given in Table 6. PFP theory is able to predict the sign and shape of the curve. The values computed using Eq. (5) are tabu- lated in Table 7. The values predicted using PFP theory agree well with the experimental data in region with mole fraction x1 >
0.5 for all binary mixtures except for ethanol (1) + nonane (2) for which PFP theory is able to predict only sign and shape of curve as shown in Fig. 3 and Table 7. For the studied binary systems and , which results in a large negative contribution of except in case of ethanol (1) + cyclohexane (2). The is positive for all the binary mixtures except for ethanol (1) + DIPE (2) and the is positive for all binary systems. Patterson et al. [41-43] postulated that the discrepancies between theoretical and experimental values may arise due to additional factors which occur during mixing because PFP theory does not consider all the possible interactions existing in binary mixture. That’s why the Flory- Treszczanowicz-Benson (FTB) model was applied to predict the values, because this model was established for binary mixtures of alkanol (1) + alkane (2).
4-2. Flory-Treszczanowicz-Benson (FTB) model
Treszczanowicz-Benson established a model for alkanol (1) + alkane (2) binary mixtures where alkanol is self-associated by Mecke-Kempter (MK) type association and alkanes behave like inert species. As per FTB model, the is due to combination of two terms: physical contribution term and chemical contribution term [42,49,50].
(6) The chemical contribution of is expressed as [42,49]
(7) where x1, represents mole fraction and the increase in vol- ume per mole of bonds formed between associating molecules (ethanol).
Association constant is calculated by using equation (8) (9) VmE
VmE
VmE VmE
VmE VmE
VmE VmE
VE VinterE Vfree volE VPE*
+ +
= VE x1V1*+x2V2*
--- (V˜–1 3⁄ –1)V˜2 3⁄ ψ1θ2(χ12*⁄P1*) 4 3⁄
( )V˜–1 3⁄ –1
( )
---
= V˜1–V˜2
( )2((14 9⁄ )V˜–1 3⁄ –1)ψ1ψ2
4 3⁄ ( )V˜–1 3⁄ –1
( )
---
– (V˜1–V˜2) P( *1–P2*)ψ1ψ2
P2*ψ1+P1*ψ2
--- + +
VinterE ,Vfree volE VPE*
χ12*
VmE VmE
VmE
VmE P1*>P2* V˜
1 V˜
< 2
VPE*
VinterE
Vfree volE
VmE
VmE
VmE =VMKE +VPhysE
VMKE VMKE =ΔvHox1h K( φ,φ1)
vH0 Δ
Kφ Kφ
ln =1+ln(KH⁄r1) KH=exp[–(ΔhH0–T sΔH0) RT⁄ ] Fig. 1. Excess molar volume of ethanol (1) + diisopropyl ether or
cyclohexane or alkane (C6-C9) (2) as function of mole fraction of ethanol at 298.15 K; solid symbols represent experimental values, lines represent values calculated from Redlich-Kister equation and hollow symbols represent the literature values
*[37], **[38], ***[14].
(10) where r1 is the number of segments in a molecule of first com- ponent, is the characteristic or core molar volume of first component. The values of association parameters , and used to calculate are -10 cm3mol-1, -24400 J mol-1 and -33 J K-1mol-1, respectively [50].
(11) (12) The parameters used to calculate from Flory theory are recorded in Table 5. The binary association parameters Kφ along with interaction parameters χ12 are in Table 6.
(13)
(14)
All the terms used in above equations have their usual meaning [41,42,50]. is calculated using Eq. 12, which includes the effect due to nonspecific interaction between real species in the mixture along with the free volume term. Flory’s equation of state (Eq. 13) was solved to find the value of reduced volume ( ). The reduced temperature ( ) value needed to solve Flory’s equation of state was calculated using Eq. 14. The interaction parameter (χ12) value was calculated using Eq. (12)-(14) by employing equimolar values and using various parameters of pure components (Table 6) [51]. The values calculated by FTB model are in good agreement r1=(V1*⁄17.12 cm3mol–1)
V1*
vHo, hΔ Ho Δ sHo
Δ VMKE
VPhysE =VFloryE =VInteractionE +VFree volumeE
VFloryE V* V˜ V˜
1φ1 V˜
2φ2
( + )
[ – ]
=
VPhysE
T˜V˜4 3⁄ –V˜1 3⁄ +1=0
T˜
φiPi*T˜i
( )
i 1=
∑
2φiPi*
( ) φ– 2θ1χ12 i 1=
∑
2⎝ ⎠
⎜ ⎟
⎛ ⎞
---
=
VFloryE
V˜ T˜
VmE
VmE
Fig. 2. Excess molar volume of ethanol (1) + DIPE or cyclohexane or alkane (C6-C9) (2) as functions of mole fraction of ethanol at T=298.15 K, 308.15 K and 318.15K.
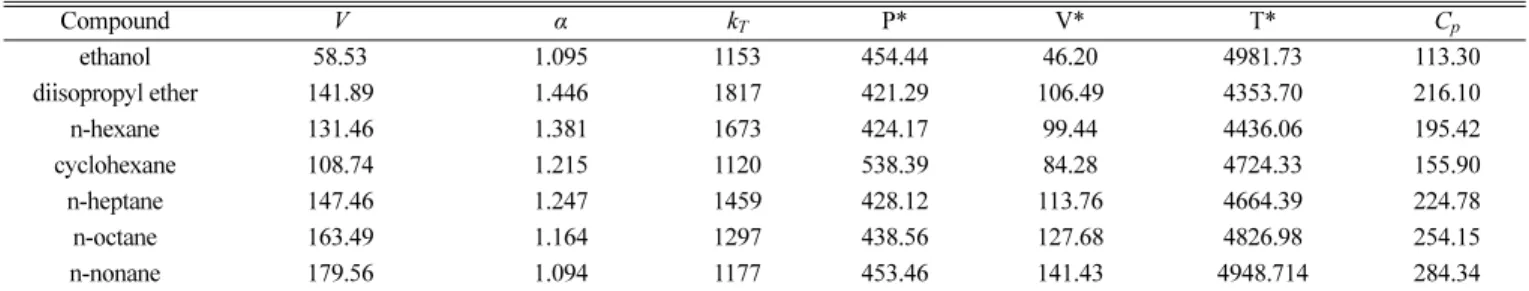
Table 5. Molar volume (V/cm3mol-1), isobaric expansivity (103 α/K-1), isothermal compressibility (106 kT/cm3J-1), characteristic pressure (P*/Jcm-3), characteristic molar volume (V*/cm3mol-1) and characteristic temperature (T*/K) and specific heat at constant pressure (Cp/Jmol-1K-1) obtained from Flory theory for the pure liquids at 298.15 K
Compound V α kT P* V* T* Cp
ethanol 58.53 1.095 1153 454.44 46.20 4981.73 113.30
diisopropyl ether 141.89 1.446 1817 421.29 106.49 4353.70 216.10
n-hexane 131.46 1.381 1673 424.17 99.44 4436.06 195.42
cyclohexane 108.74 1.215 1120 538.39 84.28 4724.33 155.90
n-heptane 147.46 1.247 1459 428.12 113.76 4664.39 224.78
n-octane 163.49 1.164 1297 438.56 127.68 4826.98 254.15
n-nonane 179.56 1.094 1177 453.46 141.43 4948.714 284.34
Table 6. PFP interaction parameter ( ) and values of the various contributions at (x1=0.5) to excess volume as well as Flory-Treszczanowicz- Benson (FTB) association model parameters (Kφ) and (χ12) at 298.15 K
System
ethanol (1) + diisopropyl ether (2) -0.6272 0.1052 -0.0813 -35.43 358.32 -44.69
ethanol (1) + n-hexane (2) 0.5424 0.0725 -0.0607 32.58 358.32 24.70
ethanol (1) + cyclohexane (2) 0.5128 0.0114 0.0574 41.90 358.32 32.29
ethanol (1) + n-heptane (2) 0.5136 0.0215 -0.0292 32.56 358.32 23.18
ethanol (1) + n-octane (2) 0.5096 0.0047 -0.0082 33.79 358.32 22.99
ethanol (1) + n-nonane (2) 0.5489 0.0002 -0.0001 38.00 358.32 25.67
χ12*
VInterE VFree volE VPE* χ12* Kφ χ12
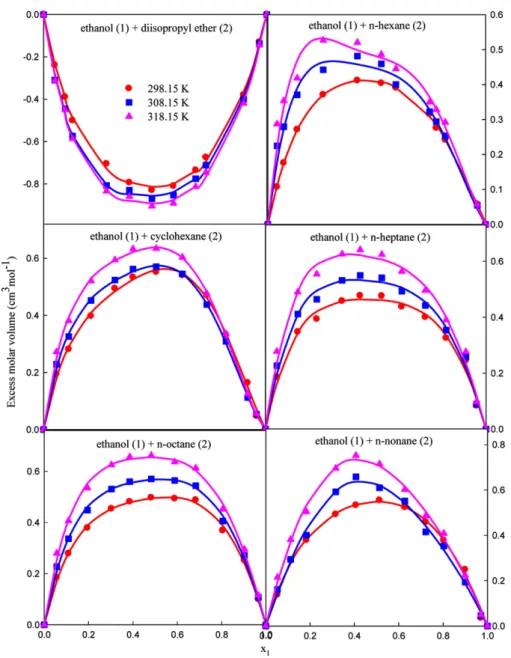
Fig. 3. Excess molar volume of ethanol (1) + DIPE or cyclohexane or alkane (C6-C9) (2) as function of mole fraction of ethanol at 298.15 K.
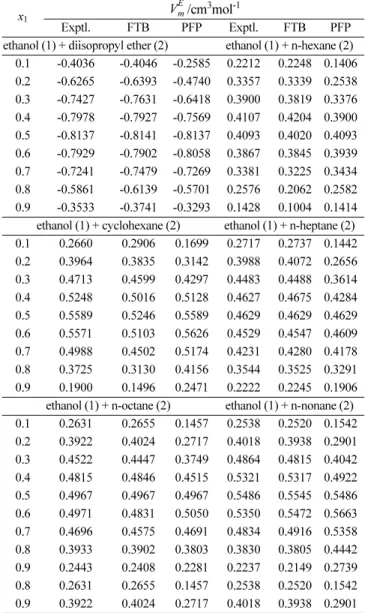
with experimental values at all mole fractions as shown in Fig. 3. FTB model correctly predicted the sign and shape of vs x1 curves. The characteristic skewing of toward high concentration of ethanol (x1
> 0.5) is well described by this model. In this model, only one associating compound (an alkanol) is taken into account, showing maximum at the high alkanol concentration area (Fig. 3) [52].
5. Conclusions
The ρ values of ethanol (1) + DIPE, cyclohexane or alkane (C6- C9) (2) were measured at 298.15 K, 308.15 K and 318.15 K. The measured ρ values were used to compute of binary mixtures.
The for binary systems of ethanol (1) + cyclohexane or alkanes (C6-C9) (2) are positive, whereas the for ethanol (1) + DIPE (2) are negative. The data has been interpreted quantitatively and qualitatively in terms of PFP theory and FTB model. The values
predicted by PFP theory agree well with the experimental data in region with mole fraction x1 > 0.5 for all six binary systems, while PFP theory was only able to describe the sign of values at mole fraction x1 < 0.5. The values calculated by FTB model are in good agreement with experimental values over the whole composition range for all the studied binary systems.
Acknowledgment
For the financial support Pinki Kashyap acknowledges the University Grant Commission, New Delhi (as SRF).
References
1. Canosa, J., Rodrı́guez, A. and Tojo, J., “Binary Mixture Proper- ties of Diethyl Ether with Alcohols and Alkanes from 288.15 K to 298.15 K,” Fluid Phase Equilibria, 156, 57-71(1999).
2. Gahlyan, S., Rani, M. and Maken, S., “Excess Molar Volume of Binary Mixtures Containing an Oxygenate,” J. Molecular Liq- uids, 199, 42-50(2014).
3. Zhou, X., Chen, Y., Wang, C., Guo, J. and Wen, C., (Liquid + liquid) equilibria for (water + 1-propanol + diisopropyl ether + octane, or methylbenzene, or heptane) systems at T = 298.15 K, J. of Chem- ical Thermodynamics, 87, 13-22(2015).
4. Gahlyan, S., Verma, S., Rani, M. and Maken, S., “Measurements and Modeling of Excess Molar Enthalpy of Binary Mixtures of Oxygenate and Hydrocarbons,” Asian J. of Chemistry, 30, 731- 735(2018).
5. Sim, H.-W. and Kim, M. G., “Excess Volume and Excess Enthalpy of Binary Mixtures Composed of 1,2-dichloropropane and 1- alkanol (C 5-C 8),” Korean J. Chem. Eng., 33, 271-276(2016).
6. Lee, M. H. and You, S.-S., “Measurement and Correlation of Excess Enthalpies for water + ethanol + 1-buthyl 3-methylimid- aozolium Tetrafluoroborate System, Korean J. Chem. Eng., 34, 2027-2032(2017).
7. Dubey, G. P. and Sharma, M., “Thermophysical Properties of Binary Mixtures of 2-Methyl-1-propanol with Hexane, Octane, and Decane at 298.15 K,” J. Chem. Eng. Data, 52, 449-453(2007).
8. Lee, K.-H., Gu, J.-E., Oh, H.-Y. and Park, S.-J., “Solid-liquid Phase Equilibria, Excess Molar Volume, and Molar Refraction Deviation for the Mixtures of Ethanoic Acid with Propanoic, Butanoic, and Pentanoic Acid,” Korean J. Chem. Eng., 35, 1710- 1715(2018).
9. Contreras S, M., “Densities and Viscosities of Binary Mixtures of 1,4-Dioxane with 1-Propanol and 2-Propanol at (25, 30, 35, and 40)oC,” J. Chem. Eng. Data, 46, 1149-1152(2001).
10. Ulbig, P., Bubolz, M., Kornek, C. and Schulz, S., Excess Volumes of Binary Mixtures Containing Diisopropyl Ether + 1-Butanol or Diisopropyl Ether + Diethyl Ketone and Ethanol + Heptane at High Pressures,” J. Chem. Eng. Data, 42, 449-452(1997).
11. Cho, J.-S., Lim, J.-S., Kim, J.-D., Lee, Y.-Y. and Chun, H.-S., “A Study on Concentration of Ethanol by Supercritical Fluids and Salts (II)-High Pressure Vapor-Liquid Equilibria for CO2-C2H5OH-H2O System,” Korean Chem. Eng. Res., 29, 487-487(1991).
12. Kashyap, P., Rani, M., Tiwari, D. P. and Park, S.-J., “Measure- ment and Modeling of Transport Properties of Binary Liquid VmE
VmE
VmE VmE
VmE VmE
VmE
VmE VmE
Table 7. Comparison of excess molar volume ( ) values calculated from Flory-Treszczanowicz-Benson association model and Prigogine-Flory-Patterson theory with their corresponding experimental values at 298.15 K
x1 /cm3mol-1
Exptl. FTB PFP Exptl. FTB PFP
ethanol (1) + diisopropyl ether (2) ethanol (1) + n-hexane (2) 0.1 -0.4036 -0.4046 -0.2585 0.2212 0.2248 0.1406 0.2 -0.6265 -0.6393 -0.4740 0.3357 0.3339 0.2538 0.3 -0.7427 -0.7631 -0.6418 0.3900 0.3819 0.3376 0.4 -0.7978 -0.7927 -0.7569 0.4107 0.4204 0.3900 0.5 -0.8137 -0.8141 -0.8137 0.4093 0.4020 0.4093 0.6 -0.7929 -0.7902 -0.8058 0.3867 0.3845 0.3939 0.7 -0.7241 -0.7479 -0.7269 0.3381 0.3225 0.3434 0.8 -0.5861 -0.6139 -0.5701 0.2576 0.2062 0.2582 0.9 -0.3533 -0.3741 -0.3293 0.1428 0.1004 0.1414 ethanol (1) + cyclohexane (2) ethanol (1) + n-heptane (2) 0.1 0.2660 0.2906 0.1699 0.2717 0.2737 0.1442 0.2 0.3964 0.3835 0.3142 0.3988 0.4072 0.2656 0.3 0.4713 0.4599 0.4297 0.4483 0.4488 0.3614 0.4 0.5248 0.5016 0.5128 0.4627 0.4675 0.4284 0.5 0.5589 0.5246 0.5589 0.4629 0.4629 0.4629 0.6 0.5571 0.5103 0.5626 0.4529 0.4547 0.4609 0.7 0.4988 0.4502 0.5174 0.4231 0.4280 0.4178 0.8 0.3725 0.3130 0.4156 0.3544 0.3525 0.3291 0.9 0.1900 0.1496 0.2471 0.2222 0.2245 0.1906 ethanol (1) + n-octane (2) ethanol (1) + n-nonane (2) 0.1 0.2631 0.2655 0.1457 0.2538 0.2520 0.1542 0.2 0.3922 0.4024 0.2717 0.4018 0.3938 0.2901 0.3 0.4522 0.4447 0.3749 0.4864 0.4815 0.4042 0.4 0.4815 0.4846 0.4515 0.5321 0.5317 0.4922 0.5 0.4967 0.4967 0.4967 0.5486 0.5545 0.5486 0.6 0.4971 0.4831 0.5050 0.5350 0.5472 0.5663 0.7 0.4696 0.4575 0.4691 0.4834 0.4916 0.5358 0.8 0.3933 0.3902 0.3803 0.3830 0.3805 0.4442 0.9 0.2443 0.2408 0.2281 0.2237 0.2149 0.2739 0.8 0.2631 0.2655 0.1457 0.2538 0.2520 0.1542 0.9 0.3922 0.4024 0.2717 0.4018 0.3938 0.2901
VmE
VmE
Mixtures Containing Oxygenates and n-alkanes,” Korean J. Chem.
Eng., 36, 1922-1931(2019).
13. Atik, Z. and Lourddani, K., “Densities and Volumetric Proper- ties of Binary and Ternary Mixtures of Diisopropyl Ether, Fluo- robenzene, α,α,α-Trifluorotoluene, and Ethanol at Temperature 298.15 K and Pressure 101 kPa,” J. Solution Chem., 35, 1453- 1466(2006).
14. Chen, H.-W. and Tu, C.-H., “Densities, Viscosities, and Refractive Indices for Binary and Ternary Mixtures of Diisopropyl Ether, Ethanol, and 2,2,4-Trimethylpentane,” J. Chem. Eng. Data, 51, 261-267(2006).
15. Estrada-Baltazar, A., Iglesias-Silva, G. A. and Caballero-Cerón, C., “Volumetric and Transport Properties of Binary Mixtures of n-Octane + Ethanol, + 1-Propanol, + 1-Butanol, and + 1-Pentanol from (293.15 to 323.15) K at Atmospheric Pressure,” J. Chem.
Eng. Data, 58, 3351-3363(2013).
16. Kim, Y.-W. and Kim, M.-G., “Excess Molar Enthalpies and Excess Molar Volumes of {1, 2-dichloropropane+1, 3-dioxolane, and+
1, 4-dioxane} at the Temperature 298.15 K,” Korean Chem. Eng.
Res., 42, 426-432(2004).
17. Rhim, J.-N. and Park, S.-S., “A Study on the Derivation of Isobaric Vapor-liquid Equilibrium Data from Isothermal Vapor-liquid Equi- librium Data for Ternary Systems,” Korean Chem. Eng. Res., 13, 147-147(1975).
18. Kim, J. and Kim, M., “Excess Molar Enthalpies and Excess Molar Volumes for the Binary Mixtures {1, 2-dichloropropane + 2-(2- methoxyethoxy) ethanol, and + 2-(2-ethoxyethoxy) ethanol} at 298.15 K,” Korean Chem. Eng. Res., 44, 444-452(2006).
19. Riddick, A., Bunger, W. and Sakano, T., Physical Properties and Methods of Purification, Organic Solvents, vol. II. 1986, Wiley, New York.
20. Jiménez, E., Casas, H., Segade, L. and Franjo, C., Surface Ten- sions, Refractive Indexes and Excess Molar Volumes of Hexane + 1-Alkanol Mixtures at 298.15 K,” J. Chem. Eng. Data, 45, 862-866(2000).
21. Ortega, J., “Densities and Refractive Indices of Pure Alcohols as a Function of Temperature,” J. Chem. Eng. Data, 27, 312-317 (1982).
22. Dash, S., Pradhan, S., Dalai, B., Moharana, L. and Swain, B.,
“Studies on Molecular Interaction in Binary Mixtures of Diethyl Ether with Some Alkanols–an Acoustic Approach,” Physics and Chemistry of Liquids, 50, 735-749(2012).
23. Aicart, E., Tardajos, G. and Diaz Pena, M., “Isothermal Compress- ibility of Cyclohexane + n-hexane, Cyclohexane + n-heptane, Cyclo- hexane + n-octane, and Cyclohexane + n-nonane,” J. Chem. Eng.
Data, 25, 140-145(1980).
24. Aucejo, A., Burguet, M. C., Munoz, R. and Marques, J. L., “Den- sities, Viscosities, and Refractive Indices of Some n-Alkane Binary Liquid Systems at 298.15 K,” J. Chem. Eng. Data, 40, 141-147(1995).
25. Aminabhavi, T. M. and Patil, V. B., “Density, Refractive Index, Viscosity, and Speed of Sound in Binary Mixtures of Ethenyl- benzene with Hexane, Heptane, Octane, Nonane, Decane, and Dodecane,” J. Chem. Eng. Data, 42, 641-646(1997).
26. Shekaari, H., Zafarani-Moattar, M. T. and Behrooz, N. J., “Volu- metric, Acoustic, and Refractometric Properties of (thiophene+
hexane/cyclohexane) Solutions in the Presence of Some Imidaz- olium Based Ionic Liquids at T=298.15 K,” J. Chemical Thermo-
dynamics, 86, 188-195(2015).
27. Aminabhavi, T. M., Patil, V. B., Aralaguppi, M. I. and Phayde, H. T. S., Density, “Viscosity, and Refractive Index of the Binary Mixtures of Cyclohexane with Hexane, Heptane, Octane, Nonane, and Decane at (298.15, 303.15, and 308.15) K,” J. Chem. Eng.
Data, 41, 521-525(1996).
28. Alonso, E., Guerrero, H., Montaño, D., Lafuente, C. and Artigas, H., “Thermophysical Study of the n-hexane or n-heptane with 1- chloropropane Systems,” Thermochimica Acta, 525, 71-77(2011).
29. Kouris, S. and Panayiotou, C., “Dynamic Viscosity of Mixtures of Benzene, Ethanol, and n-heptane at 298.15 K,” J. Chem. Eng.
Data, 34, 200-203(1989).
30. Dubey, G. P. and Sharma, M., “Acoustical and Excess Properties of {1-hexanol+n-hexane, or n-octane, or n-decane} at (298.15, 303.15, and 308.15) K,” J. Molecular Liquids, 142, 124-129(2008).
31. Orge, B., Rodríguez, A., Canosa, J. M., Marino, G., Iglesias, M.
and Tojo, J., “Variation of Densities, Refractive Indices, and Speeds of Sound with Temperature of Methanol or Ethanol with Hexane, Heptane, and Octane,” J. Chem. Eng. Data, 44, 1041-1047(1999).
32. Dubey, G. P. and Sharma, M., “Study of Molecular Interactions in Binary Liquid Mixtures of 1-octanol with n-hexane, n-octane, and n-decane Using Volumetric, Viscometric, and Acoustic Proper- ties,” J. Chemical Thermodynamics, 40, 991-1000(2008).
33. Gayol, A., Iglesias, M., Goenaga, J. M., Concha, R. G. and Resa, J. M., “Temperature Influence on Solution Properties of Ethanol + n-alkane Mixtures,” J. Molecular Liquids, 135, 105-114(2007).
34. Landaverde-Cortes, D. C., Iglesias-Silva, G. A., Ramos-Estrada, M. and Hall, K. R., “Densities and Viscosities of MTBE + Nonane or Decane at p = 0.1 MPa from (273.15 to 363.15) K,” J. Chem.
Eng. Data, 53, 288-292(2008).
35. Aminabhavi, T. M. and Bindu, G., “Densities, Viscosities, Refrac- tive Indices, and Speeds of Sound of the Binary Mixtures of Bis (2-methoxyethyl) Ether with Nonane,Decane, Dodecane, Tetradec- ane, and Hexadecane at 298.15, 308.15, and 318.15 K,” J. Chem.
Eng. Data, 39, 529-534(1994).
36. Redlich, O. and Kister, A. T., “Algebraic Representation of Ther- modynamic Properties and the Classification of Solutions,” Indus- trial & Engineering Chemistry, 40, 345-348(1948).
37. Orge, B., Iglesias, M., Rodriguez, A., Canosa, J. and Tojo, J., Mix- ing Properties of (methanol, ethanol, or 1-propanol) with (n-pentane, n- hexane, n-heptane and n-octane) at 298.15 K,” Fluid Phase Equilib- ria, 133, 213-227(1997).
38. González, B., Calvar, N., Domínguez, Á. and Tojo, J., “Dynamic Viscosities of Binary Mixtures of Cycloalkanes with Primary Alco- hols at T=(293.15, 298.15, and 303.15)K: New UNIFAC-VISCO Interaction Parameters,” J. Chemical Thermodynamics, 39, 322- 334(2007).
39. Kashyap, P., Rani, M., Gahlyan, S., Tiwari, D. P. and Maken, S.,
“Volumetric, Acoustic and Optical Properties of Binary Mixtures of 2-propanol with n-alkanes (C6-C10) from 293.15 K to 303.15 K,” J. Molecular Liquids, 268, 303-314(2018).
40. Jeschke, P. and Schneider, G. M., “Excess Volumes of Liquid Mix- tures at High Pressures III. The Systems Toluene + methylcyclohex- ane and 2-propanol + heptane from 10 to 250 MPa at 298.15 K,”
J. Chemical Thermodynamics, 10, 803-808(1978).
41. Patterson, D. and Delmas, G., “Corresponding States Theories and Liquid Models,” Discussions of the Faraday Society, 49, 98-
105(1970).
42. Flory, P. J., “Statistical Thermodynamics of Liquid Mixtures,” J.
American Chemical Society, 87, 1833-1838(1965).
43. Abe, A. and Flory, P., “The Thermodynamic Properties of Mixtures of Small, Nonpolar Molecules,” J. American Chemical Society, 87, 1838-1846(1965).
44. George, J. and Sastry, N. V., “Thermophysical Properties of Binary Mixtures of Methyl Methacrylate+Di-Ethers (Ethyl, Isopropyl, and Butyl) at 298.15 and 308.15 K,” International J. of Thermo- physics, 24, 1697-1719(2003).
45. Vercher, E., Orchillés, A. V., Miguel, P. J. and Martínez-Andreu, A., “Volumetric and Ultrasonic Studies of 1-ethyl-3-methylimid- azolium Trifluoromethanesulfonate Ionic Liquid with Methanol, Ethanol, 1-propanol, and Water at Several Temperatures,” J. Chem.
Eng. Data, 52, 1468-1482(2007).
46. Piñeiro, Á., Amigo, A., Bravo, R. and Brocos, P., “Re-examination and Symmetrization of the Adjustable Parameters of the ERAS Model: Review on Its Formulation and Application,” Fluid Phase Equilibria, 173, 211-239(2000).
47. García-Miaja, G., Troncoso, J. and Romaní, L., “Excess Properties for Binary Systems Ionic Liquid+ethanol: Experimental Results and Theoretical Description Using the ERAS Model, Fluid Phase
Equilibria, 274, 59-67(2008).
48. Calvo, E., Brocos, P., Bravo, R., Pintos, M., Amigo, A., Roux, A. H. and Roux-Desgranges, G., “Heat Capacities, Excess Enthal- pies, and Volumes of Mixtures Containing Cyclic Ethers. 1. Binary Systems 1, 4-dioxane + n-alkanes,” J. Chem. Eng. Data, 43, 105- 111(1998).
49. Rani, M. and Maken, S., Thermodynamics of Molecular Interac- tions in Binary Mixtures Containing Associated Liquids,” Korean J.
Chem. Eng., 30, 1636-1643(2013).
50. Treszczanowicz, A. J. and Benson, G. C., “Excess Volumes of Alkanol + alkane Binary Systems in Terms of an Association Model with a Flory Contribution Term,” Fluid Phase Equilibria, 23, 117-135(1985).
51. Singh, K. C., Kalra, K. C., Maken, S. and Gupta, V., “Excess Molar Enthalpies of Mixing of 1-propanol or 2-propanol with Aro- matic Hydrocarbons at 308.15 K in Terms of an Association Model,”
Fluid Phase Equilibria, 119, 175-190(1996).
52. Letcher, T. M., Domañska, U. and Mwenesongole, E., “The Excess Molar Volumes of (N-methyl-2-pyrrolidone + an alkanol or a hydrocarbon) at 298.15 K and the Application of the Flory–
Benson–Treszczanowicz and the Extended Real Associated Solu- tion theories, Fluid phase equilibria, 149, 323-337(1998).